Debugging Kibana Dashboards


 Share on Twitter
Share on Twitter

 Share on LinkedIn
Share on LinkedIn

 Share on Facebook
Share on Facebook

 Share by Email
Share by Email

 Print this page
Print
Kibana dashboards allow you to build visualizations quickly and easily on top of data indexed within Elasticsearch. However, the UI abstraction over Elasticsearch can make it tricky to diagnose performance issues in individual panels — especially for developers used to diving into the detail of implementations using debuggers and other profiling tools.
This blog introduces four approaches to help investigate and diagnose performance issues with Kibana dashboards. Specifically, we'll cover the use of Elastic application performance monitoring (APM), debugging via Chrome Developer Tools and profiling, inspecting individual panels via the Inspector, and the Elasticsearch Slow Log to identify the cause of dashboard slowness.
APM
When faced with a slow dashboard, ruling out slow performance caused by the overall dashboard loading in Kibana itself is recommended. It may be a particular service or plugin that is causing the underlying issue. This can be achieved either using the Chrome DevTools debugging or using Elastic APM Node.js Agent, which is built into Kibana for debugging purposes. Follow the steps to set up a locally running Kibana and APM configuration using the Debugging Kibana section within the Developer guide. Following these steps will set up a locally running Elasticsearch instance and APM server using Docker:
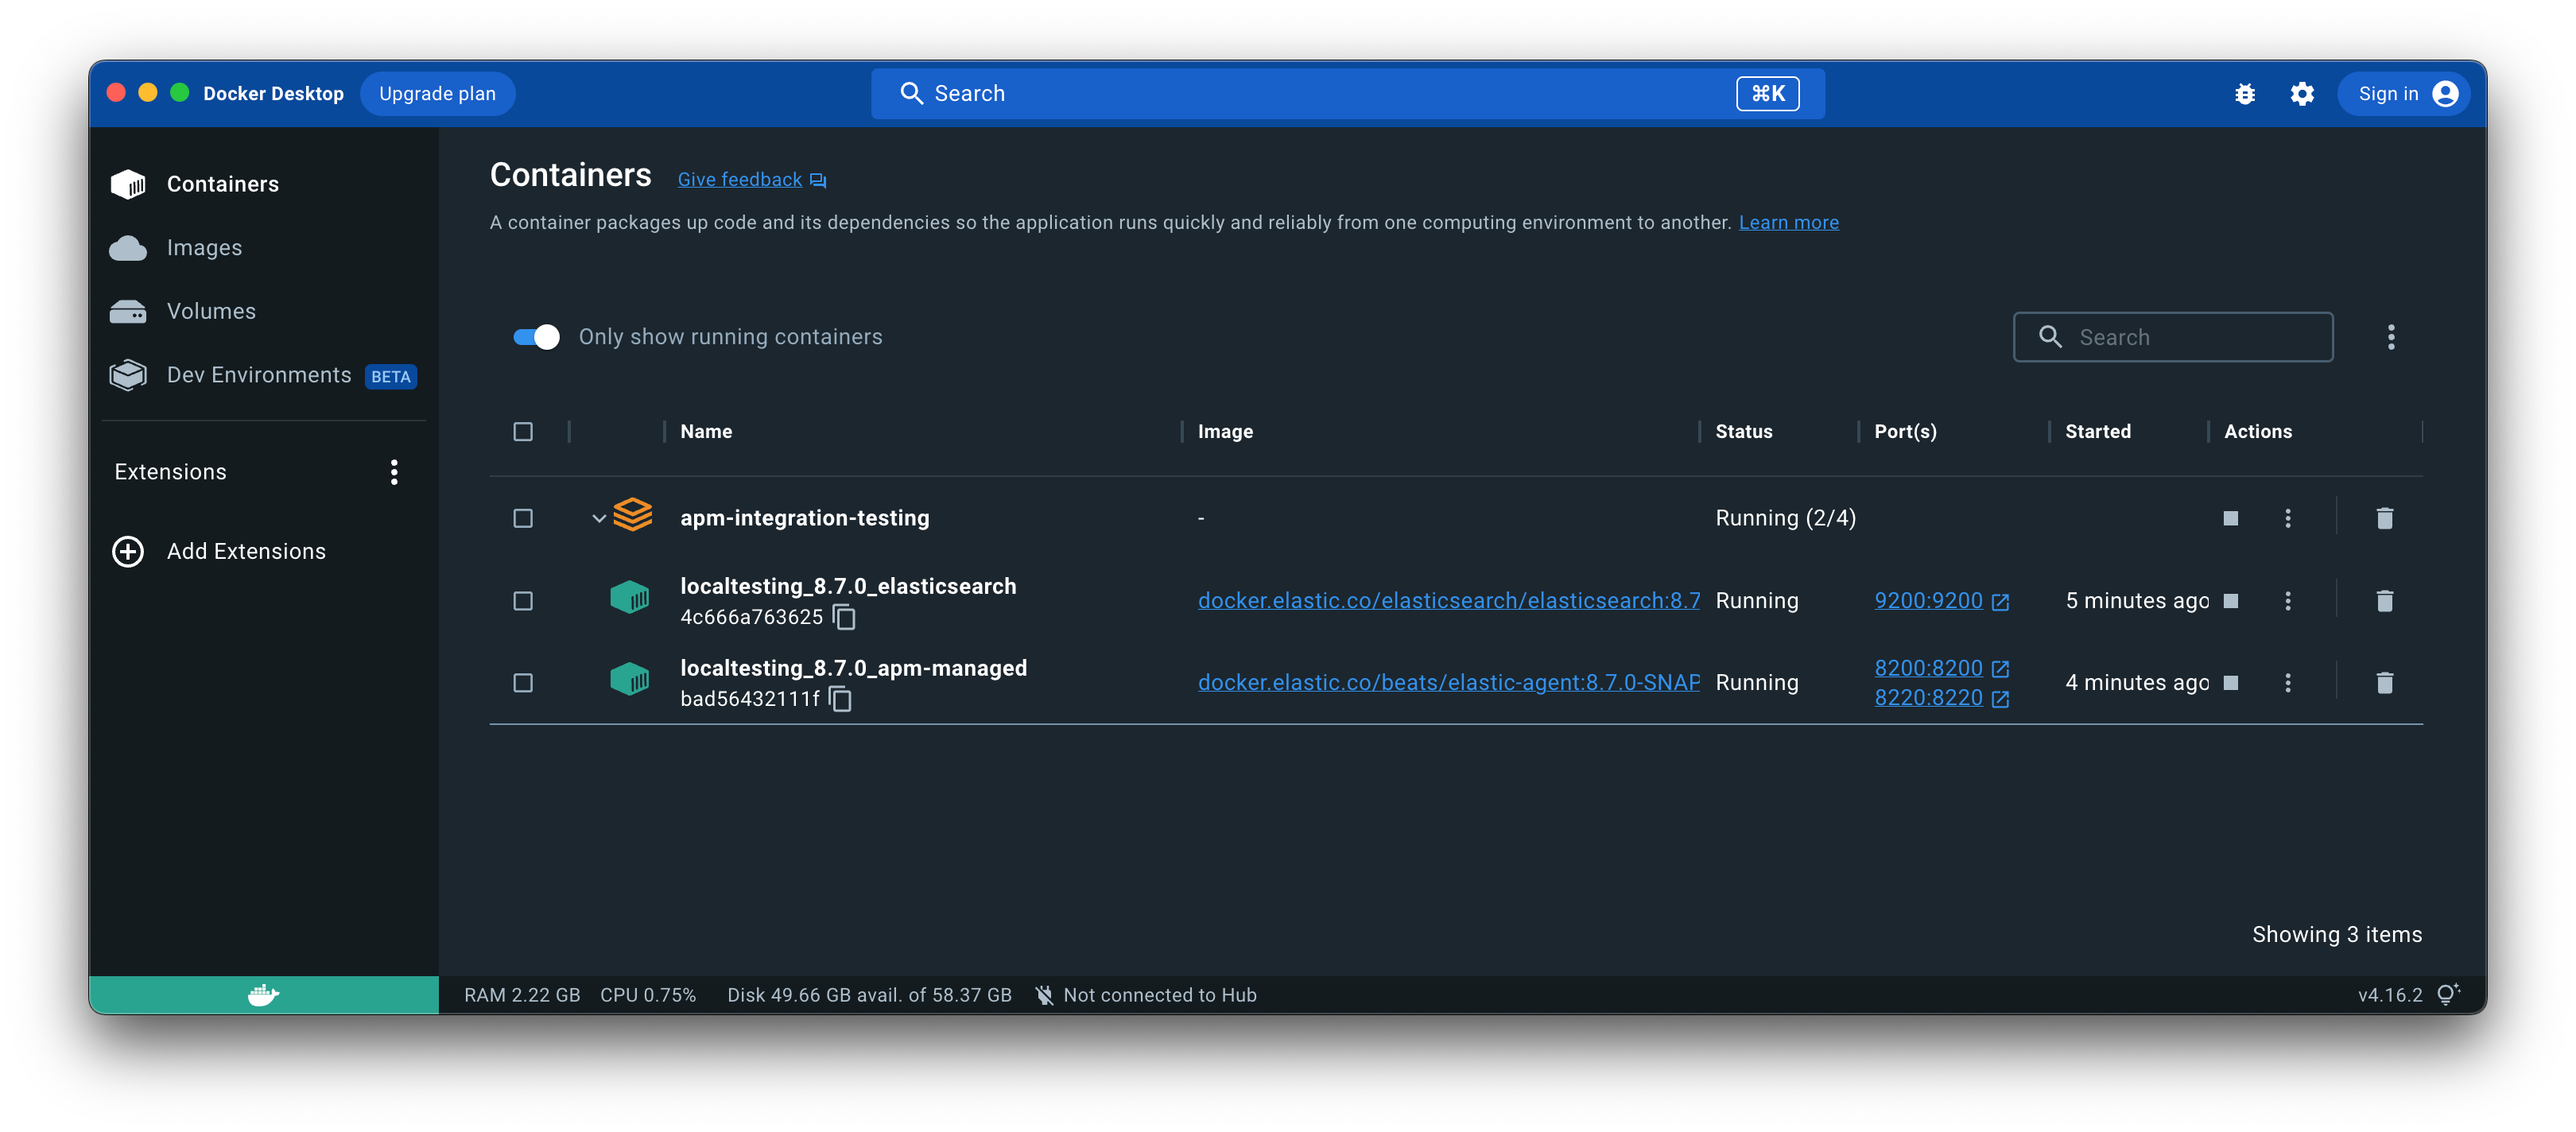
To ensure Kibana starts successfully, please ensure you check out branches from each repo that hold compatible Elasticsearch and Kibana versions, and that kibana.dev.yml configuration points to your locally running Elasticsearch cluster and APM server. Sample user credentials for Kibana including admin can be used to log in as outlined in the @elastic/apm-integration-testing readme. Using the yarn start command on the Kibana repo will give you a running Kibana instance.
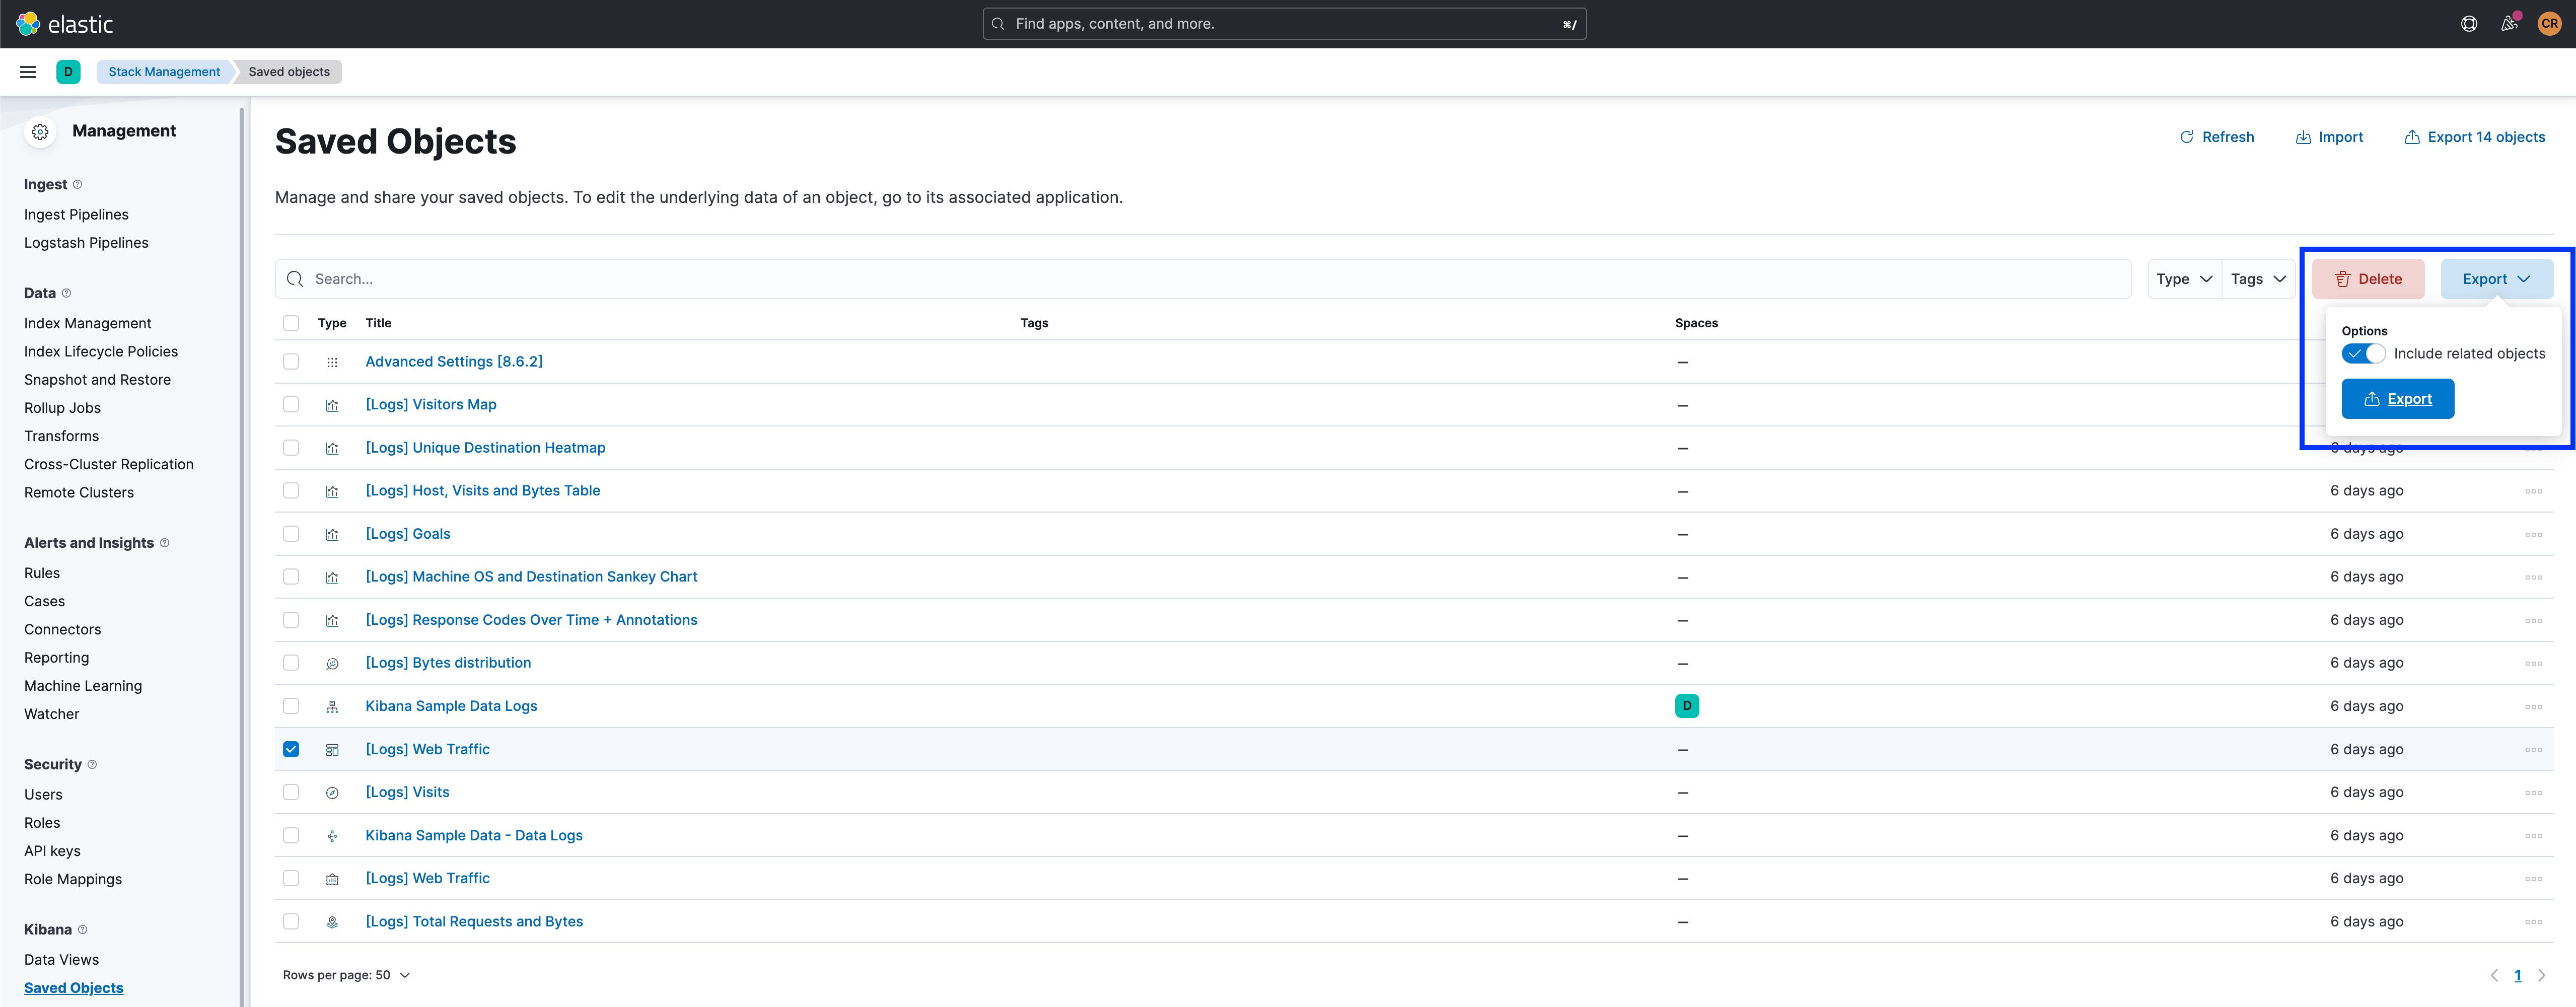
Including the non-performance dashboard can be achieved by exporting the dashboard from the Saved Objects screen in Kibana and importing it into the locally running instance via the same screen. Be sure to export dependent objects so individual controls and indices are exported with the dashboard:
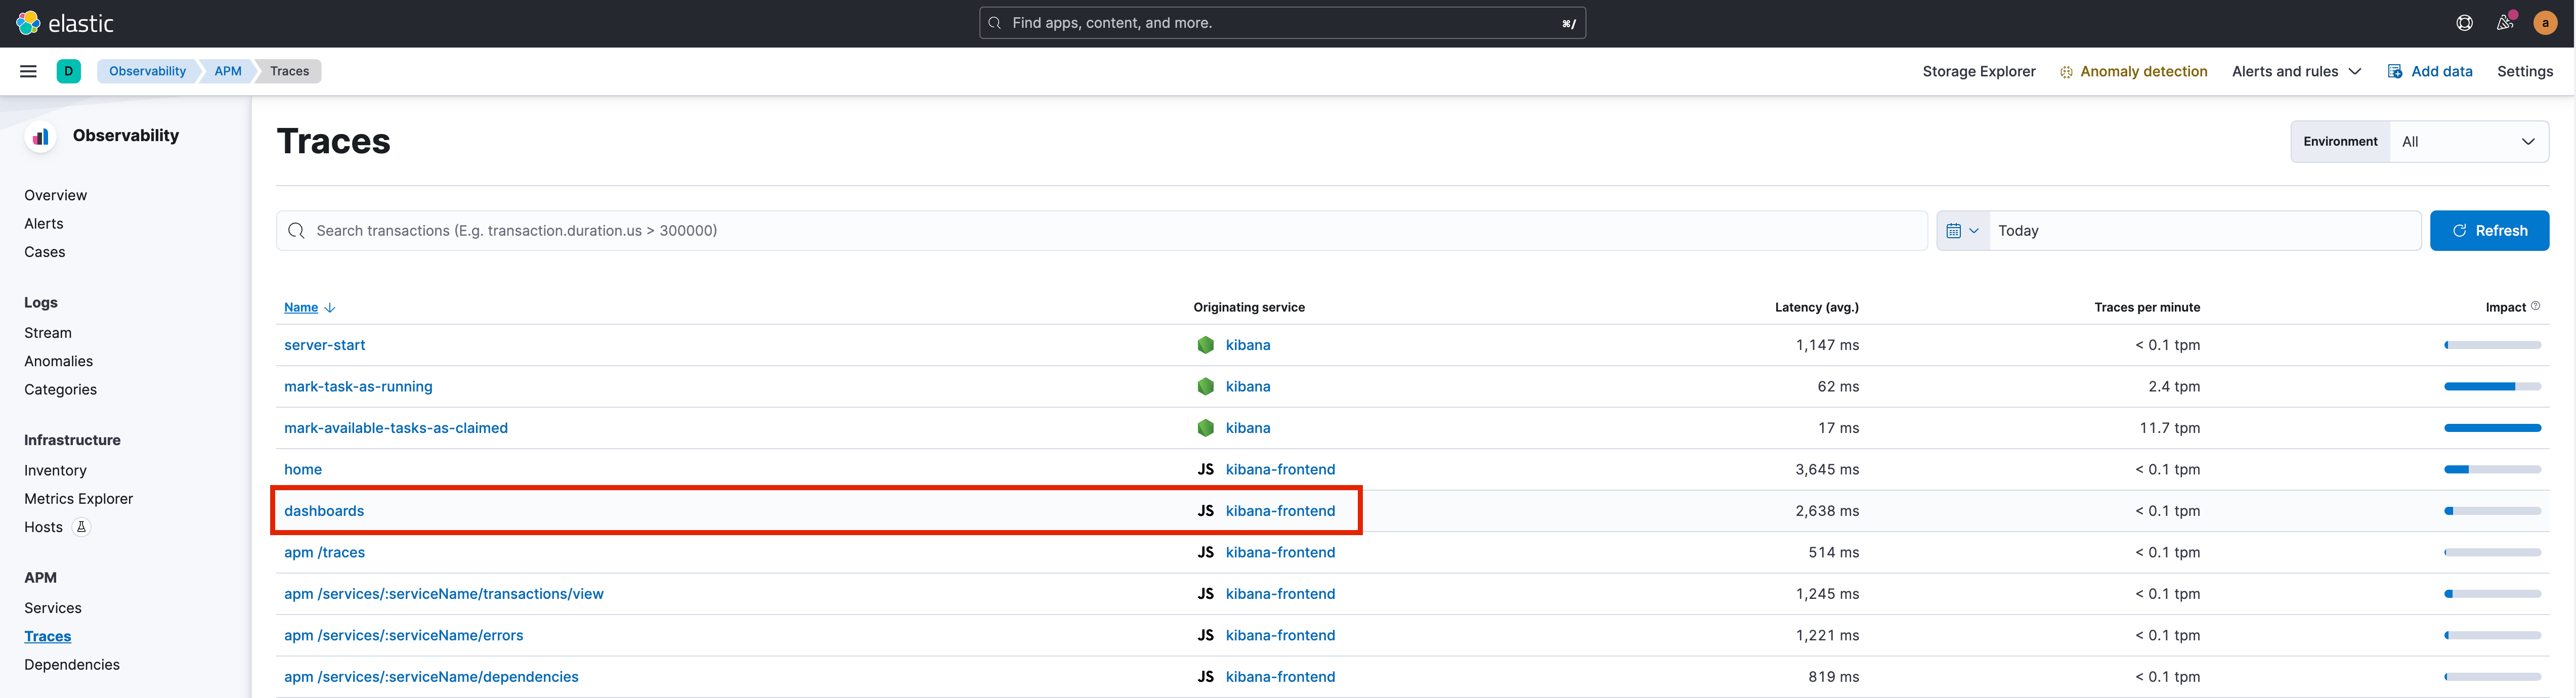
Accessing your dashboard locally will allow the APM Node.js Agent to capture any errors and traces in the dashboard navigation. You will see the /dashboard endpoint triggered to access your dashboard. APM will capture these requests in the kibana-frontend service.
Selecting this trace will present you with key trace information for your dashboard. A trace breakdown, as shown in the below screenshot, enabled you to scrutinize the execution time of your dashboard execution.
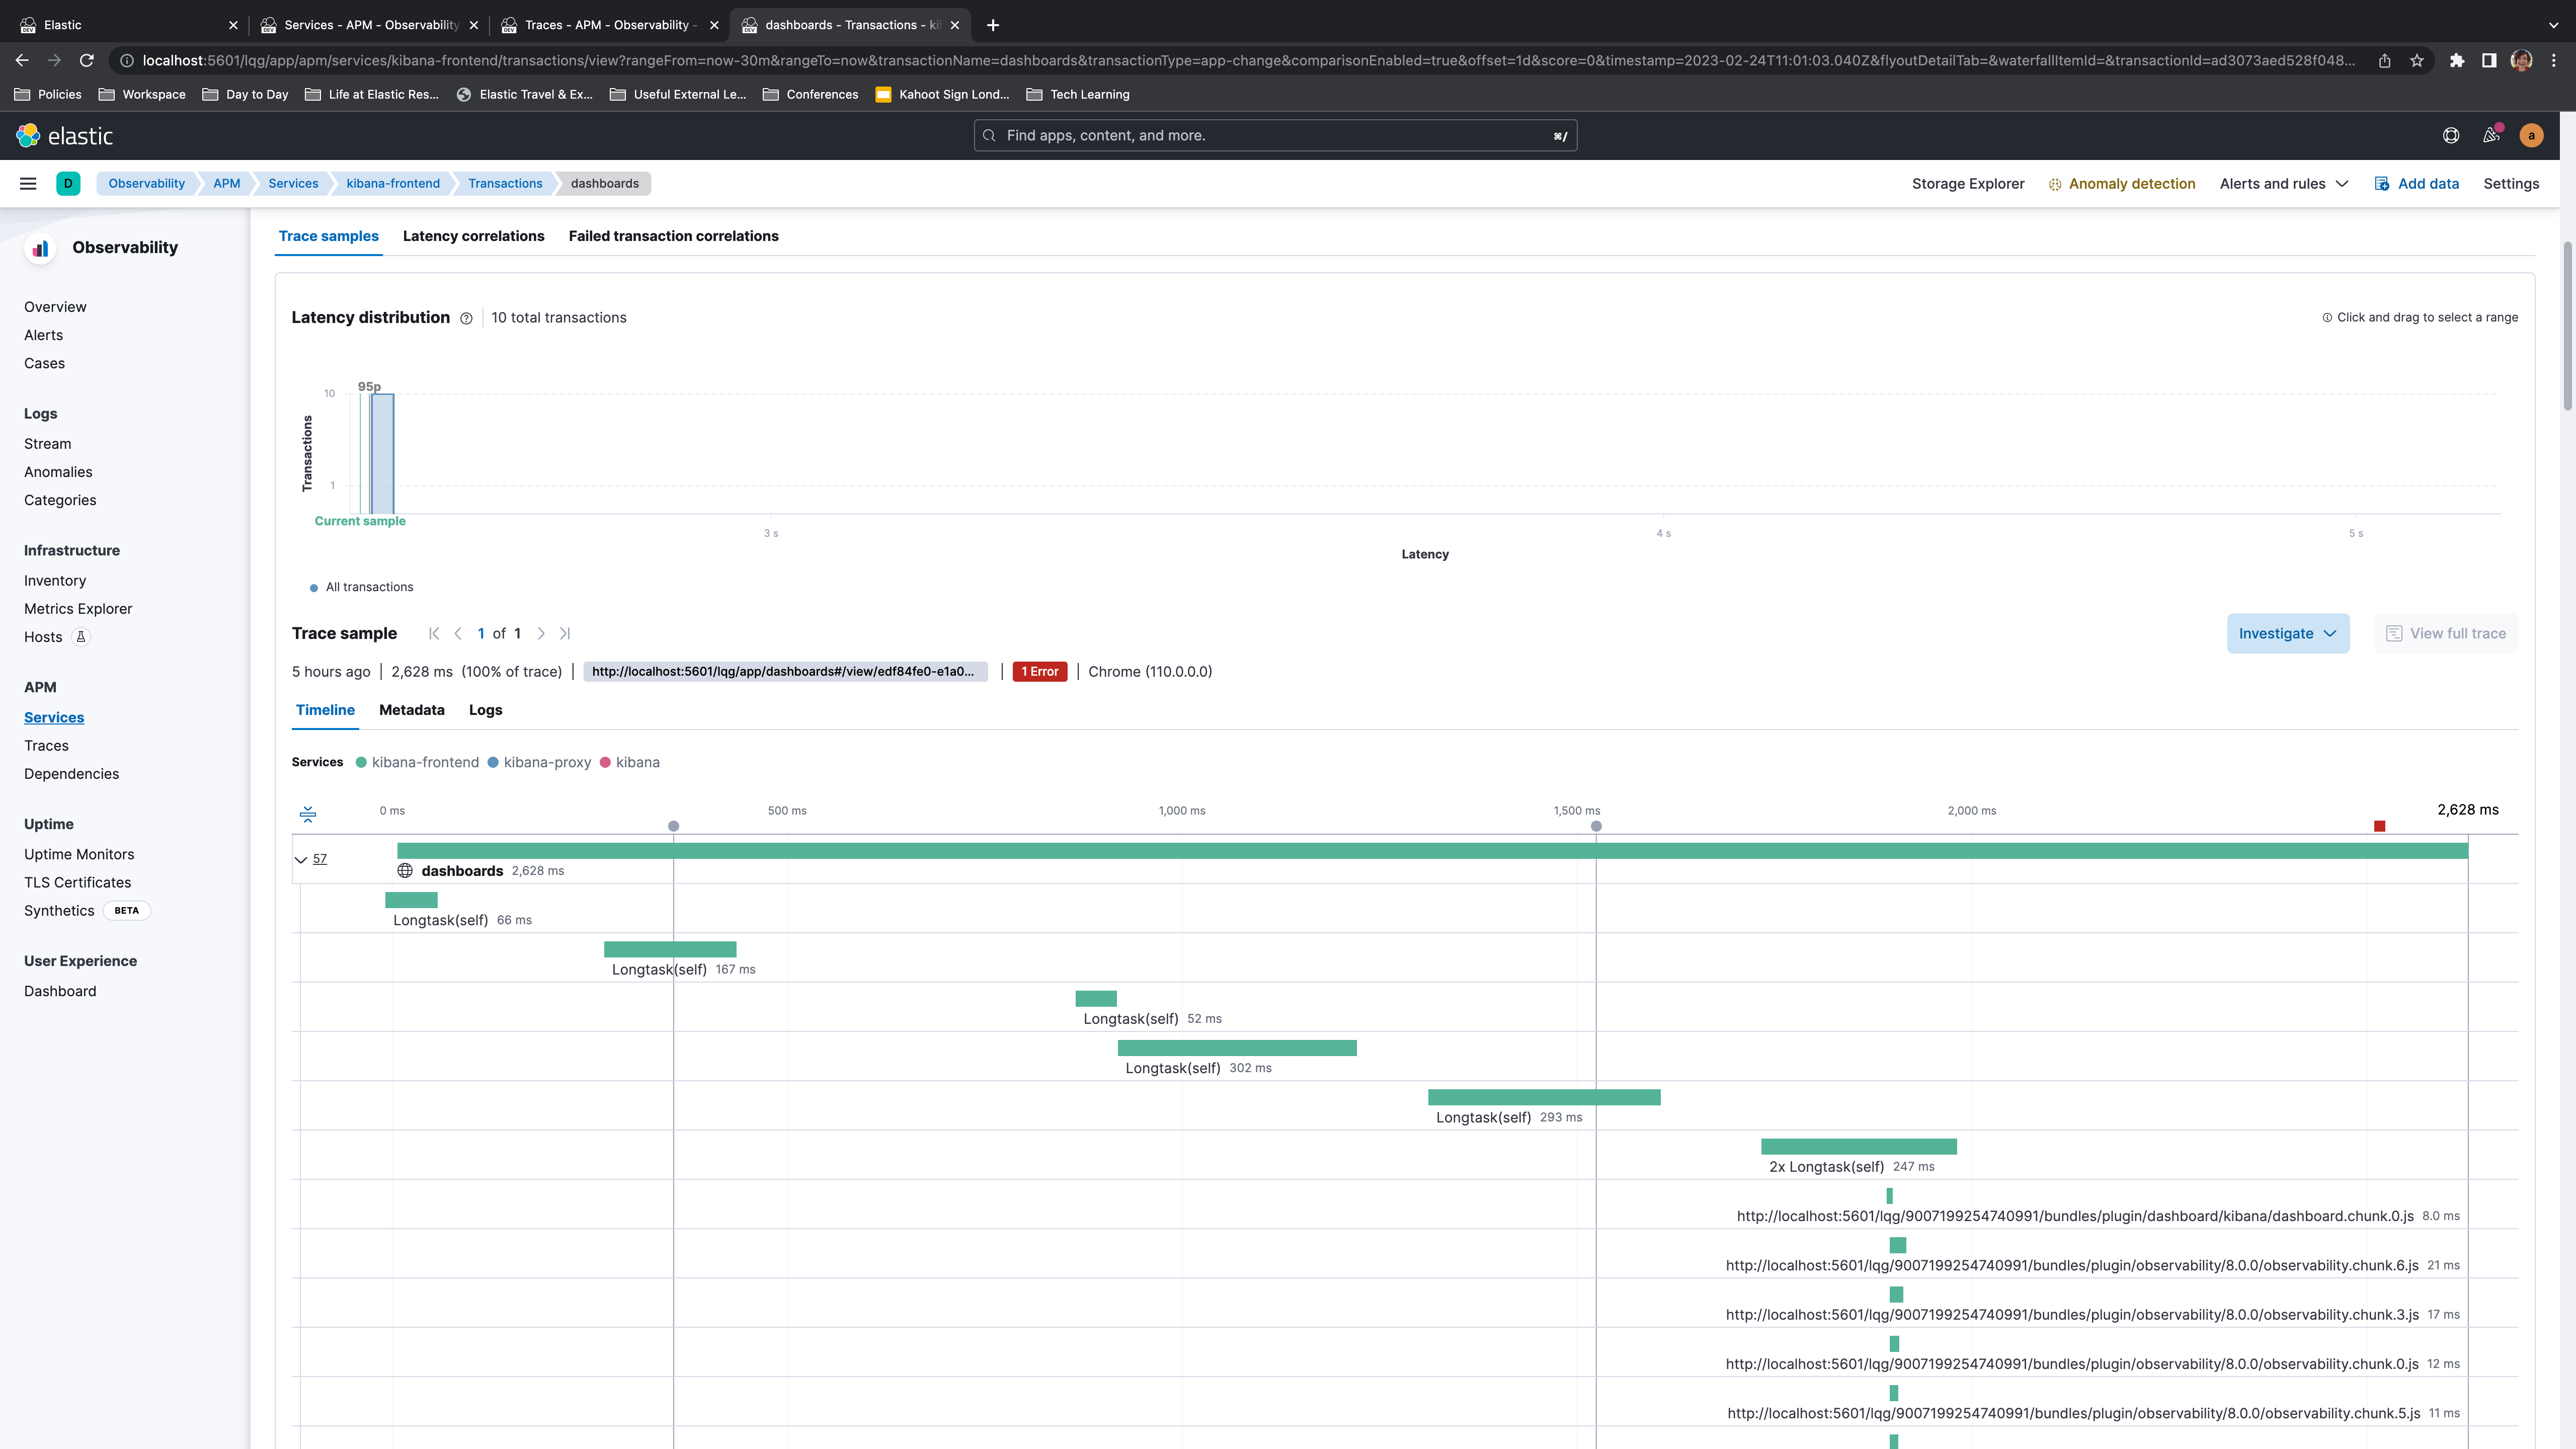
The breakdown will show the loading time and percentage proportion of the total execution time for JavaScript file loading, such as Kibana plugins, or response times for key Kibana API calls. This makes the APM information useful for identifying plugins slowing your dashboard down, particularly if you are making use of custom or community-developed plugins. It can also help find delays in key calls such as Kibana security. Or, via runtime fields on the APM indices, it can help answer usage questions such as which space is most used or which dashboard has the most page loads.
A key limitation of using APM against Kibana is that captured traces only cover key calls for a given logical unit at a page level. From the Metadata tab, the label information shows that these traces are captured at a dashboard level and doesn't give information for each individual visualization as shown in the metadata for the trace depicted below.
](https://images.contentstack.io/v3/assets/bltefdd0b53724fa2ce/blt3fe6cb16179461f7/642d2add214c3211e18de672/kibana-dashboards-trace-metadata.png)
Chrome Developer Tools
With a locally running version of Kibana, you can also step through the code using Chrome Developer Tools. This is more useful in tracing errors or unexpected behavior in Kibana. After following the same local setup steps as used with Elastic APM, you need to start Kibana using Node inspect support, as per the Kibana tutorial documentation:
node --inspect-brk scripts/kibana
Navigating to chrome://inspect within the Chrome browser will allow you connect the native Node.js debugging tools to your running Kibana process:
](https://images.contentstack.io/v3/assets/bltefdd0b53724fa2ce/bltb8d2b4de2c2e2ca8/642d2bc6c6373410f683f940/chome-inspect.png)
Inspecting the Kibana process opens the DevTools, giving access to all the best loved developer tools such as the debugger. Setting breakpoints within the bulk_resolve POST method found in the APM traces allows you to capture the dashboard object. This call can also be examined using the Chrome DevTools Network tab.
](https://images.contentstack.io/v3/assets/bltefdd0b53724fa2ce/bltbab62542ac664b9f/642d2c0b7ae71310d19e1ed9/kibana-node-debugging.png)
Although the VEGA_DEBUG.view global variable gives us the ability to inspect the state of any Vega charts via Chrome Developer tools as outlined in the documentation, we need to be able to see the detail of other visualizations, too. The above screenshot shows the details of each panel in the dashboard, including the unique ID and type of the control. This recursive call will also allow you to see the resulting object for individual panels, such as this map control where we see the JSON objects for distinct layers:
](https://images.contentstack.io/v3/assets/bltefdd0b53724fa2ce/blt543ee43321a3216f/642d2c588f121010dc4c955b/kibana-node-debug-map.png)
Identify slow queries via the Search Slow Log
Expensive queries from dashboards can have a negative impact on the Elasticsearch server. Elasticsearch provides the search slow log to capture slow search queries into a dedicated log file. Locating slow searches to the originating visualization could help identify which particular control in your dashboard is impacting Elasticsearch performance.
Queries logged to the slow log are determined per index by thresholds set for the query and fetch phases. Check out this useful blog and the search_type option in the Elasticsearch documentation for details on the default Query Then Fetch algorithm.
Thresholds are set for query and fetch phases at four different log levels: warn, info, debug and trace. Thresholds are disabled using a value of -1 and can be changed at an index level in the Developer Console using the _settings API endpoint:
PUT /kibana_sample_data_logs/_settings
{
  "index.search.slowlog.threshold.query.warn": "10s",
  "index.search.slowlog.threshold.query.info": "5s",
  "index.search.slowlog.threshold.query.debug": "2s",
  "index.search.slowlog.threshold.query.trace": "500ms",
  "index.search.slowlog.threshold.fetch.warn": "1s",
  "index.search.slowlog.threshold.fetch.info": "800ms",
  "index.search.slowlog.threshold.fetch.debug": "500ms",
  "index.search.slowlog.threshold.fetch.trace": "200ms"
}
Once the thresholds have been configured, the logs for the configured levels will be sent to the slow log location. The search log location depends on whether you are using an on-prem Elasticsearch installation or Elastic Cloud. For on-prem installs, the slow log is located in the logs folder, which defaults to /var/log/elasticsearch/ unless you have overridden the logs location within your elasticsearch.yml configuration. Elastic Cloud deployments require logs and metrics to be enabled on your cluster by following the Enable logging and monitoring steps within the documentation. Logs and metrics will be sent to the specified cluster.
](https://images.contentstack.io/v3/assets/bltefdd0b53724fa2ce/blt62d8c997f68e18f4/642d2cf737ecbf10cadce167/elastic-cloud-console-logs-and-metrics-select-deployment.png)
Irrespective of where your logs live, the slow log will show messages similar to the following:
](https://images.contentstack.io/v3/assets/bltefdd0b53724fa2ce/blte4220ef58cd65ae1/642d2d10884f2510c389391f/kibana-slowlog-highlight.png)
Looking at messages in Logs, it's difficult to tie this source message back to an individual dashboard control. Each numbered item corresponds to the following entity. Element 1 contains the unique ID for the Kibana dashboard. Of more interest is segment 2 containing colon-separated information about the specific visualization:
agg_based:gauge:69a34b00-9ee8-11e7-8711-e7a007dcef99
This example has three key pieces of information:
- Visualization type, in this case,
Lens - The type of control, which here is the
Legacy Metriccontrol - The unique ID of the visualization that has generated the slow query
As of Elastic Stack 8.x, these IDs are unique to the global space, unlike prior versions where they were unique within the Kibana space they reside. Further details are given in the documentation.
A more human-friendly format can be obtained by cross-referencing the visualization ID from elasticsearch.slowlog with kibana.log. The kibana.log message for the above gauge control shows the description highlighted in blue:
](https://images.contentstack.io/v3/assets/bltefdd0b53724fa2ce/bltb12b7091c70b9ce5/642d2d6ecfb44c109a1d760e/kibana-logs-highlight.png)
The description can be matched against the title in the dashboard itself if the title is visible, or in the Saved Objects screen:
](https://images.contentstack.io/v3/assets/bltefdd0b53724fa2ce/blt9c9eac6e2bb8e6dc/642d2da2c6373410f683f944/kibana-saved-objects-screen.png)
The Inspect panel within Saved Objects can also be used to cross-reference the ID:
](https://images.contentstack.io/v3/assets/bltefdd0b53724fa2ce/blt3859e664d1c4e2b4/642d2dcd7ae71310d19e1ee4/kibana-inspect-action.png)
Inspector and Search Profiler
Once the offending visualization has been identified, the Inspector will help you access the query. Within edit mode on a dashboard, the submenu for each control will have this option:
](https://images.contentstack.io/v3/assets/bltefdd0b53724fa2ce/blt92a4505ed4aa2958/642d2e24200d461080821aea/kibana-inspect-submenu.png)
Selecting the Request view initially shows key statistics for the underlying query, including the query time, the number of hits returned and the number of documents matching the query. Hits returned versus hits match is not the same, not just because by default Elasticsearch queries return 10 hits, but also because many aggregations will not return documents for inclusion in their views as we will be interested in visualizing the aggregation results.
](https://images.contentstack.io/v3/assets/bltefdd0b53724fa2ce/blta646c9f56fc22141/642d2e3eaa312f114ba7d3c9/kibana-inspect-panel.png)
The Request tab shows the query executed by this particular control. There are also options to copy the query to run in the Developer Console, or use the Search Profiler to identify slow stages of both the search and aggregation profiles of your query.
](https://images.contentstack.io/v3/assets/bltefdd0b53724fa2ce/blta4de9dc02d77d594/642d2e5c66181410a573290b/search-profiler.png)
The capabilities of each Inspect panel depend on the type of visualization used to give appropriate debugging options. The Inspect panel for maps allows you to see queries for each layer. Vega charts show the values of datasets and key signals for debugging. These are useful for a birds-eye glance at the values within the chart. For more advanced debugging of Vega charts using Google Chrome Developer Tools, inspect the view object as per this guide.
Summary
Elastic APM, the Kibana Inspector and Search Profiler, and the Elasticsearch Slow Log are powerful tools in diagnosing dashboard performance issues. After using these techniques and optimizing your queries, if you are still struggling with poor performance, try configuring Kibana to load dashboard panels as they become visible as presented in the Improve dashboard loading time documentation.
Happy debugging!
Resources
- Instrumenting Kibana with Elastic APM
- Profile queries and aggregations
- Vega Debugging
- Maps Troubleshooting
- Trace Elasticsearch query to the origin in Kibana
- Elasticsearch Slow Log
- Understanding "Query Then Fetch" vs "DFS Query Then Fetch"
- Elasticsearch
search_type - Kibana: Improve dashboard loading time
- 3 tips to identify Kibana optimizing potential
Share
- Share on Twitter
Share on Twitter
- Share on LinkedIn
Share on LinkedIn
- Share on Facebook
Share on Facebook
- Share by Email
Share by Email
- Print this page
Print