In search of a cluster health diagnosis: Introducing the Elasticsearch Health API


 Share on Twitter
Share on Twitter

 Share on LinkedIn
Share on LinkedIn

 Share on Facebook
Share on Facebook

 Share by Email
Share by Email

 Print this page
Print
Is my Elasticsearch cluster healthy? How do I repair it?
These are difficult questions to answer, but as part of Elasticsearch 8.7, we are releasing a new Health API to help identify and fix problems in Elasticsearch clusters.
In contrast to the existing cluster health API, which looks at the health of indices and data streams, the new Health API will also perform root cause analysis for the unhealthy indices and data streams and introduce a number of additional feature-specific health checks.
Health issue anatomy and resolution
Elasticsearch health issues are usually observed by checking the Elasticsearch shards status or more likely due to the higher-level functionalities being impacted (e.g., incomplete search results or slow ingestion).
Let's try to analyze an Elasticsearch health issue a bit further and introduce some terminology.
We will use the example of an unassigned shard to help us understand this better. An Elasticsearch health issue has a symptom, which is the observable lower-level Elasticsearch primitive that’s experiencing a problem — in our case, we can observe that one shard is unassigned. A symptom can have one or more impacts on the system. For example, an unassigned primary shard would be a symptom that causes the ingest and backup functionalities to be impacted.
Once a problem is observed, the next step is understanding what’s causing the issue and what actions are needed to remedy the problem. In our example, the cause of the shard unassignment could be that the allocation is disabled at the index level. The action we’d need to take to get the shard assigned is to change the index.routing.allocation.enable index setting to a value of all as described in this step-by-step troubleshooting guide.
Health API principles
We built an API that will signal how clusters are impacted by issues in a simple and actionable way. We wanted to ensure that our users can self-perform the necessary actions to fix issues their clusters encountered.
The Health API was designed with two operating modes in mind:
- A very fast high-level mode that indicates the overall status of the cluster using the already established red, yellow, or green status.
- A more detailed reporting mode that also performs a root cause analysis and reports it as part of a diagnosis together with the needed actions to get back to green health.
Switching between the two operating modes is done using the verbose query parameter. We default to detailed reporting (verbose=true); however, we recommend the usage of the high-level mode (verbose=false) for any automatic polling for health because performing the root cause analysis can be an expensive operation.
The high-level mode will report the impacts the detected problems have on the system. The impacts are described using terminology that’s closer to what our users would use when discussing the role Elasticsearch plays in their architecture (e.g., search, ingest, or backup).
We make use of modular health indicators to track a few metrics that usually cause health problems in Elasticsearch. The available health indicators are documented here. The infrastructure we designed for the Health API makes it easy to add more indicators (for the intrepid engineer, implementing HealthIndicatorService and HealthPlugin will do the trick) and we’ll consider the feasibility of indicating health via the Health API with every new feature we design.
Each health indicator will report its own status of red, yellow, or green, as well as an explanation when the status is not green.
When we cannot determine the health status of the cluster with a high degree of certainty, we’ll signal this using the unknown status. The health indicators will individually return a status of unknown if they cannot reliably track their designated metric. For example, if a cluster doesn’t have a stable master node elected, all indicators except the master_is_stable indicator will return unknown as the cluster state information the indicators rely upon to evaluate the health condition is probably not up-to-date enough.
When an indicator reports the red status, the cluster is in a state that requires immediate intervention. It means functions like cluster stability, ingest, search, or backup are severely affected right now (e.g., an unassigned primary shard impacts ingest and search).
A status indicator of yellow signals a warning. The cluster functions could eventually be impacted if no action is taken (e.g., an SLM policy that hasn’t been successful for the last five consecutive executions impacts the backups and puts the deployment at risk of not having an up-to-date enough snapshot available).
The API will report an overall status for the cluster that’ll represent the worst encountered status among the health indicators (i.e., if any indicator reports yellow, the overall status will be yellow).
Show me
Let’s have a look at the API and what it returns in various scenarios.
GREEN Health
Invoking the API on a healthy cluster looks like this:
> GET _health_report

{
    "status": "green",
    "cluster_name": "d529cccc37ec4091950d92768225be17",
    "indicators": {
   	 "master_is_stable": {
   		 "status": "green",
   		 "symptom": "The cluster has a stable master node",
   		 "details": {
   			 "current_master": {
   				 "node_id": "inOUckScRGqxuiw8i7E41w",
   				 "name": "instance-0000000001"
   			 },
   			 "recent_masters": [{
   				 "node_id": "inOUckScRGqxuiw8i7E41w",
   				 "name": "instance-0000000001"
   			 }]
   		 }
   	 },
   	 "repository_integrity": {
   		 "status": "green",
   		 "symptom": "No corrupted snapshot repositories.",
   		 "details": {
   			 "total_repositories": 1
   		 }
   	 },
   	 "shards_availability": {
   		 "status": "green",
   		 "symptom": "This cluster has all shards available.",
   		 "details": {
   			 "creating_primaries": 0,
   			 "unassigned_replicas": 0,
   			 "restarting_primaries": 0,
   			 "restarting_replicas": 0,
   			 "initializing_primaries": 0,
   			 "started_replicas": 89,
   			 "initializing_replicas": 0,
   			 "unassigned_primaries": 0,
   			 "started_primaries": 89
   		 }
   	 },
   	 "disk": {
   		 "status": "green",
   		 "symptom": "The cluster has enough available disk space.",
   		 "details": {
   			 "indices_with_readonly_block": 0,
   			 "nodes_with_enough_disk_space": 3,
   			 "nodes_with_unknown_disk_status": 0,
   			 "nodes_over_high_watermark": 0,
   			 "nodes_over_flood_stage_watermark": 0
   		 }
   	 },
   	 "ilm": {
   		 "status": "green",
   		 "symptom": "Index Lifecycle Management is running",
   		 "details": {
   			 "policies": 40,
   			 "ilm_status": "RUNNING"
   		 }
   	 },
   	 "slm": {
   		 "status": "green",
   		 "symptom": "Snapshot Lifecycle Management is running",
   		 "details": {
   			 "slm_status": "RUNNING",
   			 "policies": 1
   		 }
   	 }
    }
}We can spot in the response a few familiar concepts we touched upon already. We have a top-level status field that’s indicating green. The indicators object contains the individual health indicators that are tracking different Elasticsearch metrics.
We mentioned the master_is_stable indicator already — it’s the indicator that evaluates if the cluster has an elected master node and if the node has been able to continuously remain the master (i.e., the cluster has a stable master). The repository_integrity indicator is monitoring the snapshot repositories and reports if any becomes corrupted (usually due to multiple clusters writing to the same snapshot repository). The shards_availability indicator is reporting on any unassigned primary and replica shards. The disk indicator reports any health issues caused by a lack of disk space (e.g., indices that have been marked as read-only). The ilm indicator will check if Index Lifecycle Management is running, and finally the slm indicator will report if Snapshot Lifecycle Management is running and if the configured policies have had consecutive successful executions.
Looking at the indicators, we can see they all report a symptom that briefly describes the performed analysis and a status.
We called the API without any query parameters, so the API ran in the detailed reporting mode. We can see that each indicator has a details field that wouldn’t have been computed and returned if the verbose parameter was configured to false.
Let’s see the response if verbose=false:
> GET _health_report?verbose=false

{
    "status": "green",
    "cluster_name": "d529cccc37ec4091950d92768225be17",
    "indicators": {
   	 "master_is_stable": {
   		 "status": "green",
   		 "symptom": "The cluster has a stable master node"
   	 },
   	 "repository_integrity": {
   		 "status": "green",
   		 "symptom": "No corrupted snapshot repositories."
   	 },
   	 "shards_availability": {
   		 "status": "green",
   		 "symptom": "This cluster has all shards available."
   	 },
   	 "disk": {
   		 "status": "green",
   		 "symptom": "The cluster has enough available disk space."
   	 },
   	 "ilm": {
   		 "status": "green",
   		 "symptom": "Index Lifecycle Management is running"
   	 },
   	 "slm": {
   		 "status": "green",
   		 "symptom": "Snapshot Lifecycle Management is running"
   	 }
    }
}YELLOW Health
The yellow status will indicate a system problem that, if left unattended for long enough, could lead to a serious system health problem. Let’s look at an example where the Health API indicates a problem:
> GET _health_report
{
    "status": "yellow",
    "cluster_name": "d529cccc37ec4091950d92768225be17",
    "indicators": {
   	 "master_is_stable": {
   		 "status": "green",
   		 "symptom": "The cluster has a stable master node",
   		 "details": {
   			 "current_master": {
   				 "node_id": "inOUckScRGqxuiw8i7E41w",
   				 "name": "instance-0000000001"
   			 },
   			 "recent_masters": [{
   				 "node_id": "inOUckScRGqxuiw8i7E41w",
   				 "name": "instance-0000000001"
   			 }]
   		 }
   	 },
   	 "repository_integrity": {
   		 "status": "green",
   		 "symptom": "No corrupted snapshot repositories.",
   		 "details": {
   			 "total_repositories": 1
   		 }
   	 },
   	 "shards_availability": {
   		 "status": "green",
   		 "symptom": "This cluster has all shards available.",
   		 "details": {
   			 "creating_primaries": 0,
   			 "unassigned_replicas": 0,
   			 "restarting_primaries": 0,
   			 "restarting_replicas": 0,
   			 "initializing_primaries": 0,
   			 "started_replicas": 89,
   			 "initializing_replicas": 0,
   			 "unassigned_primaries": 0,
   			 "started_primaries": 89
   		 }
   	 },
   	 "disk": {
   		 "status": "green",
   		 "symptom": "The cluster has enough available disk space.",
   		 "details": {
   			 "indices_with_readonly_block": 0,
   			 "nodes_with_enough_disk_space": 3,
   			 "nodes_with_unknown_disk_status": 0,
   			 "nodes_over_high_watermark": 0,
   			 "nodes_over_flood_stage_watermark": 0
   		 }
   	 },
   	 "ilm": {
   		 "status": "green",
   		 "symptom": "Index Lifecycle Management is running",
   		 "details": {
   			 "policies": 40,
   			 "ilm_status": "RUNNING"
   		 }
   	 },
   	 "slm": {
   		 "status": "yellow",
   		 "symptom": "Encountered [1] unhealthy snapshot lifecycle management policies.",
   		 "details": {
   			 "slm_status": "RUNNING",
   			 "policies": 1,
   			 "unhealthy_policies": {
   				 "invocations_since_last_success": {
   					 "<cloud-snapshot-{now/d}>": 8
   				 },
   				 "count": 1
   			 }
   		 },
   		 "impacts": [{
   			 "id": "elasticsearch:health:slm:impact:stale_snapshots",
   			 "severity": 2,
   			 "description": "Some automated snapshots have not had a successful execution recently. Indices restored from affected snapshots may not contain recent changes.",
   			 "impact_areas": [
   				 "backup"
   			 ]
   		 }],
   		 "diagnosis": [{
   			 "id": "elasticsearch:health:slm:diagnosis:check_recent_snapshot_failures",
   			 "cause": "An automated snapshot policy is unhealthy:\n- [<cloud-snapshot-{now/d}>] had [8] repeated failures without successful execution since [2022-12-23T15:29:59.803Z]",
   			 "action": "Check the snapshot lifecycle policy for detailed failure info:\n- /_slm/policy/cloud-snapshot-policy?human",
   			 "help_url": "https://ela.st/fix-recent-snapshot-failures",
   			 "affected_resources": {
   				 "slm_policies": [
   					 "<cloud-snapshot-{now/d}>"
   				 ]
   			 }
   		 }]
   	 }
    }
}Note that the slm indicator is reporting the yellow status (which is also reflected in the top level status field). Since we are reporting a health problem (a non-green status), the API will return a diagnosis.
The cause field will describe the underlying cause of the problem. In this case, an automated Snapshot Lifecycle Policy could not successfully create a snapshot for eight consecutive executions. The action field is a quick summary of the needed steps to get to green health or a pointer toward getting more information about the condition that’s causing the problem.
Under help_url you’ll get a detailed troubleshooting guide. This is the place to explore when a problem is reported. It’s a guide targeted at the specific problem the API diagnosed and contains detailed steps to fix the problem, get more relevant information about the deployment state, or a call to reach out to our support team.
And finally, a diagnosis will optionally report a list of affected_resources. These are the immediate Elasticsearch internal abstractions that are affected by the health condition. We can report indices, nodes, Snapshot Lifecycle policies, Index Lifecycle policies, feature states, or snapshot repositories.
RED Health
A red health status indicates a severe problem that needs immediate remedy, as it’s acutely affecting one or more Elasticsearch functionalities.
Let’s look at an example:
> GET _health_report
{
  "status": "red",
  "cluster_name": "d529cccc37ec4091950d92768225be17",
  "indicators": {
	"master_is_stable": {
  	  "status": "green",
  	  "symptom": "The cluster has a stable master node",
  	  "details": {
    	    "current_master": {
      	"node_id": "inOUckScRGqxuiw8i7E41w",
      	"name": "instance-0000000001"
    	    },
    	  "recent_masters": [
      	{
        	  "node_id": "inOUckScRGqxuiw8i7E41w",
        	  "name": "instance-0000000001"
      	}
    	   ]
  	  }
	},
	"repository_integrity": {
  	  "status": "green",
  	  "symptom": "No corrupted snapshot repositories.",
  	  "details": {
    	    "total_repositories": 1
  	  }
	},
	"shards_availability": {
  	  "status": "red",
  	  "symptom": "This cluster has 1 unavailable primary shard, 1 unavailable replica shard.",
  	  "details": {
    	    "creating_primaries": 0,
    	    "unassigned_replicas": 1,
    	    "restarting_primaries": 0,
          "restarting_replicas": 0,
    	    "initializing_primaries": 0,
    	    "started_replicas": 89,
    	    "initializing_replicas": 0,
    	    "unassigned_primaries": 1,
    	    "started_primaries": 89
  	},
  	"impacts": [
    	{
      	"id": "elasticsearch:health:shards_availability:impact:primary_unassigned",
      	"severity": 1,
      	"description": "Cannot add data to 1 index [my-index-000001]. Searches might return incomplete results.",
      	"impact_areas": [
            	"ingest",
            	"search"
      	]
    	}],
  	"diagnosis": [
    	    {
      	"id": "elasticsearch:health:shards_availability:diagnosis:enable_index_allocations",
      	"cause": "Elasticsearch isn't allowed to allocate some shards from these indices because allocation for those shards has been disabled at the index level.",
      	"action": "Check that the [index.routing.allocation.enable] index settings are set to [all].",
      	"help_url": "http://ela.st/fix-index-allocation",
      	"affected_resources": {
          	  "indices": [
          	    "my-index-000001"
        	  ]
      	}
    	    }]
	},
	"disk": {
  	  "status": "green",
  	  "symptom": "The cluster has enough available disk space.",
  	  "details": {
    	    "indices_with_readonly_block": 0,
    	    "nodes_with_enough_disk_space": 3,
    	    "nodes_with_unknown_disk_status": 0,
    	    "nodes_over_high_watermark": 0,
    	    "nodes_over_flood_stage_watermark": 0
  	  }
	},
	"ilm": {
  	  "status": "green",
  	  "symptom": "Index Lifecycle Management is running",
  	  "details": {
    	     "policies": 40,
    	     "ilm_status": "RUNNING"
  	  }
	},
	"slm": {
  	  "status": "green",
  	  "symptom": "Snapshot Lifecycle Management is running",
  	  "details": {
    	    "slm_status": "RUNNING",
    	    "policies": 1
  	  }
	}
  }
}In this case, the Health API is reporting a top-level red status because the shards_availability indicator is reporting a red status. The symptom summarizes the cause of the red status, namely the cluster has one unassigned primary shard (the cluster also has an unassigned replica shard; however, the status is red due to the primary shard being unassigned).
As ingest and search are actively impacted, this health condition requires immediate action to restore these functionalities. Let’s check the diagnosis to see if it can help us fix this problem and get the primary shard assigned.
The cause already provides some useful information. The allocation for the index has been disabled. The suggested action is to check the value of the index.routing.allocation.enable setting and configure its value to all. The recommended troubleshooting guide returned under the help_url key will provide a step-by-step guide to check and configure the value of the index.routing.allocation.enable index setting.
We can see that the Health API provided a detailed explanation of the diagnosed condition and a step-by-step guide to heal the system. The diagnosis and details were computed and returned because the verbose parameter defaults to true (we simply executed GET _health_report). Again, we do not recommend using the verbose version of the API in any potential automation or polling of the API because the diagnosis can be expensive to compute.
Let’s see what the output of the API is without the verbosity enabled:
> GET _health_report?verbose=false
{
  "status": "red",
  "cluster_name": "d529cccc37ec4091950d92768225be17",
  "indicators": {
	"master_is_stable": {
  	  "status": "green",
  	  "symptom": "The cluster has a stable master node"
	},
	"repository_integrity": {
  	  "status": "green",
  	  "symptom": "No corrupted snapshot repositories."
	},
	"shards_availability": {
  	  "status": "red",
  	  "symptom": "This cluster has 1 unavailable primary shard, 1 unavailable replica shard.",
  	  "impacts": [
    	  {
      	"id": "elasticsearch:health:shards_availability:impact:primary_unassigned",
      	"severity": 1,
      	"description": "Cannot add data to 1 index [my-index-000001]. Searches might return incomplete results.",
      	"impact_areas": [
        	  "ingest",
        	  "search"
      	]
    	  }]
	},
	"disk": {
  	  "status": "green",
  	  "symptom": "The cluster has enough available disk space."
	},
	"ilm": {
  	  "status": "green",
  	  "symptom": "Index Lifecycle Management is running"
	},
	"slm": {
  	  "status": "green",
  	  "symptom": "Snapshot Lifecycle Management is running"
	}
  }
}Even this laconic version of the API offers great insights into the condition a system is experiencing. The status, symptom, and impacts offer a good overview of the health problem and the immediate affected areas/functionalities.
Application
We at Elastic are already using the Health API in Elastic Cloud. You might’ve already seen the Health page, which is backed by the Health API. The Health page first displays an overview of the health of the deployment and is powered by the non-verbose version of the health API:
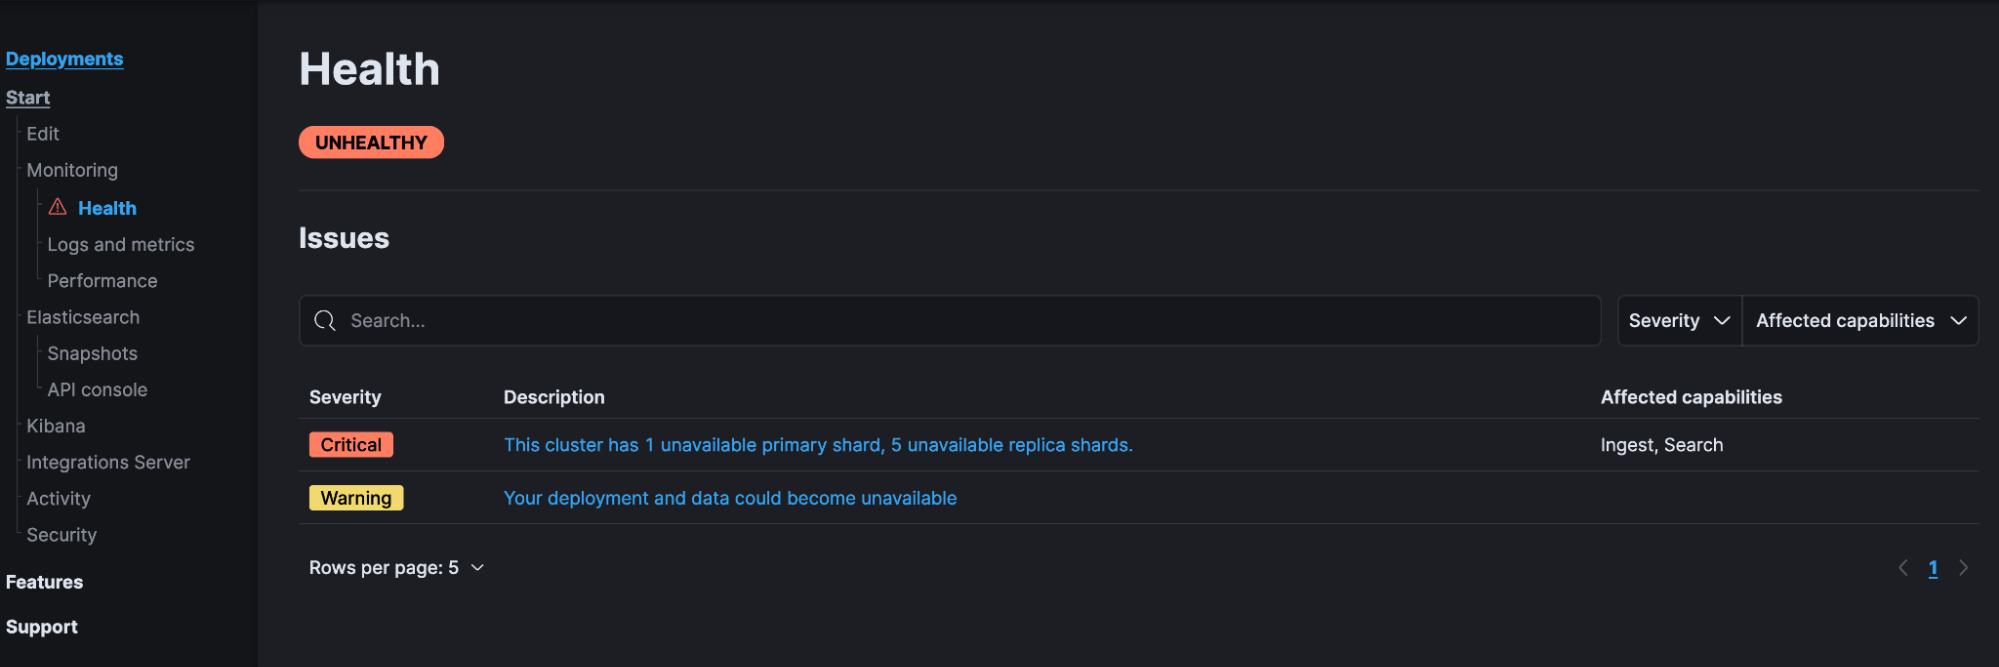
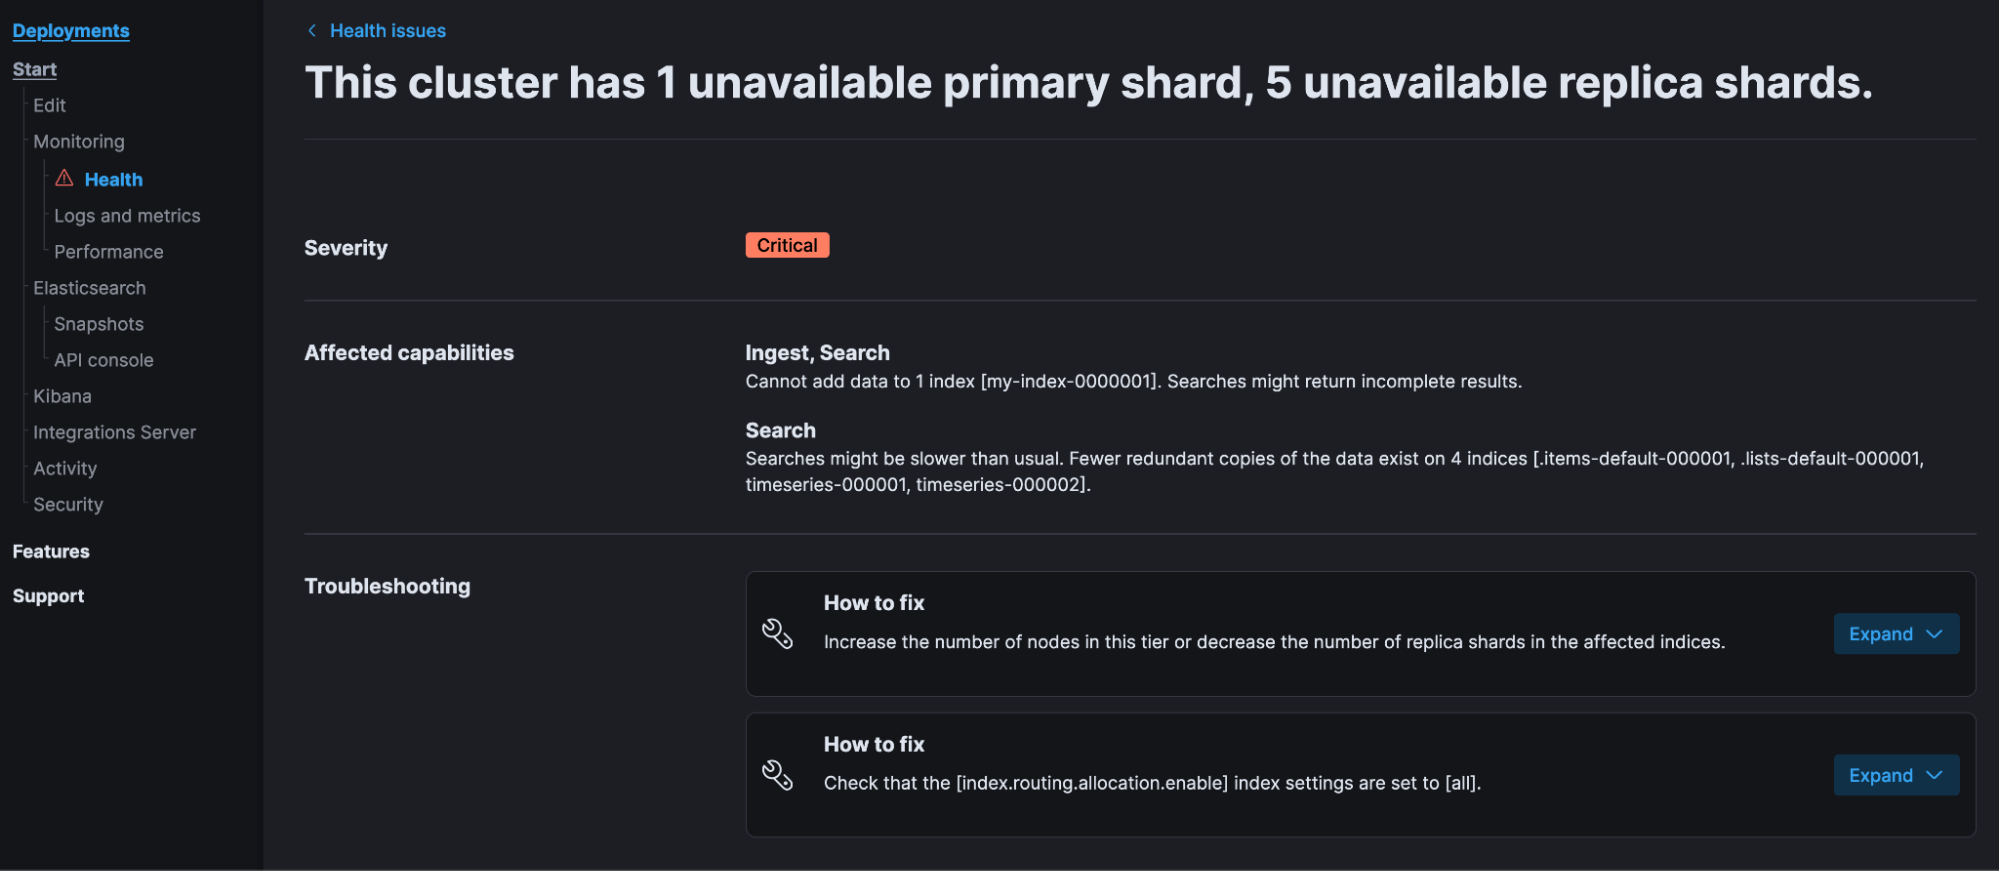
Clicking on the critical issue description text will call the verbose version of the Health API (i.e., GET _health_report?verbose=true) to perform the root cause analysis and retrieve the steps to get to green health (the prescription):
Every diagnosis and impact has an identifier that’s returned under the id field. These identifiers could be used to record the encountered health conditions in a deployment or derive intelligence around the most affected area.
Furthermore, the diagnosis id could be used to drive a “Fix me” functionality where the necessary steps that are described in the returned troubleshooting guide (diagnosis.help_url) are automatically executed for each affected resource (diagnosis.affected_resource).
The next time you encounter an issue with your Elasticsearch cluster, check out the Health API to see the impact, diagnosis, and remediation steps for the issue.
Here's to the health of your deployment!
Share
- Share on Twitter
Share on Twitter
- Share on LinkedIn
Share on LinkedIn
- Share on Facebook
Share on Facebook
- Share by Email
Share by Email
- Print this page
Print