How to benchmark Elasticsearch performance with ingest pipelines and your own logs


 Share on Twitter
Share on Twitter

 Share on LinkedIn
Share on LinkedIn

 Share on Facebook
Share on Facebook

 Share by Email
Share by Email

 Print this page
Print
When setting up an Elasticsearch cluster, one of the most common use cases is to ingest and search through logs. This blog post focuses on getting a benchmark that will tell you how well your cluster will handle your workload. It allows you to create a reproducible environment for testing things out. Do you want to change the mapping of something, drop some fields, alter the ingest pipeline? Or are you just curious about pushing the limits on your dataset to identify how many documents you can handle per second? What is disk usage? Further down, think about running alerts on it and figuring out how that impacts your overall cluster.
Check out the other two parts in this series:
Every workload looks different, and a lot of log messages are quite different. Somebody collecting firewall logs might have a nice ratio between allow and deny rules and nearly no VPN connection logs. Someone else might have a lot of VPN connection logs. In the grand scheme of things, one can simplify and generalize and say that every log source is different.
Elastic does not recommend running Rally against a cluster that is in production. Rally tracks feature destructive actions and can lead to data loss. Additionally, benchmarking a cluster receiving load from somewhere else is not useful since Rally metrics cannot be adequately interpreted.
Using the custom log track
Today we are focusing on the custom log track, and that’s nice if you do not want to use any of the prebaked solutions we offer like the security or logs track.
We will need to perform the following tasks, and we’ll walk you through them:
- Reindex a subset of the data with the required fields
- Pull out data from an index/data stream
- Put that onto the disk
- Pull out metadata information as needed (ingest pipelines, etc.)
What is mandatory for a custom log track? When an ingest pipeline is involved that modifies data, we need to ensure that we have an original field that contains all the data before we do the extraction. The most commonly used is the event.original field.
Let’s get started. In this case, we will be using the Kibana Web Log sample data. This blog can only be followed by leveraging a Rally version of at least 2.12 (before that, we had a different folder and file structure).
Set up the data
In our case, the data looks like this:
"_source": {
    "agent": "Mozilla/5.0 (X11; Linux x86_64; rv:6.0a1) Gecko/20110421 Firefox/6.0a1",
    "bytes": 5166,
    "clientip": "33.16.170.252",
    "extension": "zip",
    "geo": {
      "srcdest": "US:PH",
      "src": "US",
      "dest": "PH",
      "coordinates": {
        "lat": 33.6324825,
        "lon": -83.84955806
      }
    },
    "host": "artifacts.elastic.co",
    "index": "kibana_sample_data_logs",
    "ip": "33.16.170.252",
    "machine": {
      "ram": 2147483648,
      "os": "win xp"
    },
    "memory": null,
    "message": "33.16.170.252 - - [2018-08-03T09:27:38.140Z] \"GET /kibana/kibana-6.3.2-windows-x86_64.zip HTTP/1.1\" 200 5166 \"-\" \"Mozilla/5.0 (X11; Linux x86_64; rv:6.0a1) Gecko/20110421 Firefox/6.0a1\"",
    "phpmemory": null,
    "referer": "http://nytimes.com/success/sunita-suni-williams",
    "request": "/kibana/kibana-6.3.2-windows-x86_64.zip",
    "response": 200,
    "tags": [
      "success",
      "security"
    ],
    "@timestamp": "2024-12-27T09:27:38.140Z",
    "url": "https://artifacts.elastic.co/downloads/kibana/kibana-6.3.2-windows-x86_64.zip",
    "utc_time": "2024-12-27T09:27:38.140Z",
    "event": {
      "dataset": "sample_web_logs"
    },
    "bytes_gauge": 5166,
    "bytes_counter": 17071806
}This means that we want to keep just the message field in the Rally track. We will create an ingest pipeline with a remove processor that does a keep operation. We just drop the _id that is set, because we want to duplicate the data. We only have ~14,000 documents in the original dataset, and we want to benchmark the impact of the ingest pipeline and various processors. We can do that only if we have enough data. Duplicating the data though means that we cannot conclude the disk usage, since the compression can be quite high due to the similarity of the messages.
PUT _ingest/pipeline/rally-drop-fields
{
  "processors": [
    {
        "remove": {
          "field": "_id"
        }
    },
    {
      "remove": {
        "keep": [
          "message", "@timestamp"
        ]
      }
    }
  ]
}This will keep just the message and timestamp fields, since these are the ones that contain the most information.
The next step is to create an index template that defines the custom-track as a data stream. This will ensure that we have a template and the correct mapping is applied as well. We will leverage the built-in ecs@mappings template that makes sure to map all ECS fields. If you are using anything that is not ECS, I would recommend you specifically map out the fields and how you want them mapped. Rally will copy all of that and make it part of the track.
PUT _index_template/custom-track
{
  "data_stream": {
    "allow_custom_routing": false,
    "hidden": false
  },
  "index_patterns": [
    "custom-track"
  ],
  "composed_of": [
    "ecs@mappings"
  ]
}The next step is to reindex the data and we will execute this command a couple of times.
POST _reindex
{
    "source": {
        "index": "kibana_sample_data_logs*"
    },
    "dest": {
        "index": "custom-track",
        "pipeline": "rally-drop-fields",
        "op_type": "create"
    }
}Now we can do a simple:
GET custom-track/_countAnd we will get an answer that tells us how many documents there are in this index, as well as how many shards there are. We have roughly 13 million documents in there.
{
  "count": 13004376,
  "_shards": {
    "total": 1,
    "successful": 1,
    "skipped": 0,
    "failed": 0
  }
}That should be enough for a proper test around the impact of the ingest pipeline. There are still a couple of things that we need to watch out for. We multiplied original documents a couple of times, which means that when we look into the shard size and disk usage we will get a better compression than with more diverse data. Therefore the shard size and disk usage might not be representative of your real data.
Rally
Now we go to our Rally host where Rally is installed and running. If you need help with that, check out the first blog. On the Rally host, we can run the create-track, which will do everything we need in one single call. Read more in Define Custom Workloads: Tracks - Rally documentation.
esrally create-track --data-streams "custom-track" --track "webserver" --target-hosts=https://es:port --client-options="verify_certs:false,basic_auth_user:'username',basic_auth_password:'password'"We create a track called a webserver and we load the data from the custom-track data stream. This creates a track with a single challenge and the following console output.
    ____        ____
   / __ \____ _/ / /_  __
  / /_/ / __ `/ / / / / /
 / _, _/ /_/ / / / /_/ /
/_/ |_|\__,_/_/_/\__, /
                /____/

[INFO] Connected to Elasticsearch cluster version [8.17.0] flavor [default]

Extracting documents for index [.ds-custom-track-2024....     1000/1000 docs [100.0% done]
Extracting documents for index [.ds-custom-tra...     13004376/13004376 docs [100.0% done]
[INFO] Track webserver has been created. Run it with: esrally --track-path=/home/philippkahr/tracks/webserver

----------------------------------
[INFO] SUCCESS (took 1146 seconds)
----------------------------------Now we have a track! That’s amazing! Per default, Rally will create the folder in the home directory of the user currently executing called tracks with a subfolder called webserver because that is what we named it.
There is a default.json file within the challenges folder. There are two folders: operations and challenges. For this blog post, we ignore the operations folder. This file contains the challenge description, which by default looks like this (bit below). If you want to know more about the different actions here, you can check out the first blog that explains this in detail.
We need to adjust a couple of things in the track.json. In the indices object, we want to rename the name to custom-track-rally as well as in the target-index in the corpora object, also set it to custom-track-rally. We are using a normal index now and not any data stream; otherwise, we need to use the data stream configuration.
This is the track.json.
{% import "rally.helpers" as rally with context %}
{
  "version": 2,
  "description": "Tracker-generated track for webserver",
  "indices": [
    {
      "name": "custom-track-rally",
      "body": ".ds-custom-track-2024.12.23-000001.json"
    }
  ],
  "corpora": [
    {
      "name": "custom-track-rally",
      "documents": [
        {
          "target-index": "custom-track-rally",
          "source-file": ".ds-custom-track-2024.12.23-000001-documents.json.bz2",
          "document-count": 13004376,
          "compressed-bytes": 213486562,
          "uncompressed-bytes": 3204126156
        }
      ]
    }
  ],

  "operations": [
    {{ rally.collect(parts="operations/*.json") }}
  ],
  "challenges": [
    {{ rally.collect(parts="challenges/*.json") }}
  ]

}This is the default.json and there are no changes needed.
{
    "name": "my-challenge",
    "description": "My new challenge",
    "default": true,
    "schedule": [
    {
      "operation": "delete-index"
    },
    {
      "operation": {
        "operation-type": "create-index",
        "settings": {{index_settings | default({}) | tojson}}
      }
    },
    {
      "operation": {
        "operation-type": "cluster-health",
        "index": "custom-track-rally",
        "request-params": {
          "wait_for_status": "{{cluster_health | default('green')}}",
          "wait_for_no_relocating_shards": "true"
        },
        "retry-until-success": true
      }
    },
    {
      "operation": {
        "operation-type": "bulk",
        "bulk-size": {{bulk_size | default(5000)}},
        "ingest-percentage": {{ingest_percentage | default(100)}}
      },
      "clients": {{bulk_indexing_clients | default(8)}}
    }
  ]
}As we can see, the first step is to delete the index, and it will always be the first step. Now we want to create two challenges. The first one is to just index the documents as fast as we can, and the second one is where we write the ingest pipeline.
How can you run this track now? For the out-of-the-box tracks provided by Elastic, it is enough to just say --track and it goes off because it knows where to find all of the data. This is not true for a custom track — for that one, we can simply specify the --track-path parameter. The full command looks like this. At this point, we should execute it just to make sure that this track works and it indexes the data. The --challenge parameter is only needed when you need to specify any other challenge. We will create the challenge with the ingest pipeline further down. For now we can remove that parameter, as we saw in the default.json there is a flag called default: true.
esrally race --user-tags='{"benchmark_id":"custom-1"}' --track-path=~/tracks/webserver --kill-running-processes --target-hosts=https://10.164.15.204:9200 --pipeline=benchmark-only --client-options="verify_certs:false,basic_auth_user:'username',basic_auth_password:'password'" --track-params='{"bulk_indexing_clients":20,"number_of_shards":1,"number_of_replicas":1}'Now that we have confirmation that the track worked, we can just copy and paste the entire default.json file and rename it to index-pipeline.json. The default challenge created is called my-challenge and has a flag called default: true. We need to adjust that now to false and set the name: ingest-pipeline. The name is important, as this is the value for the --challenge parameter.
{
    "name": "ingest-pipeline",
    "description": "My ingest pipeline challenge",
    "default": false,
    "schedule": [
    {
      "operation": "delete-index"
},....Now the schedule array contains the same steps: deleting index, creating index, bulk request. We need one additional step, and that is to add the ingest pipeline.
   {
      "name": "index-pipeline",
      "schedule": [
        {
          "operation": "delete-index"
        },
        {
          "operation": {
            "operation-type": "create-index",
            "settings": {{index_settings | default({}) | tojson}}
          }
        },
        {
          "operation": {
            "operation-type": "put-pipeline",
            "id": "custom-track-pipeline",
            "body": {
              "processors": [
                {
                  "dissect": {
                    "field": "message",
                    "pattern": "%{source.ip} %{} [%{@timestamp}] \"%{http.request.method} %{url.path} %{http.version}\" %{http.request.status_code} %{http.request.bytes} \"-\" \"%{user_agent}"
                  }
                },
                {
                  "user_agent": {
                      "field": "user_agent"
                  }
                },
                {
                  "geoip": {
                      "field": "source.ip",
                      "target_field": "source.geo"
                  }
                }
              ]
            }
          }
        },
{
      "operation": {
        "operation-type": "cluster-health",
        "index": "custom-track-rally",
        "request-params": {
          "wait_for_status": "{{cluster_health | default('green')}}",
          "wait_for_no_relocating_shards": "true"
        },
        "retry-until-success": true
      }
    },
        {
          "operation": {
            "operation-type": "bulk",
            "pipeline": "custom-track-pipeline",
            "bulk-size": {{bulk_size | default(5000)}},
            "ingest-percentage": {{ingest_percentage | default(100)}}
          },
          "clients": {{bulk_indexing_clients | default(8)}}
        }
      ]
}Not a lot has changed — we added a new object that puts the ingest pipeline and we added the pipeline name to the bulk operation in the bottom. This ensures that the pipeline is always the same version as in Rally.
We can run the same command above; just add the challenge to index-pipeline` instead.
Ingest pipeline
We will create an ingest pipeline together that should parse the majority of the message field and put it into the correct fields. We are not going to benchmark the impact of different processors, such as GROK vs. Dissect, with this blog. You can simply add a new challenge and call it pipeline-with-grok and benchmark that against pipeline-with-dissect. We leverage the Ingest Pipeline Simulate API through the Kibana Dev Tools, which has nice autocomplete, and we can supply some example documents to quickly test and make sure what we are doing is nice.
POST _ingest/pipeline/_simulate
{
  "docs": [
      {"_source": {
        "message":"66.154.51.14 - - [2018-09-14T10:41:52.659Z] \"GET /styles/app.css HTTP/1.1\" 200 6901 \"-\" \"Mozilla/5.0 (X11; Linux i686) AppleWebKit/534.24 (KHTML, like Gecko) Chrome/11.0.696.50 Safari/534.24\"","@timestamp":"2025-02-07T10:41:52.659Z"}}
  ],
  "pipeline": {
    "processors": [
      {
        "dissect": {
          "field": "message",
          "pattern": """%{source.ip} %{} [%{@timestamp}] "%{http.request.method} %{url.path} %{http.version}" %{http.request.status_code} %{http.request.bytes} "-" "%{user_agent}"""
        }
      },
      {
        "user_agent": {
            "field": "user_agent"
        }
      },
      {
         "geoip": {
            "field": "source.ip",
            "target_field": "source.geo"
         }
      }
    ]
  }
}Let’s go quickly through it. We want to extract a couple of things and put them into the respective Elastic Common Schema (ECS) fields. Additionally, we want to parse out the user_agent string. We are not using any date processor inside the pipeline, since the date is presented as ISO8601 and therefore automatically parsed by the mapping. One more thing we are doing is the geoip lookup to enrich the data with geolocation information.
Let’s see the results
We would recommend running the same test three or more times to ensure that we get a proper baseline of performance. Just to reiterate, please do not run this against your production cluster, because this can actively delete data. Additionally, it can lead to cluster instability when you go full force against it.
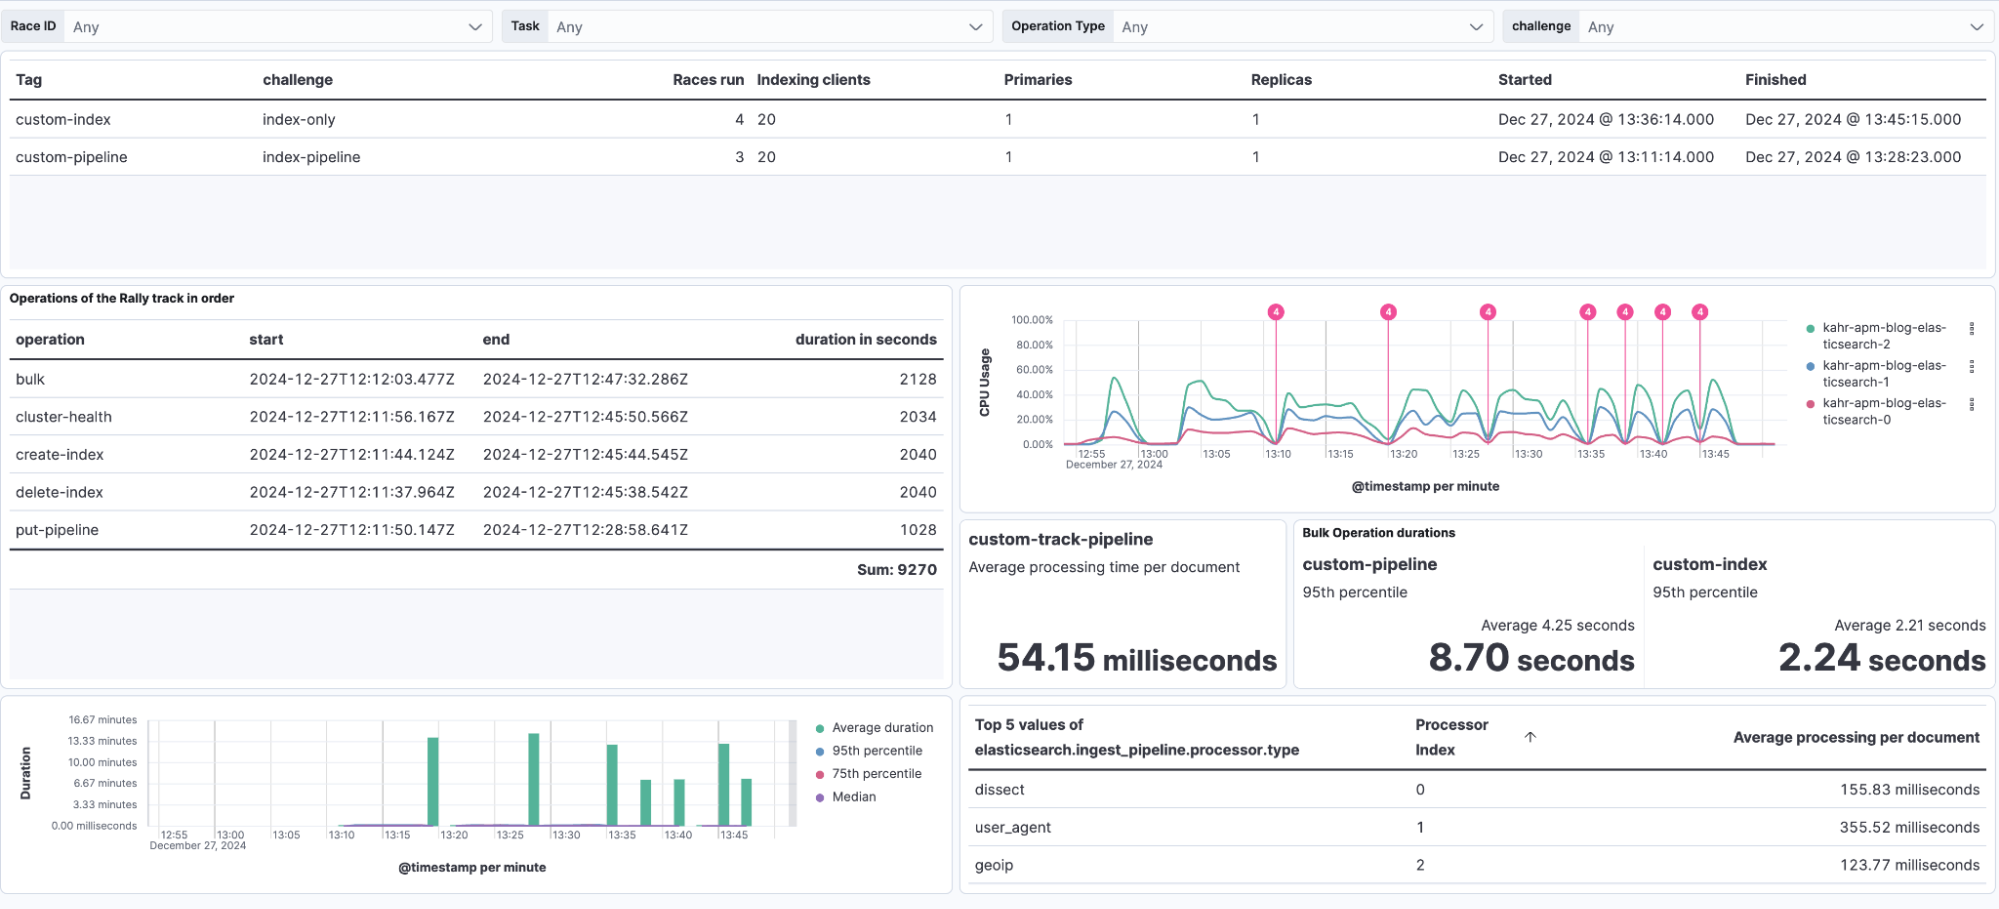
Looking at the dashboard below we built in the first Rally installation and air-gapped setup to benchmark Elasticsearch performance blog post, we can see that adding the ingest pipeline roughly doubled the processing time needed. We see an average of 2.21 seconds for the no-ingest pipeline and an average of 4.25 seconds for the ingested pipeline. What we can tell though is that based on the CPU chart above, the CPU average usage does not change between the tests. It just shows that the CPU usage stays higher for longer since the entire run takes longer to complete. All the magenta lines with the 4 at the top are the start time of the Rally tests.
All in all, you can follow along with this blog to test out the pipelines. There is also the possibility of an elastic-package benchmark to test based on an integration package, but that’s for another day.
Read this next: A step-by-step guide to creating custom ES Rally tracks.
The release and timing of any features or functionality described in this post remain at Elastic's sole discretion. Any features or functionality not currently available may not be delivered on time or at all.
Share
- Share on Twitter
Share on Twitter
- Share on LinkedIn
Share on LinkedIn
- Share on Facebook
Share on Facebook
- Share by Email
Share by Email
- Print this page
Print