A Profile a Day Keeps the Doctor Away: The Elasticsearch Search Profiler
Back in the dark ages of Elasticsearch, understanding why a query was slow required experience, intuition, reading some tea leaves and making sure the moon was precisely aligned with Jupiter (unless it's January, then Venus was a better option).
Of course, the length of a lunar cycle varies from month to month, so we decided a more scientific approach was needed.
In version 2.2, we added a Profile API to Elasticsearch. This API instruments each component of your search query and provides detailed timing information at each node. And in 5.0 we added support for aggregation profiling too, providing detailed timing breakdowns for each bucket and metric in your aggregation tree.
No longer do you have to divine knuckle bones and poke around mushy tea leaves; just send your query to the Profile API and get an accurate readout of which components are being slow. Progress!
There is, however, one minor hiccup. The Profile API is verbose. Fill-your-screen-with-megabytes-of-JSON verbose. Users generally expect diagnostics like a profiler to run slower, generate more output and are produce more technical responses than other APIs. So we used that as a license to go whole hog and extract every last bit of information that we could. The Profile API collects timings and method invocation-counts for each component in your query, on each shard in the index, in every index being queried.
So if you are profiling a somewhat complex query across several indices -- each holding a non-negligible amount of data -- the response you get back will be positively huge.
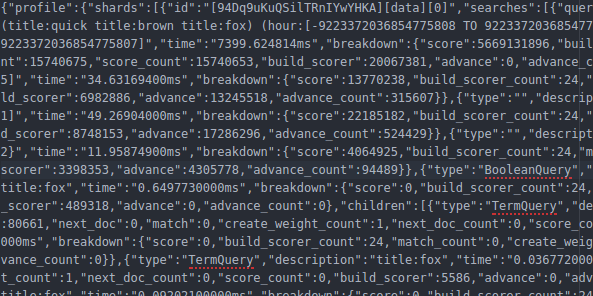
Our support team often asks for Profile outputs when customers are experiencing slow queries… and they often forward those outputs to me asking for help. I can assure you, it only takes a few episodes of dealing with a multi-megabyte JSON blob to realize there needs to be a better way to parse the output. The human eye is just not equipped to deal with that many curly braces!
Iterating on a useful tool
Thus began a project to help visualize and interact with the Profile API's output. The Search Profiler was originally an in-house tool to help our support engineers. The JSON queries that you construct and send to Elasticsearch are essentially a tree structure. Compound queries (such as Boolean queries) represent tree nodes that hold children queries. These children can themselves be compound queries which hold their own children, or they can be "leaf" queries that interact score documents directly (such as a Term query).
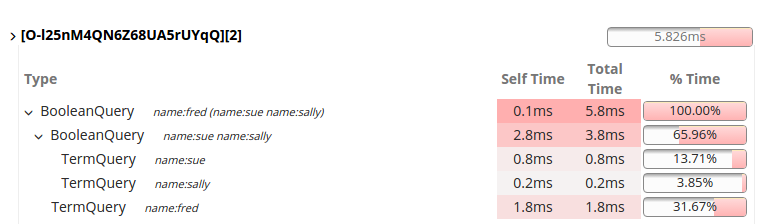
So the first iteration of the Search Profiler attempted to represent the query -- and its associated profiling times -- as a tree structure. If you attended Elasticon 2016 you may have noticed this screenshot floating around:
This hierarchical layout worked great in small tests. But, as so often in real life, it fell apart when it met real user data. As the query complexity increased, the hierarchical layout became increasingly difficult to fit on the screen, let alone understand in an intuitive manner. Showing many shards in a compact manner became especially troublesome. It is not uncommon to be querying dozens of indices, each with 5+ shards, with a large and complex query. The output from the Search Profiler was almost as verbose as the source JSON.
We iterated on the tree structure for a while, adding support for auto-collapsing "uninteresting" branches and dynamic scrolling.

But ultimately, the tree structure sacrificed precision detail (which is critically important in a profiling tool!) for a pretty "high-level" view. We also realized that as the query complexity increases, the relative differences between nodes becomes very small (e.g. each node is 0.5% of the total query time). Seeing a hotspot becomes very difficult in a tree view because all nodes assume the same bland, gray color.
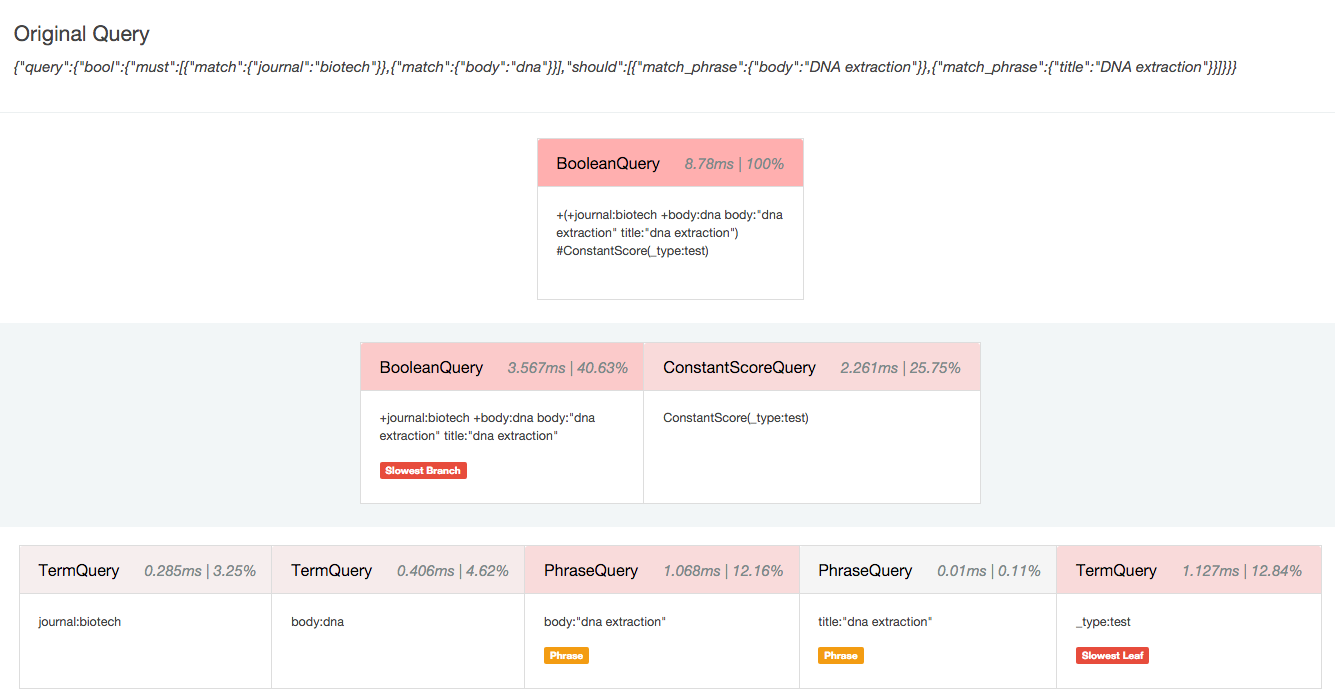
We decided to move away from the tree design and adopt a more conventional profiling output: hierarchical list-view with percentage bars. This gives a compact, informative representation of the profile information, and allows the user to quickly identify hotspots in the query.
X-Pack's Search Profiler
The Search Profiler is no longer just an in-house tool. As of 5.1, the Search Profiler ships with X-Pack Kibana. It allows users to input any search query and quickly generate a visualization from the API's response. The Search Profiler will show a list of indices and shards involved in the search, and for each shard, a dropdown tree of query timings. The tree is interactive; collapse or expand portions of interest, hide entire shards if you're not interested, hover on timings to get more detailed information in the right-hand panel.
Each component in the query tree reports the total time at that node (i.e. how much time that node and all children took) as well as "self time" (the amount of time taken by that query itself, not including children). It also gives a visual indicator of how much time that component takes by plotting a percentage bar, allowing the user to quickly find hotspots.
The Search Profiler has two tabs, one for Search and another for Aggregations. The tabs will automatically populate depending on the contents of your request.
Best of all, Search Profiler is free for everyone. We strongly feel that diagnostic tools like Search Profiler and Monitoring should be free for everyone to use, which is why the Search Profiler will work with any X-Pack license (Basic, Gold and Platinum).
Check out the Search Profiler Documentation for a walk-through of the various features, or the Profile API reference documentation for more details about what all the technical terms mean.
Go forth and profile some misbehaving queries!