5 questions about Ansible that Elastic Observability can answer


 Share on Twitter
Share on Twitter

 Share on LinkedIn
Share on LinkedIn

 Share on Facebook
Share on Facebook

 Share by Email
Share by Email

 Print this page
Print
While automating systems is seen as an imperative in boardrooms around the globe, automation teams — the teams on the ground — often lack the data to help them to industrialize their automation efforts and move from ad-hoc automation to strategic automation.
In this automation-focused blog post, we will show how to instrument infrastructure automation with Elastic Observability. With Elastic Observability, automation teams can produce information that will help them identify areas for optimization, and develop dashboards that communicate business value to stakeholders and the c-suite.
We will demonstrate how observability can help automation teams answer five critical questions to determine how their processes are performing, namely:
- How are the performance of my automation services trending?
- What are the specific issues and bottlenecks?
- What is the general health of our automation capability?
- Is automation saving my business time and increasing productivity?
- Are teams using automation effectively and where can we optimize?
We will explore how we use the data to optimize automation and then look at how we configure Ansible command line as well as AWX (Tower) to extract the data.
Out of the box
The pipeline instrumentation for Ansible is based on OpenTelemetry. This provides an open source approach to telemetry collection where the Elastic team is working with the Ansible community to provide Ansible visibility.
By default the export publishes OpenTelemetry compliant data to Elastic Application Performance Monitoring (APM), which provides immediate insights into how automation flows are performing.
Start with the end in mind: What does the data tell us about our pipelines and their performance?
How are the performance of my automation services trending?
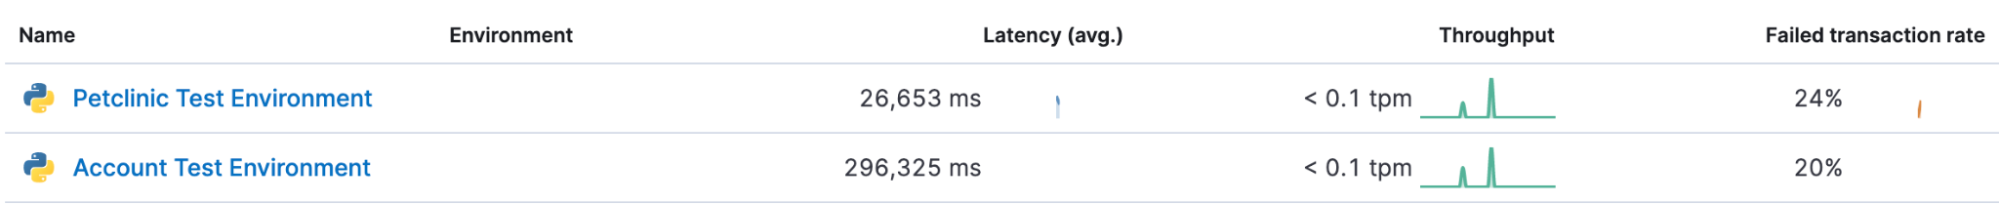
In the example scenario we have automation flows and tests grouped by services, the Services view provides an overview of all the services that your team might be managing with insights into average runtime (Latency) and failure rate.
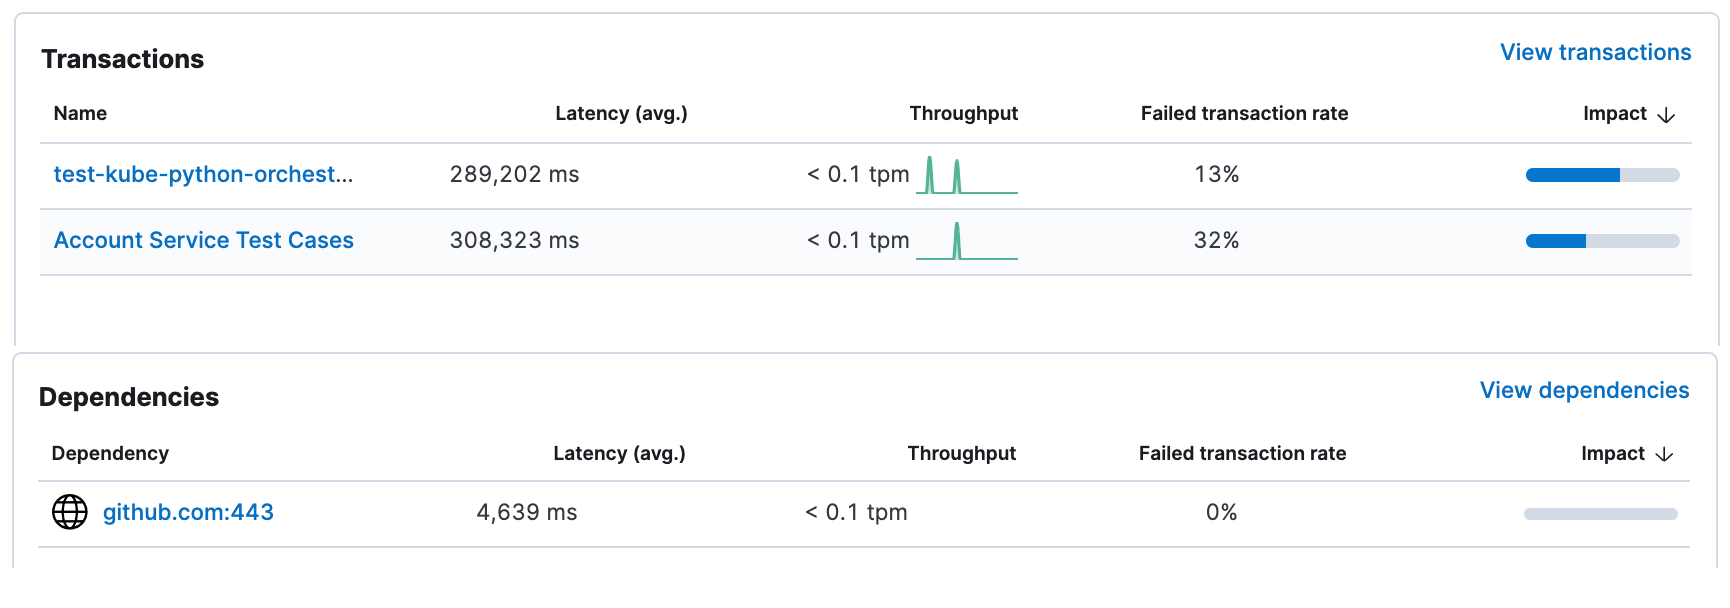
Drilling down into a service provides information on the playbooks and tests that we run as part of this service as well as how our dependencies are performing.
What are the specific issues and bottlenecks?
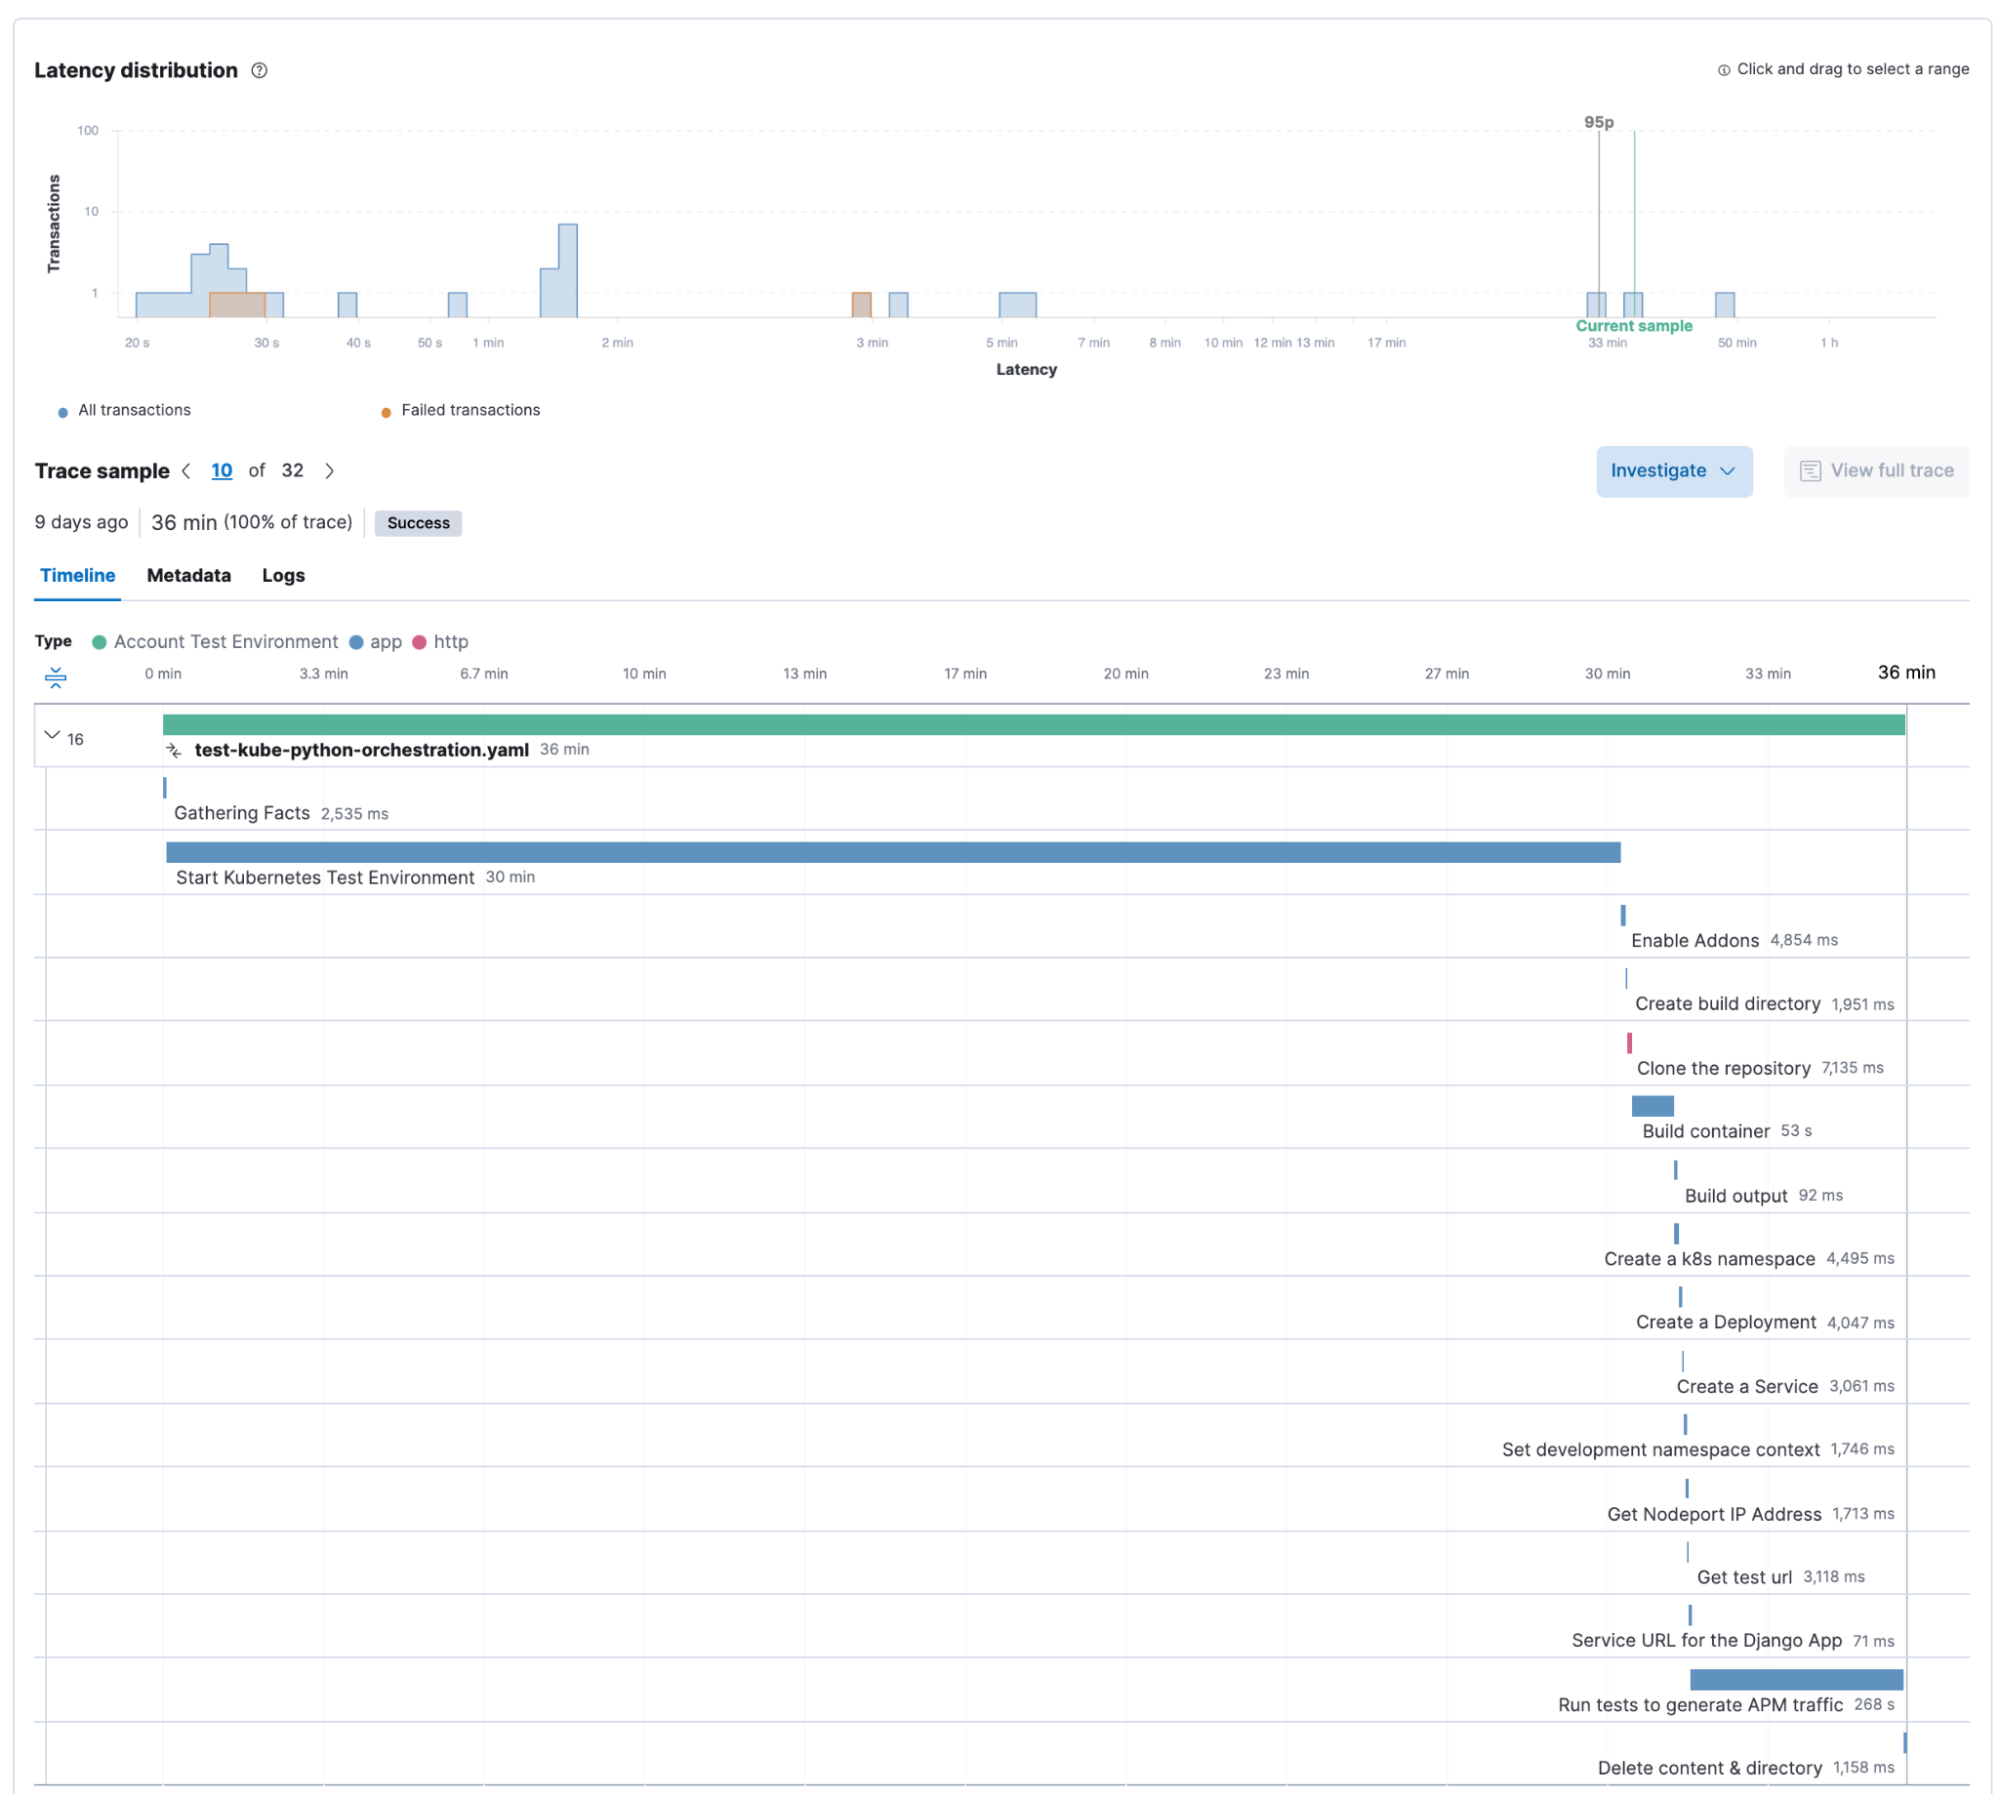
It seems that this has some work to do to improve the resilience of their automation, so they would drill down into a specific “Transaction” to see how the individual tasks run. In this example our Kubernetes environment took much longer than usual, but the transaction did not fail.
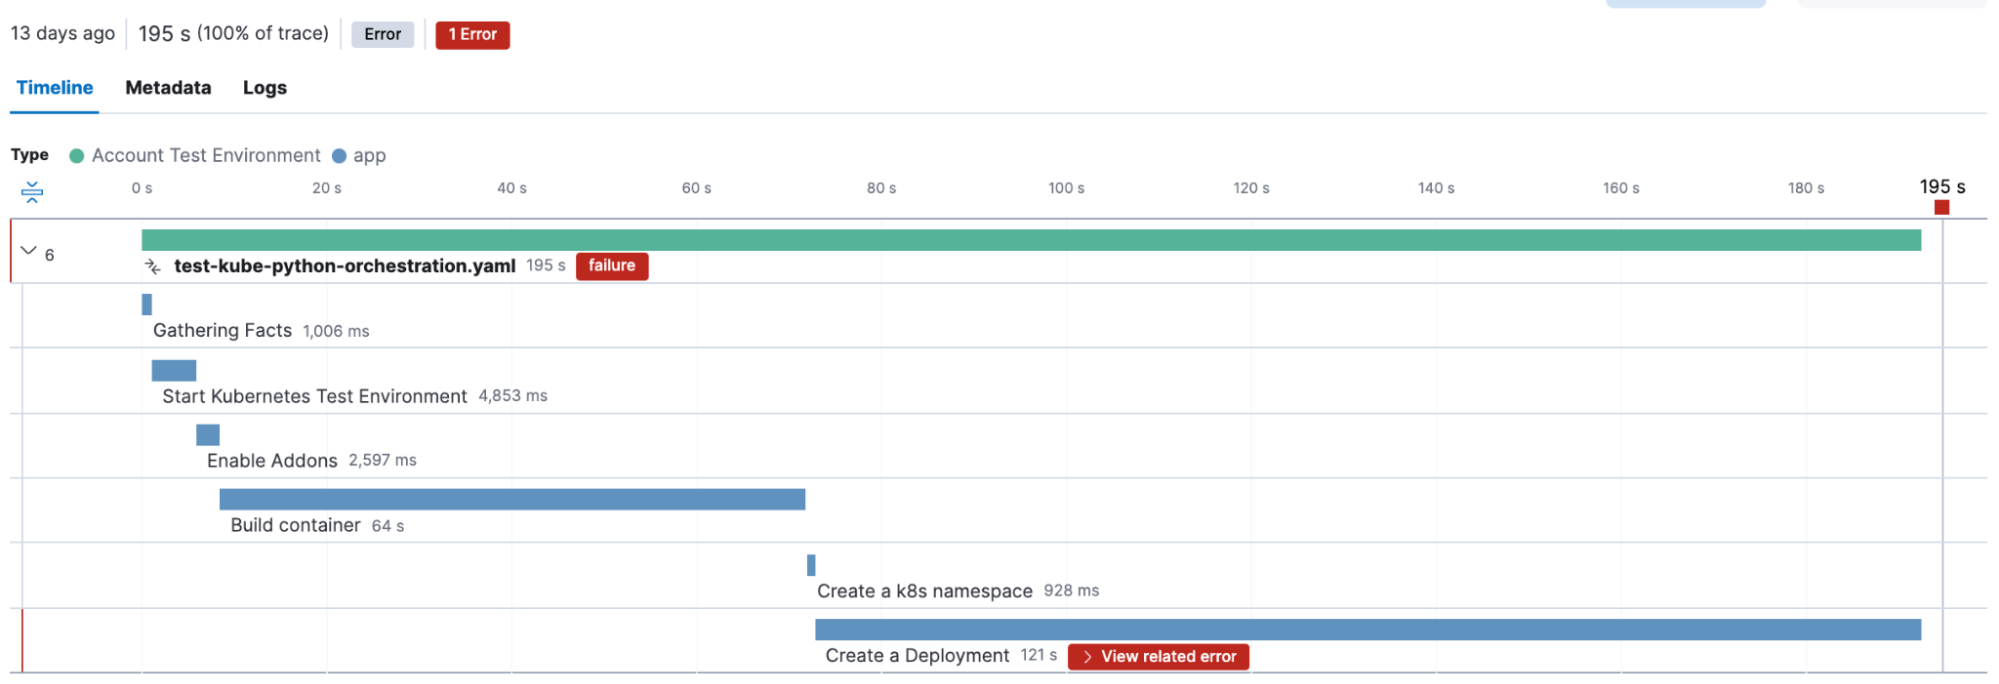
This automation however failed, and by clicking on the failed task we can immediately get more information on the Ansible task details as well as the error message.

You might notice some interesting fields in the span details above. The Ansible Open Telemetry callback plugin appends labels to the OpenTelemetry data, and we can use these labels to build custom dashboards and queries. In fact we can add our own custom labels, in this example “manual_effort” and “team” to further refine our dashboards.
Now let us explore what type of higher level questions we can answer by instrumenting our automation flows. For this we will use dashboards to summarize data.
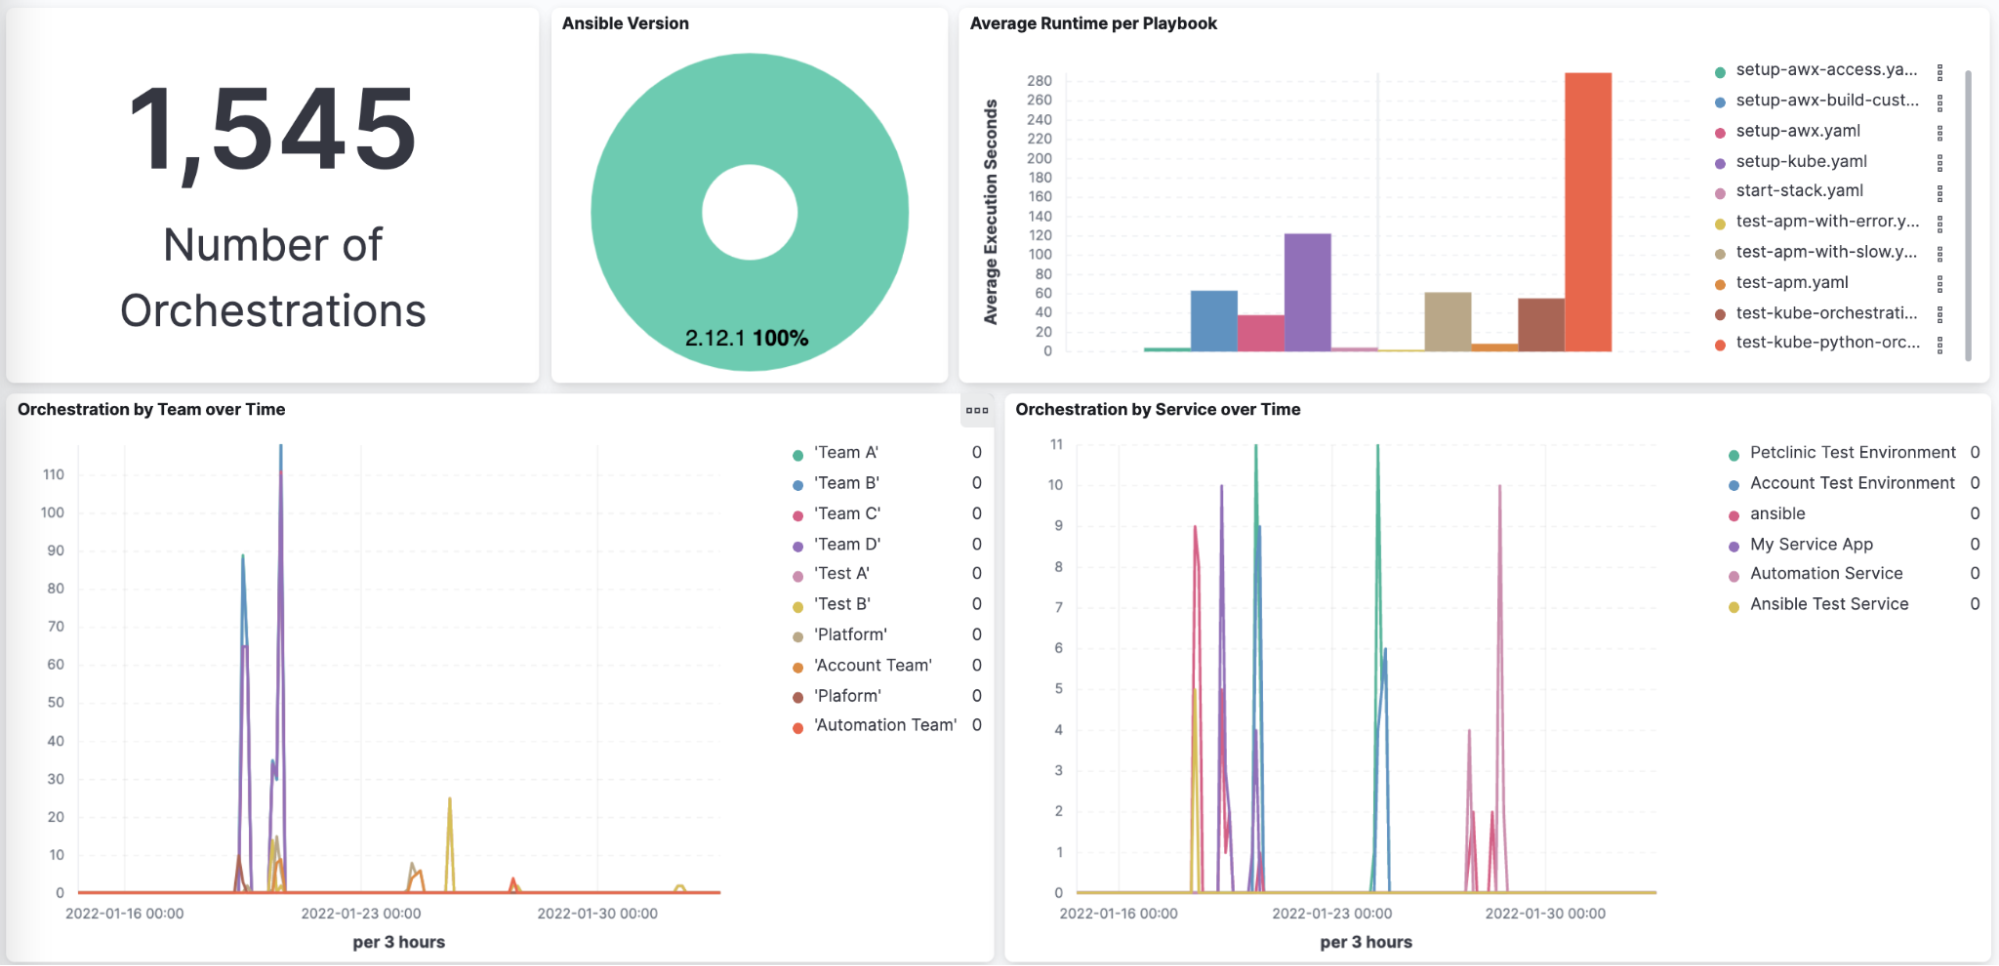
What is the general health of our automation capability?
The first set of questions I would like to answer is related to how much automation the teams do overall and when they run the automation. It would also be good to understand if the Ansible version is consistent over time.
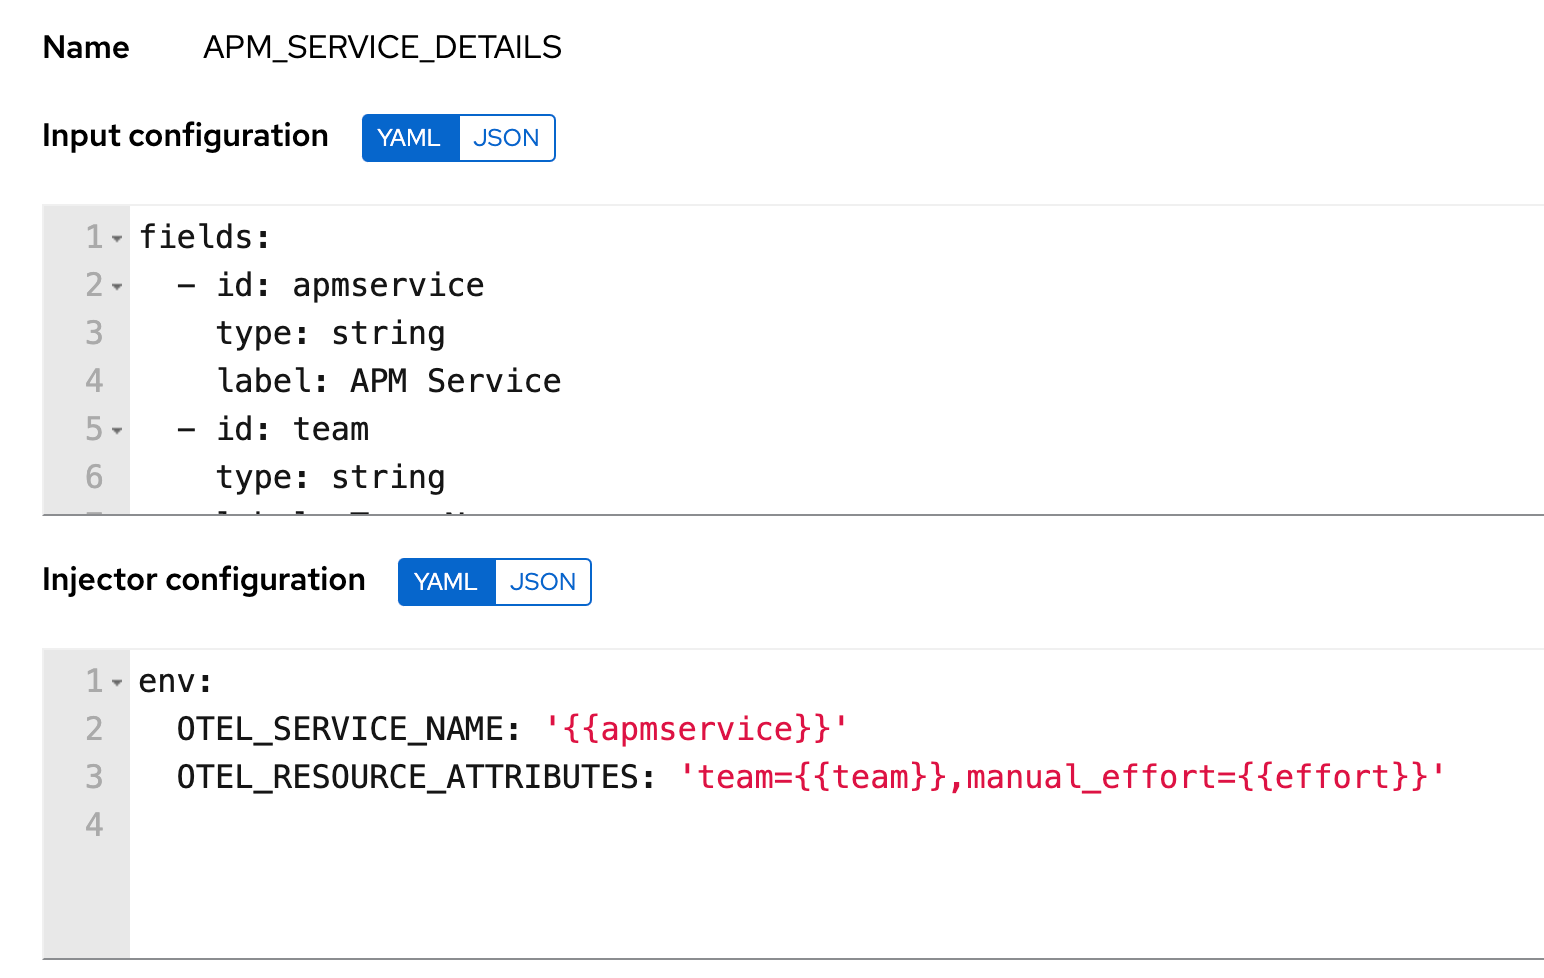
Most of this information is available out of the box. The Ansible plugin has two variables that we use to group information by Team and also by Service:
- OTEL_SERVICE_NAME - This variable enables the Service Grouping for example our “Account Test Environment” service in the Service Overview view at the top.
- OTEL_RESOURCE_ATTRIBUTES - this is a catch-all variable that enables us to set any custom attribute that would be useful. In our case we are logging “team name” and also “expected manual effort”.
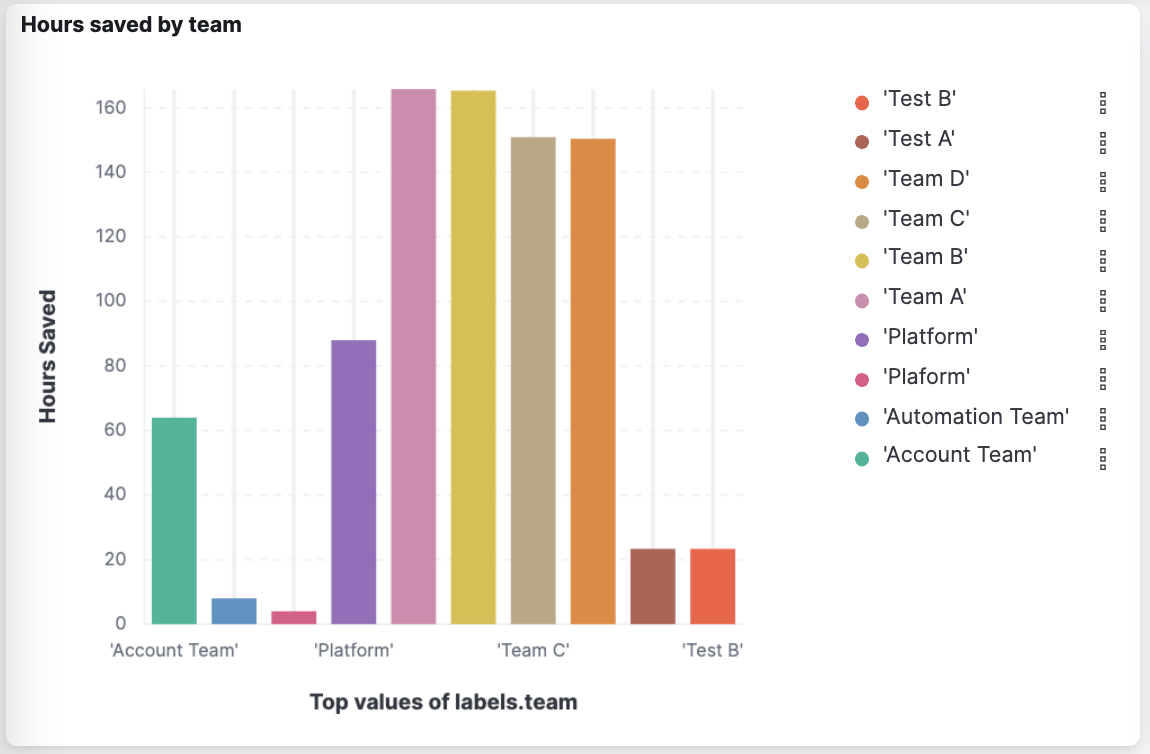
Is automation saving my business time and increasing productivity?
Capturing the team names and also the expected manual effort per automation flow enables us to build dashboards that demonstrate how much manual effort the teams saved over time through automation. This dashboard adds the hours of manual effort per team over time and is management gold and enables organizations to justify the effort required to deploy, run and expand enterprise wide automation.
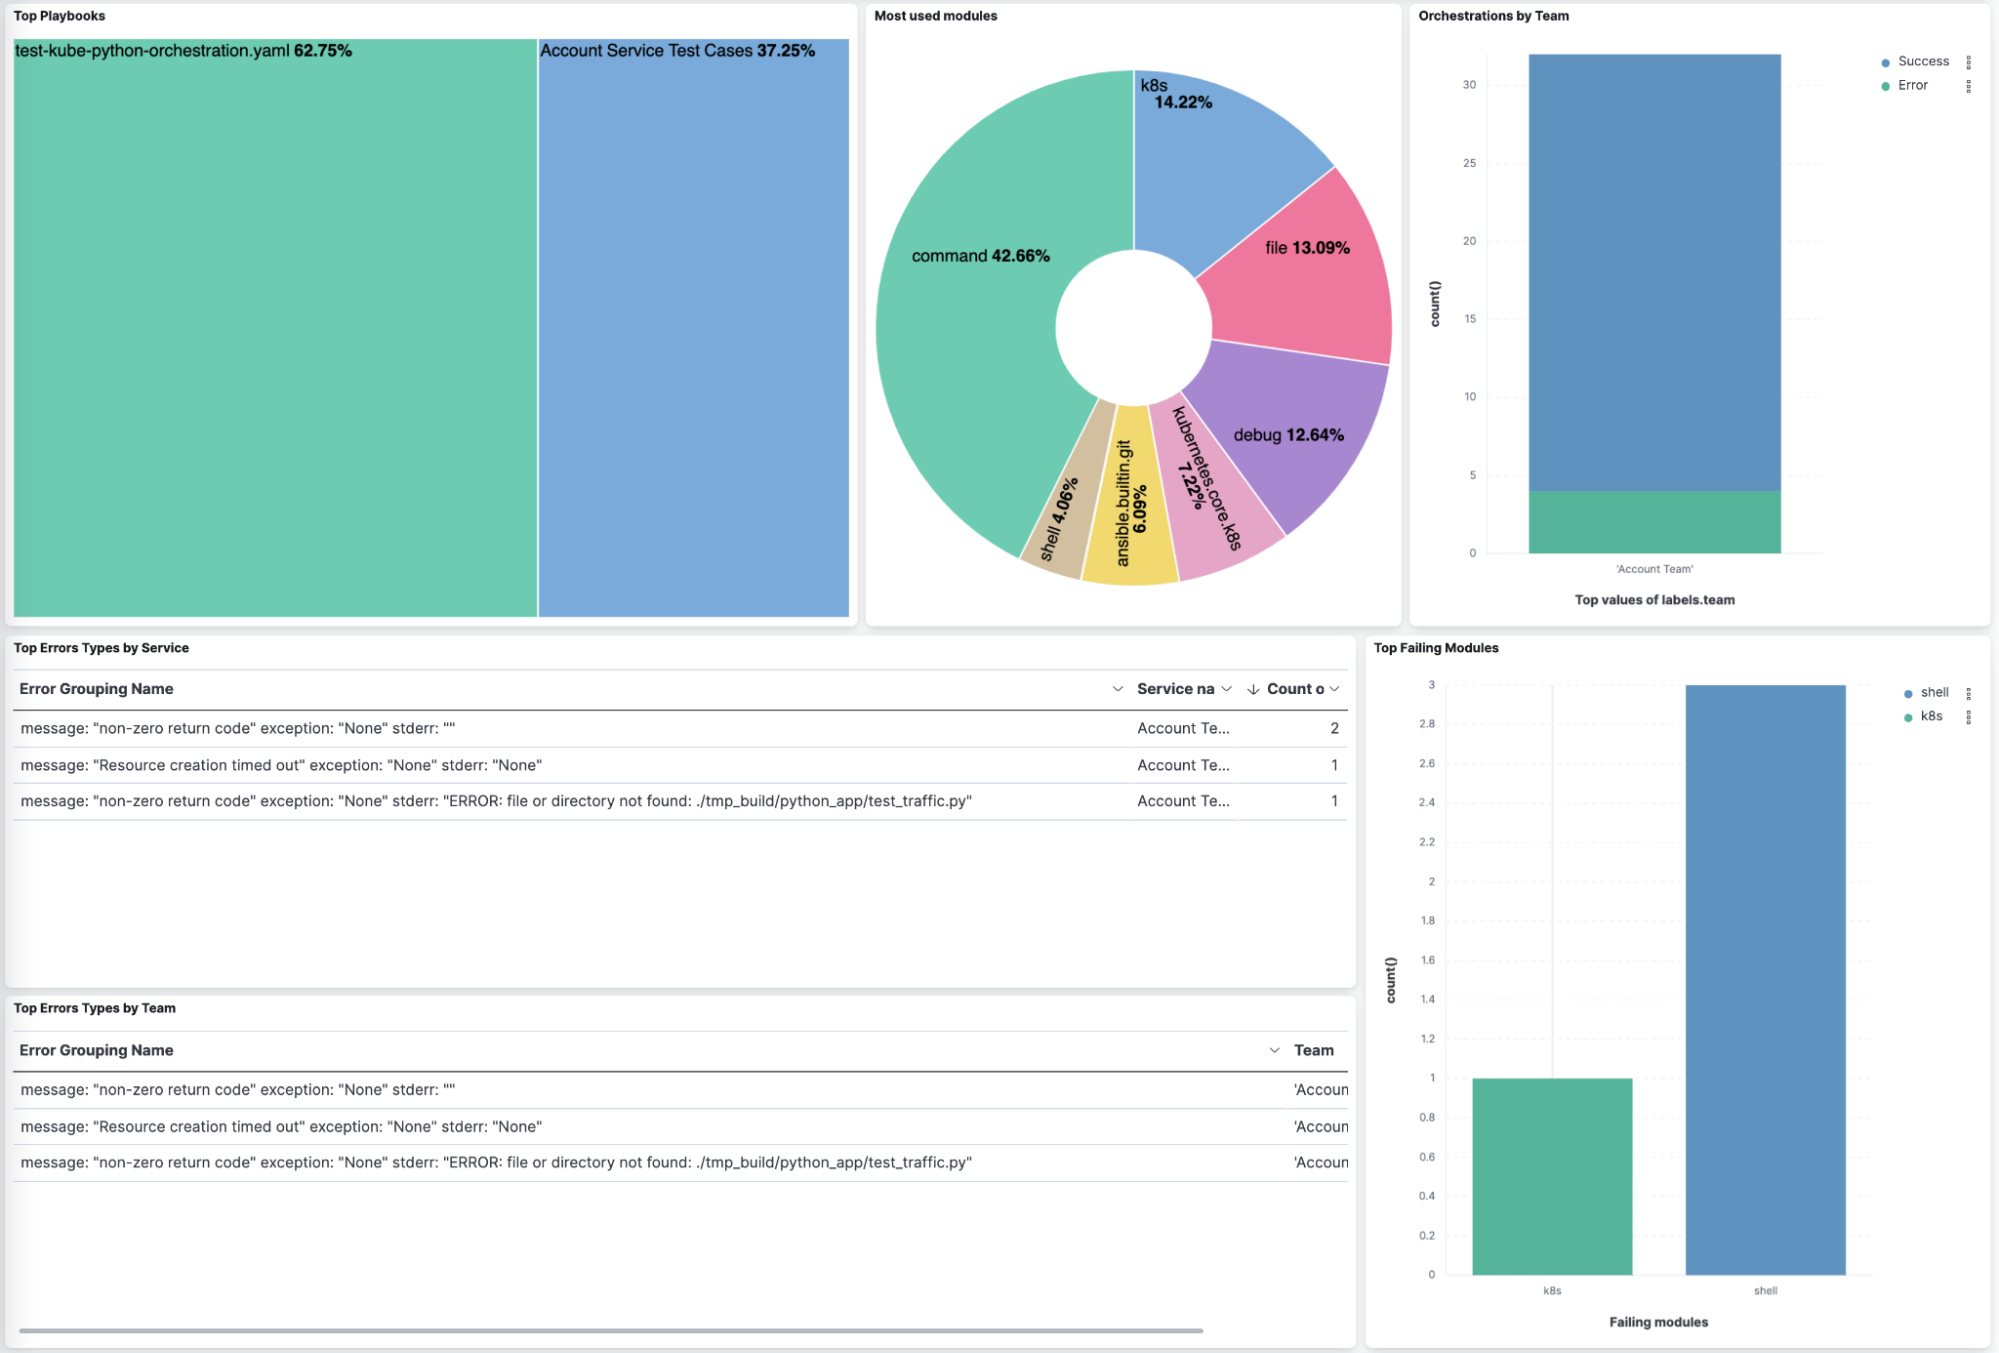
Are teams using automation effectively and where can we optimize?
The last set of questions we are looking at is to try and understand which modules teams use and also which modules they have issues with.
The Ansible plugin captures the Ansible task level information and from this we can see that teams use more command and shell modules than Ansible good practices would encourage. This would be an opportunity for this team to optimize their work. It also shows that the team has a large number of failures due to how they use the shell module with a summary of the top errors. Having this information readily available highlights areas for improvement and quick wins.
Instrumenting Ansible: Zero playbook changes!
The good news here is that instrumenting playbooks do not require any changes to the actual playbooks themselves. At a bare minimum it requires the ansible community package, three python dependencies, an entry in the ansible.cfg file and environment variables that point to the Elastic APM Server.
This section will cover the required changes at a high level, if you want to get into the details please refer to this repository.
Command line Ansible
The command line Ansible configuration requires four steps:
- Install the Ansible community.general package
- Install the Python dependencies: opentelemetry-exporter-otlp
- Update the ansible.cfg file and
callbacks_enabled = community.general.opentelemetry - Specify OTEL_EXPORTER_OTLP_ENDPOINT as an environment variable
Configuring AWX/Tower
There is a slight nuance in where to apply the configuration when using AWX or Ansible Tower. AWX in this project runs on Kubernetes, so the settings and packages we require are in specific components.
Packages
AWX requires an Execution Environment with the Ansible and Python packages installed. For this we used the Ansible Builder tool to create the container definition.
You then upload the container to an image repository accessible by AWX and define an Execution Environment using the container you created.
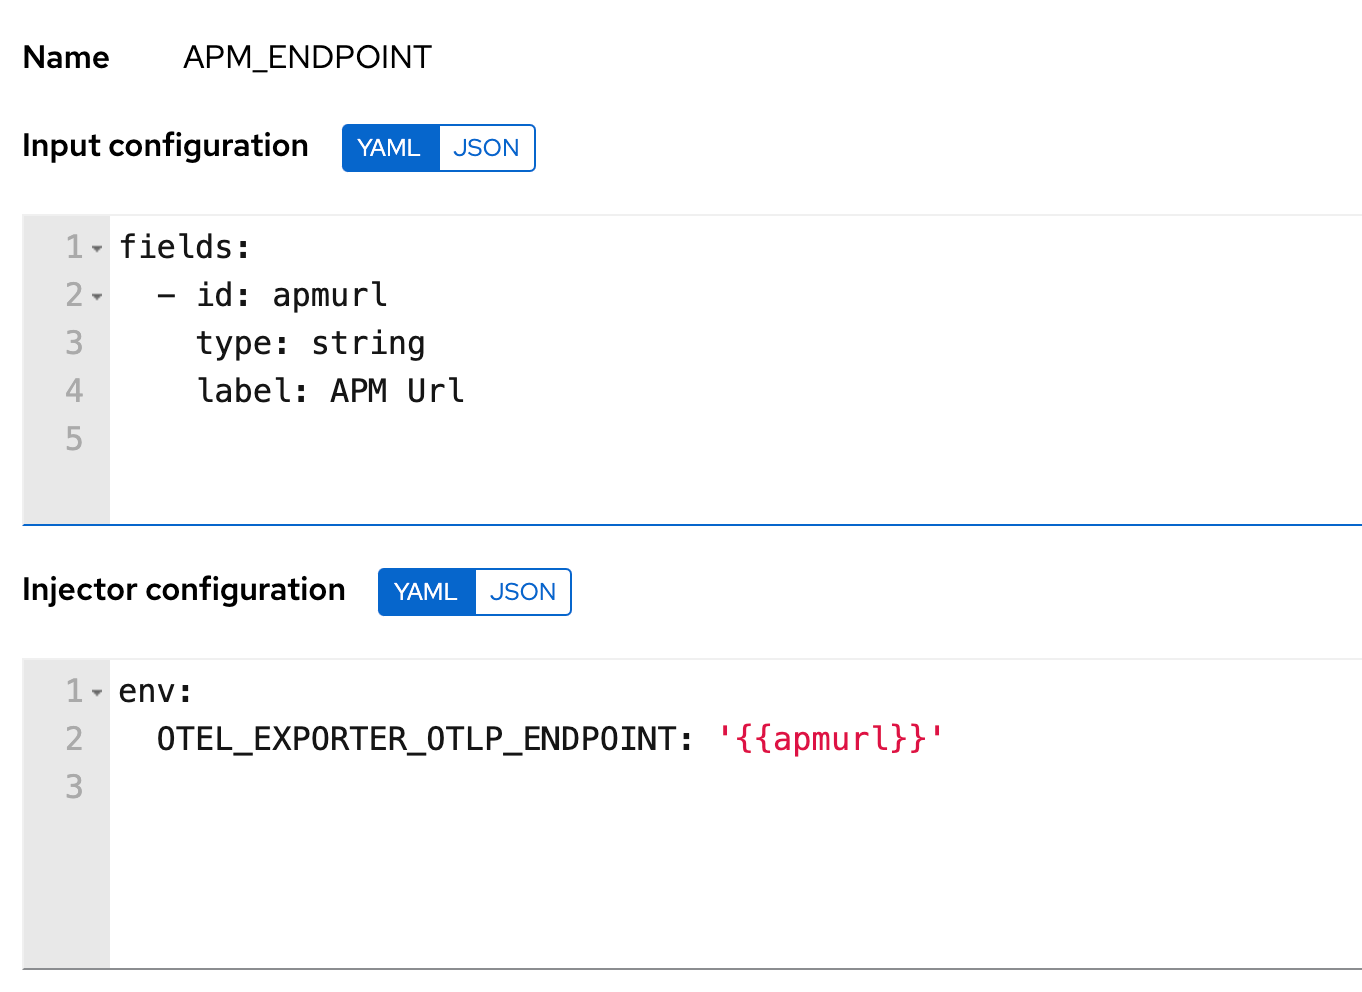
Service details and environment variables
To inject the environment variables and service details you can use custom credential types and then assign the credentials to the Playbook template. This gives you the flexibility to reuse the endpoint details for Elastic APM and also standardize on custom fields for reporting purposes.
Ansible Config file
The easiest way to propagate the Ansible Config file setting is to include the anisble.cfg file in the root folder of the automation project that you use for the templates in.
That is all there is to it. Once that is done the telemetry data for the playbooks you run in AWX will appear in Elastic providing you with great insights.
Summary
In this blog post we demonstrated how instrumenting your Ansible automation can provide insights that will help you optimize and industrialize automation in your organization. We also showed how easy it is to instrument your Ansible automation flows.
Please reach out and share your thoughts on what insights you would like to drive from your automation. Learn more here.
Share
- Share on Twitter
Share on Twitter
- Share on LinkedIn
Share on LinkedIn
- Share on Facebook
Share on Facebook
- Share by Email
Share by Email
- Print this page
Print