What is kNN?
K-nearest neighbor definition
kNN, or the k-nearest neighbor algorithm, is a machine learning algorithm that uses proximity to compare one data point with a set of data it was trained on and has memorized to make predictions. This instance-based learning affords kNN the 'lazy learning' denomination and enables the algorithm to perform classification or regression problems. kNN works off the assumption that similar points can be found near one another — birds of a feather flock together.
As a classification algorithm, kNN assigns a new data point to the majority set within its neighbors. As a regression algorithm, kNN makes a prediction based on the average of the values closest to the query point.
kNN is a supervised learning algorithm in which 'k' represents the number of nearest neighbors considered in the classification or regression problem, and 'NN' stands for the nearest neighbors to the number chosen for k.
Brief history of the kNN algorithm
kNN was first developed by Evelyn Fix and Joseph Hodges in 1951 in the context of research performed for the US military1. They published a paper explaining discriminant analysis, which is a non-parametric classification method. In 1967, Thomas Cover and Peter Hart expanded on the non-parametric classification method and published their "Nearest Neighbor Pattern Classification" paper2. Almost 20 years later, the algorithm was refined by James Keller, who developed a "fuzzy KNN" that produces lower error rates3.
Today, the kNN algorithm is the most widely used algorithm due to its adaptability to most fields — from genetics to finance and customer service.
How does kNN work?
The kNN algorithm works as a supervised learning algorithm, meaning it is fed training datasets it memorizes. It relies on this labeled input data to learn a function that produces an appropriate output when given new unlabeled data.
This enables the algorithm to solve classification or regression problems. While kNN's computation occurs during a query and not during a training phase, it has important data storage requirements and is therefore heavily reliant on memory.
For classification problems, the KNN algorithm will assign a class label based on a majority, meaning that it will use the label that is most frequently present around a given data point. In other words, the output of a classification problem is the mode of the nearest neighbors.
A distinction: majority voting vs. plurality voting
Majority voting denotes anything over 50% as the majority. This applies if there are two class labels in consideration. However, plurality voting applies if multiple class labels are being considered. In these cases, anything over 33.3% would be sufficient to denote a majority, and hence provide a prediction. Plurality voting is therefore the more accurate term to define kNN's mode.
If we were to illustrate this distinction:
A binary prediction
Y: 🎉🎉🎉❤️❤️❤️❤️❤️
Majority vote: ❤️
Plurality vote: ❤️
A multi-class setting
Y: ⏰⏰⏰💰💰💰🏠🏠🏠🏠
Majority vote: None
Plurality vote: 🏠
Regression problems use the mean of the nearest neighbors to predict a classification. A regression problem will produce real numbers as the query output.
For example, if you were making a chart to predict someone's weight based on their height, the values denoting height would be independent, while the values for weight would be dependent. By performing a calculation of the average height-to-weight ratio, you could estimate someone's weight (the dependent variable) based on their height (the independent variable).
4 types of computing kNN distance metrics
The key to the kNN algorithm is determining the distance between the query point and the other data points. Determining distance metrics enables decision boundaries. These boundaries create different data point regions. There are different methods used to calculate distance:
- Euclidean distance is the most common distance measure, which measures a straight line between the query point and the other point being measured.
- Manhattan distance is also a popular distance measure, which measures the absolute value between two points. It is represented on a grid, and often referred to as taxicab geometry — how do you travel from point A (your query point) to point B (the point being measured)?
- Minkowski distance is a generalization of Euclidean and Manhattan distance metrics, which enables the creation of other distance metrics. It is calculated in a normed vector space. In the Minkowski distance, p is the parameter that defines the type of distance used in the calculation. If p=1, then the Manhattan distance is used. If p=2, then the Euclidean distance is used.
- Hamming distance, also referred to as the overlap metric, is a technique used with Boolean or string vectors to identify where vectors do not match. In other words, it measures the distance between two strings of equal length. It is especially useful for error detection and error correction codes.
How to choose the best k value
To choose the best k value — the number of nearest neighbors considered — you must experiment with a few values to find the k value that generates the most accurate predictions with the fewest number of errors. Determining the best value is a balancing act:
- Low k values make predictions unstable.
Take this example: a query point is surrounded by 2 green dots and one red triangle. If k=1 and it happens that the point closest to the query point is one of the green dots, the algorithm will incorrectly predict a green dot as the outcome of the query. Low k values are high variance (the model fits too closely to the training data), high complexity, and low bias (the model is complex enough to fit the training data well). - High k values are noisy.
A higher k value will increase the accuracy of predictions because there are more numbers of which to calculate the modes or means. However, if the k value is too high, it will likely result in low variance, low complexity, and high bias (the model is NOT complex enough to fit the training data well).
Ideally, you want to find a k value that is between high variance and high bias. It is also recommended to choose an odd number for k to avoid ties in classification analysis.
The right k value is also relative to your data set. To choose that value, you might try to find the square root of N, where N is the number of data points in the training dataset. Cross-validation tactics can also help you choose the k value best suited to your dataset.
Advantages of the kNN algorithm
The kNN algorithm is often described as the “simplest” supervised learning algorithm, which leads to its several advantages:
- Simple: kNN is easy to implement because of how simple and accurate it is. As such, it is often one of the first classifiers that a data scientist will learn.
- Adaptable: As soon as new training samples are added to its dataset, the kNN algorithm adjusts its predictions to include the new training data.
- Easily programmable: kNN requires only a few hyperparameters — a k value and a distance metric. This makes it a fairly uncomplicated algorithm.
In addition, the kNN algorithm requires no training time because it stores training data and its computational power is used only when making predictions.
Challenges and limitations of kNN
While the kNN algorithm is simple, it also has a set of challenges and limitations, due in part to its simplicity:
- Difficult to scale: Because kNN takes up a lot of memory and data storage, it brings up the expenses associated with storage. This reliance on memory also means that the algorithm is computationally intensive, which is in turn resource-intensive.
- Curse of dimensionality: This refers to a phenomenon that occurs in computer science, wherein a fixed set of training examples is challenged by an increasing number of dimensions and the inherent increase of feature values in these dimensions. In other words, the model’s training data can’t keep up with the evolving dimensionality of the hyperspace. This means that predictions become less accurate because the distance between the query point and similar points grows wider — on other dimensions.
- Overfitting: The value of k, as shown earlier, will impact the algorithm’s behavior. This can happen especially when the value of k is too low. Lower values of k can overfit the data, while higher values of k will ‘smooth’ the prediction values because the algorithm averages values over a greater area.
Top kNN use cases
The kNN algorithm, popular for its simplicity and accuracy, has a variety of applications, especially when used for classification analysis.
- Relevance ranking: kNN uses natural language processing (NLP) algorithms to determine which results are most relevant to a query.
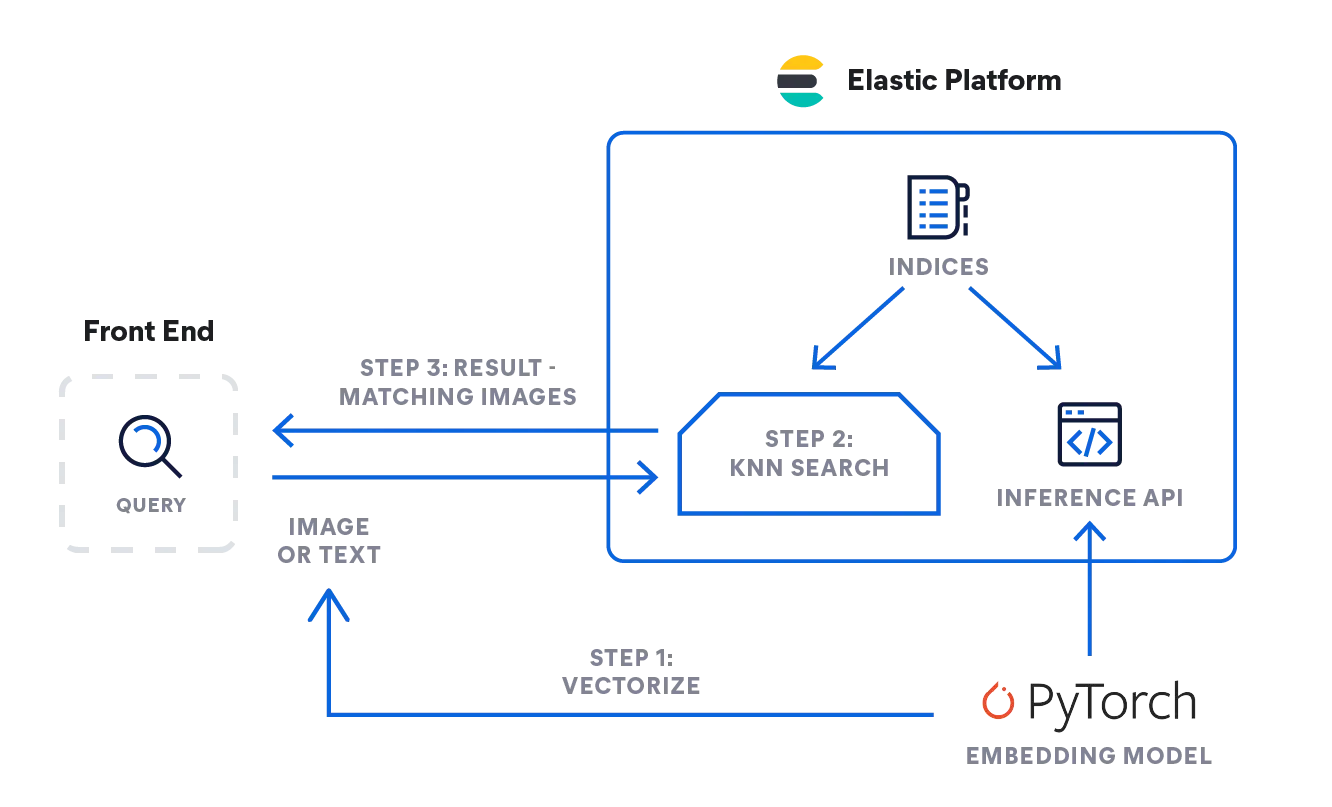
- Similarity search for images or videos: Image similarity search uses natural language descriptions to find images matching from text queries.
- Pattern recognition: kNN can be used to identify patterns in text or digit classification.
- Finance: In the financial sector, kNN can be used for stock market forecasting, currency exchange rates, etc.
- Product recommendations and recommendation engines: Think Netflix! "If you liked this, we think you'll also like…" Any site that uses a version of that sentence, overtly or not, is likely using a kNN algorithm to power its recommendation engine.
- Healthcare: In the field of medicine and medical research, the kNN algorithm can be used in genetics to calculate the probability of certain gene expressions. This allows doctors to predict the likelihood of cancer, heart attacks, or any other hereditary conditions.
- Data preprocessing: The kNN algorithm can be used to estimate missing values in datasets.
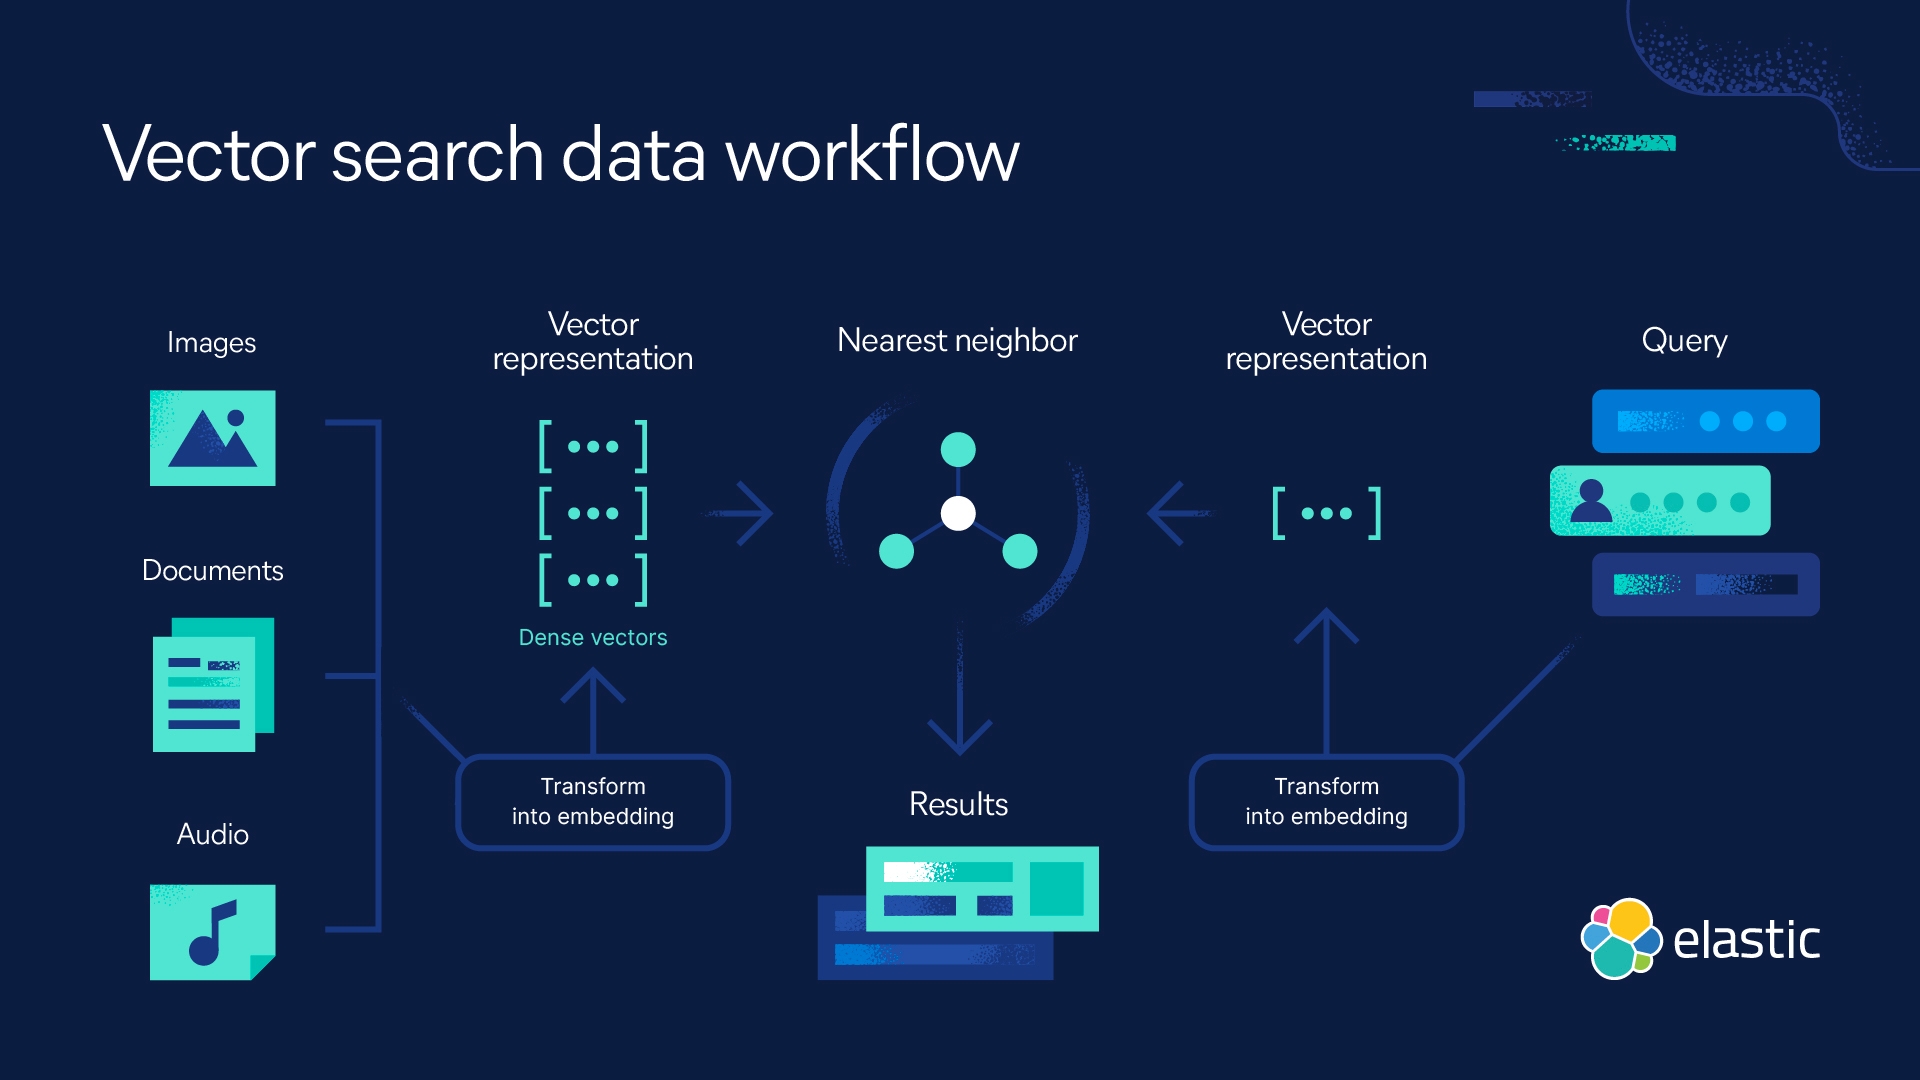
kNN search with Elastic
Elasticsearch enables you to implement kNN search. Two methods are supported: approximate kNN and exact, brute-force kNN. You can use kNN search in the context of similarity search, relevance ranking based on NLP algorithms, and product recommendations and recommendation engines.
K-nearest neighbors FAQ
When to use kNN?
Use kNN to make predictions based on similarity. As such, you can use kNN for relevance ranking in the context of natural language processing algorithms, for similarity search and recommendation engines, or product recommendations. Note that kNN is useful when you have a relatively small dataset.
Is kNN supervised or unsupervised machine learning?
kNN is supervised machine learning. It is fed a set of data it stores and only processes the data when queried.
What does kNN stand for?
kNN stands for k-nearest neighbor algorithm, where k denotes the number of nearest neighbors considered in the analysis.
Footnotes
- Silverman, B.W., & Jones, M.C. (1989). E. Fix and J.L Hodes (1951): An Important Contribution to Nonparametric Discriminant Analysis and Density Estimation: Commentary on Fix and Hodges (1951). International Statistical Institute (ISI) / Revue Internationale de Statistique,57(3), 233–238. https://doi.org/10.2307/1403796
- T. Cover and P. Hart, "Nearest neighbor pattern classification," in IEEE Transactions on Information Theory, vol. 13, no. 1, pp. 21-27, January 1967, doi: 10.1109/TIT.1967.1053964. https://ieeexplore.ieee.org/document/1053964/authors#authors
- K-Nearest Neighbors Algorithm: Classification and Regression Star, History of Data Science, Accessed: 10/23/2023, https://www.historyofdatascience.com/k-nearest-neighbors-algorithm-classification-and-regression-star/