Kibana Dashboard
Find insights. Take action.
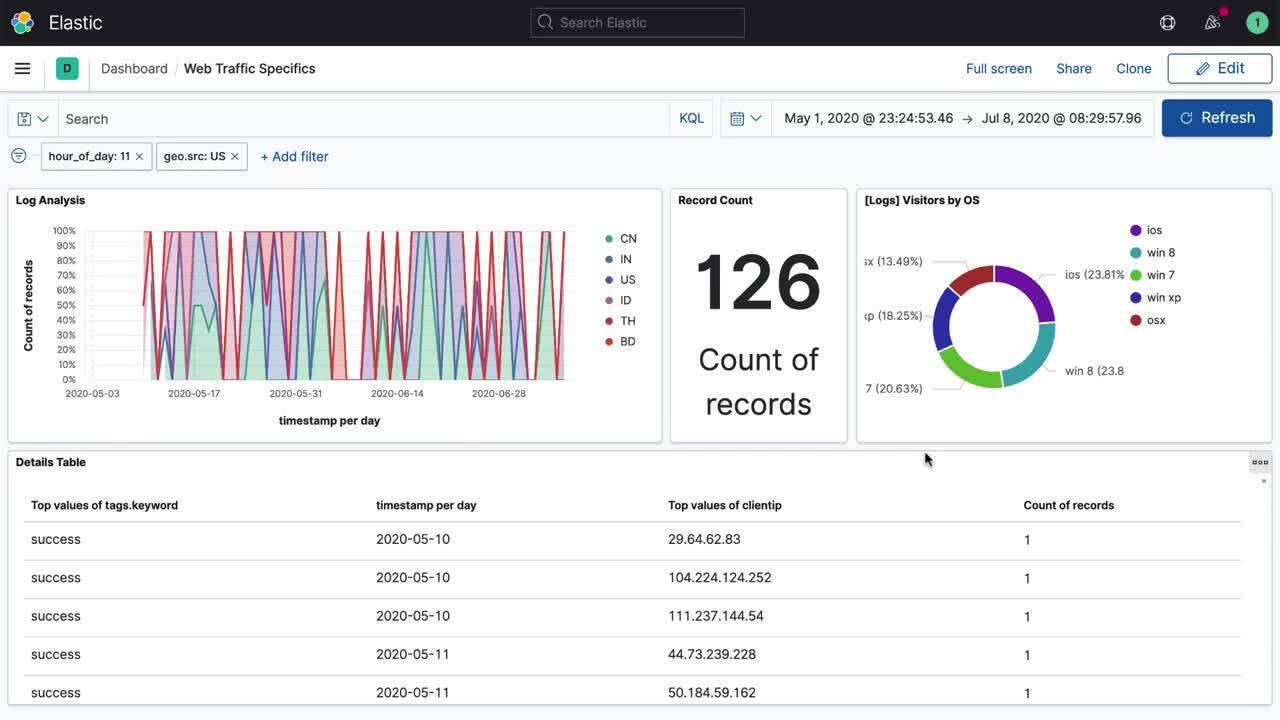
Dashboards in Kibana let you rapidly create views that pull together charts, maps, and filters to display the full picture of your Elasticsearch data. From real-time threat monitoring displays to executive summaries showing key performance indicators, it’s easy to create beautiful dashboards in Kibana designed to facilitate decision making and action.
Ready to build a dashboard?
Try freeDive into the documentation, including a guide for creating your first dashboard.
Read docsLearn tips for using dashboard drilldowns.
Watch webinarBeautifully interactive
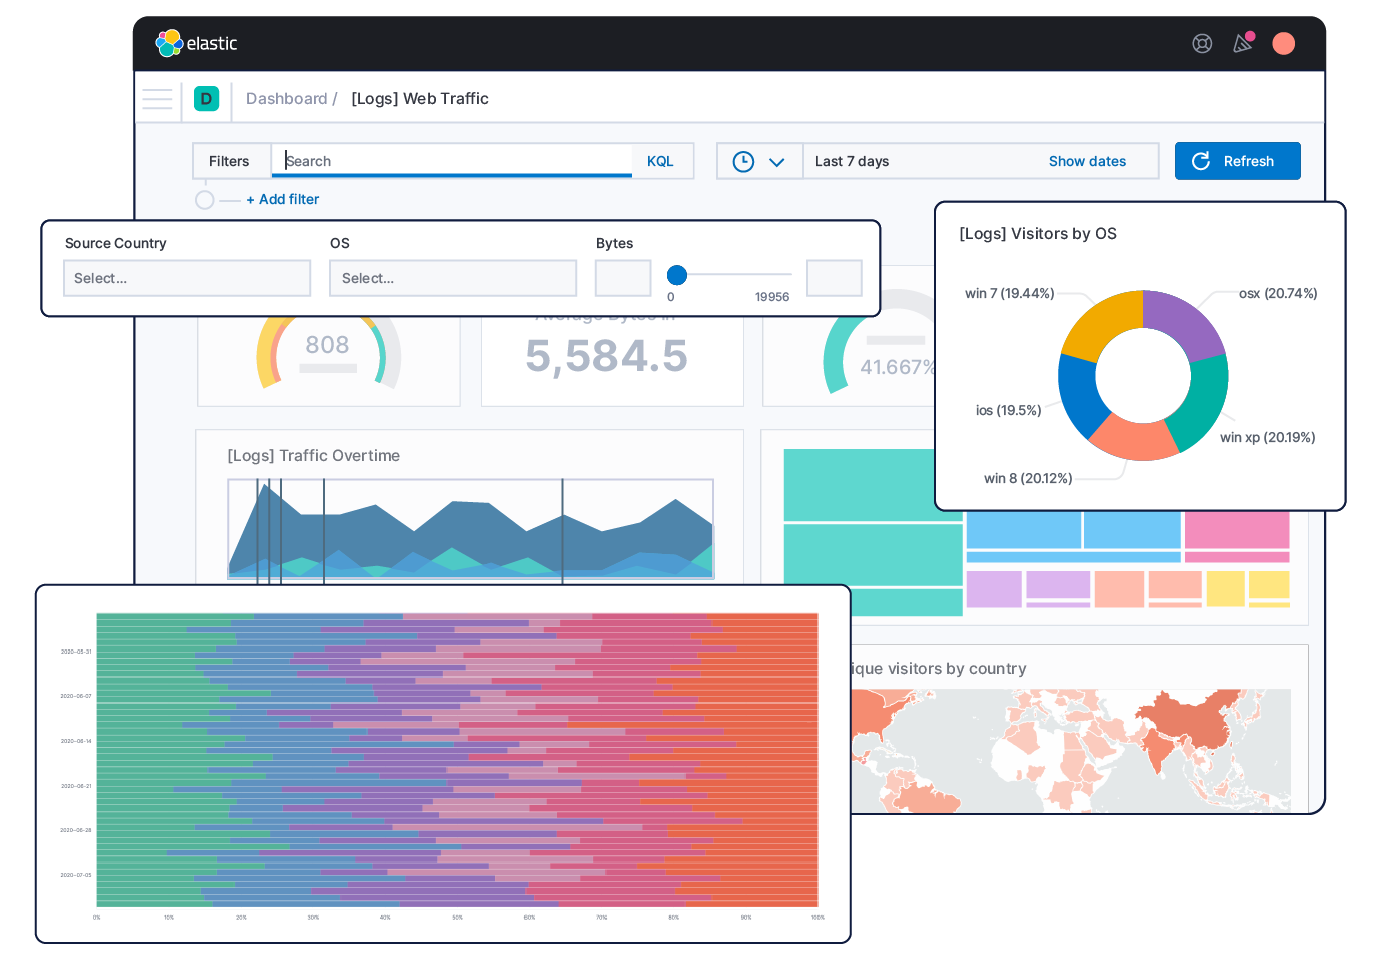
Begin building eye-catching Kibana dashboards in just a couple clicks. By default, every chart, graph, map, or table added to a dashboard is interactive to encourage data exploration. You can filter by time range or keywords with built-in controls.
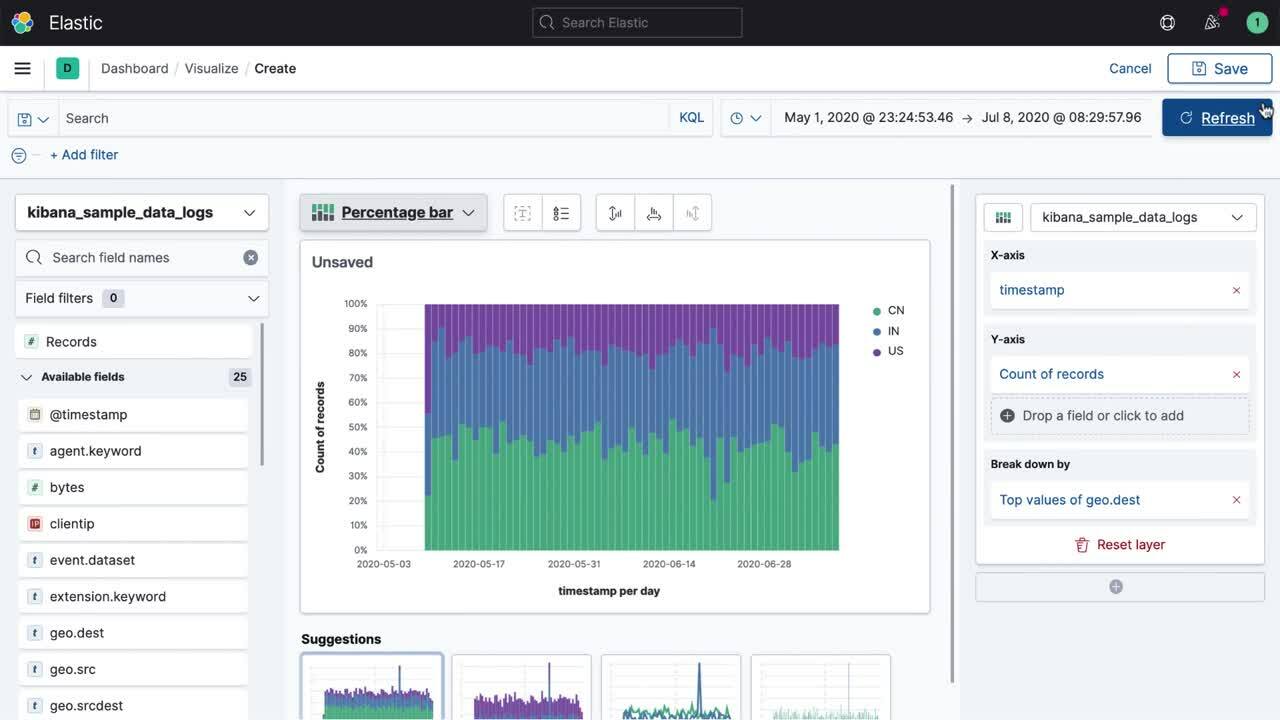
Your visualization starting point
Every good data question needs a place to start. Dashboards in Kibana make it easy to begin exploring Elasticsearch data and then seamlessly save the results. Want to iterate on something you’ve already built? It’s as simple as click and clone.
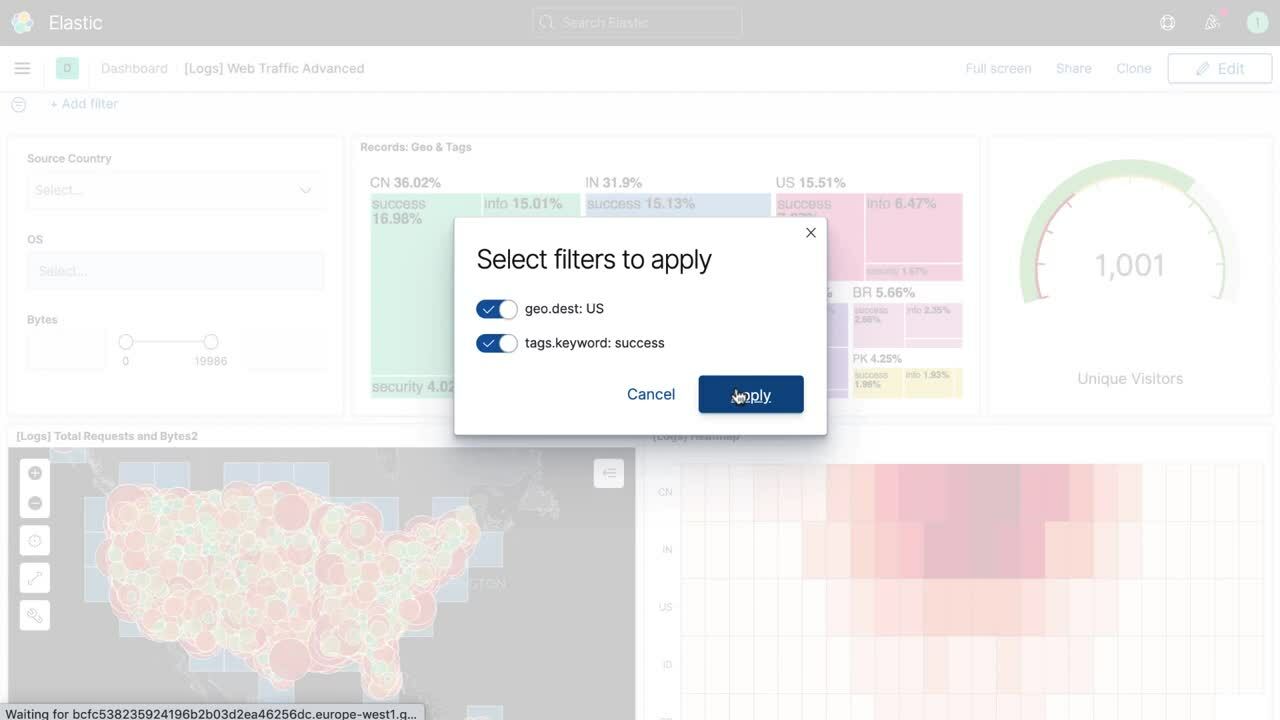
Drill into data
Kibana dashboards provide simple-to-use drilldown capabilities designed to help viewers dive deeper into any analysis. Pursue a line of investigation across multiple dashboards while staying in the flow. Go from a high-level executive summary all the way to a granular document‑level inspection.
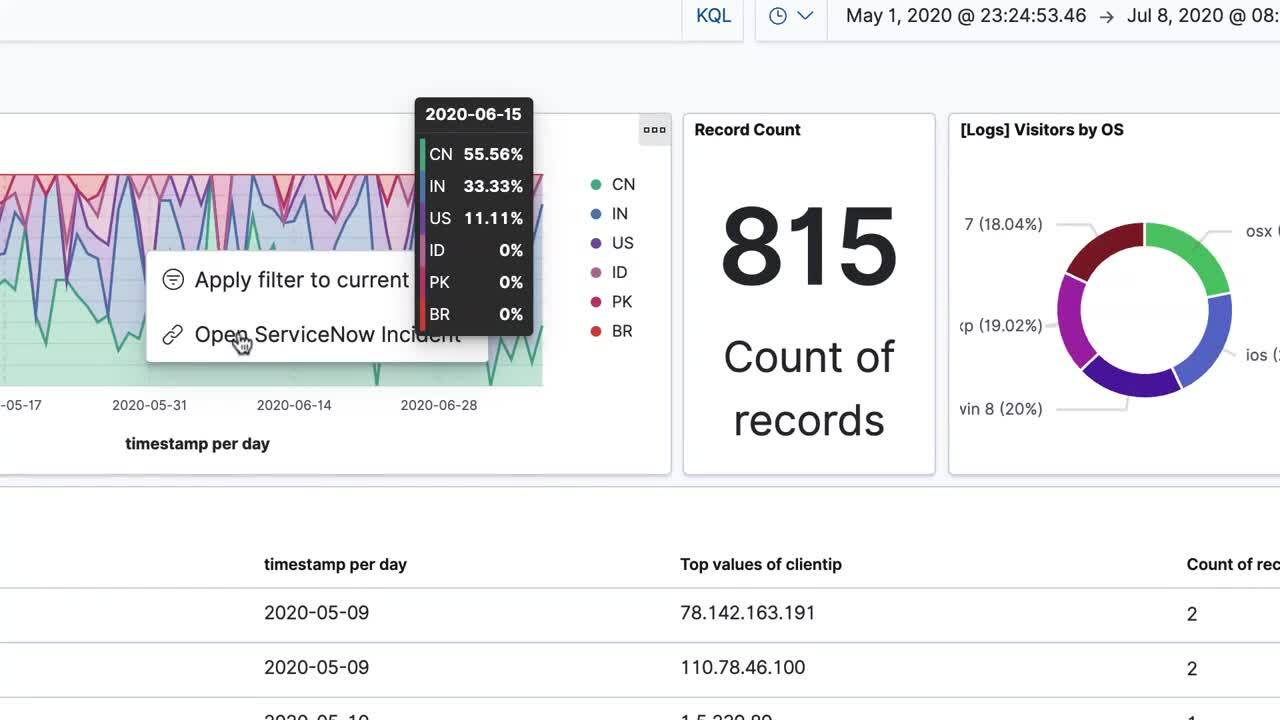
From data to decisive action
Dashboards are only as good as the results they drive. In Kibana, moving from insight to action happens smoothly with the ability to build drilldowns to any URL. Create a one-click experience in your security dashboard to open an incident ticket. Tap directly into IT workflow ticketing systems from your monitoring views to rapidly respond to urgent issues, degradations, and outages.