大規模な高カーディナリティ効率のために構築されたインフラ監視
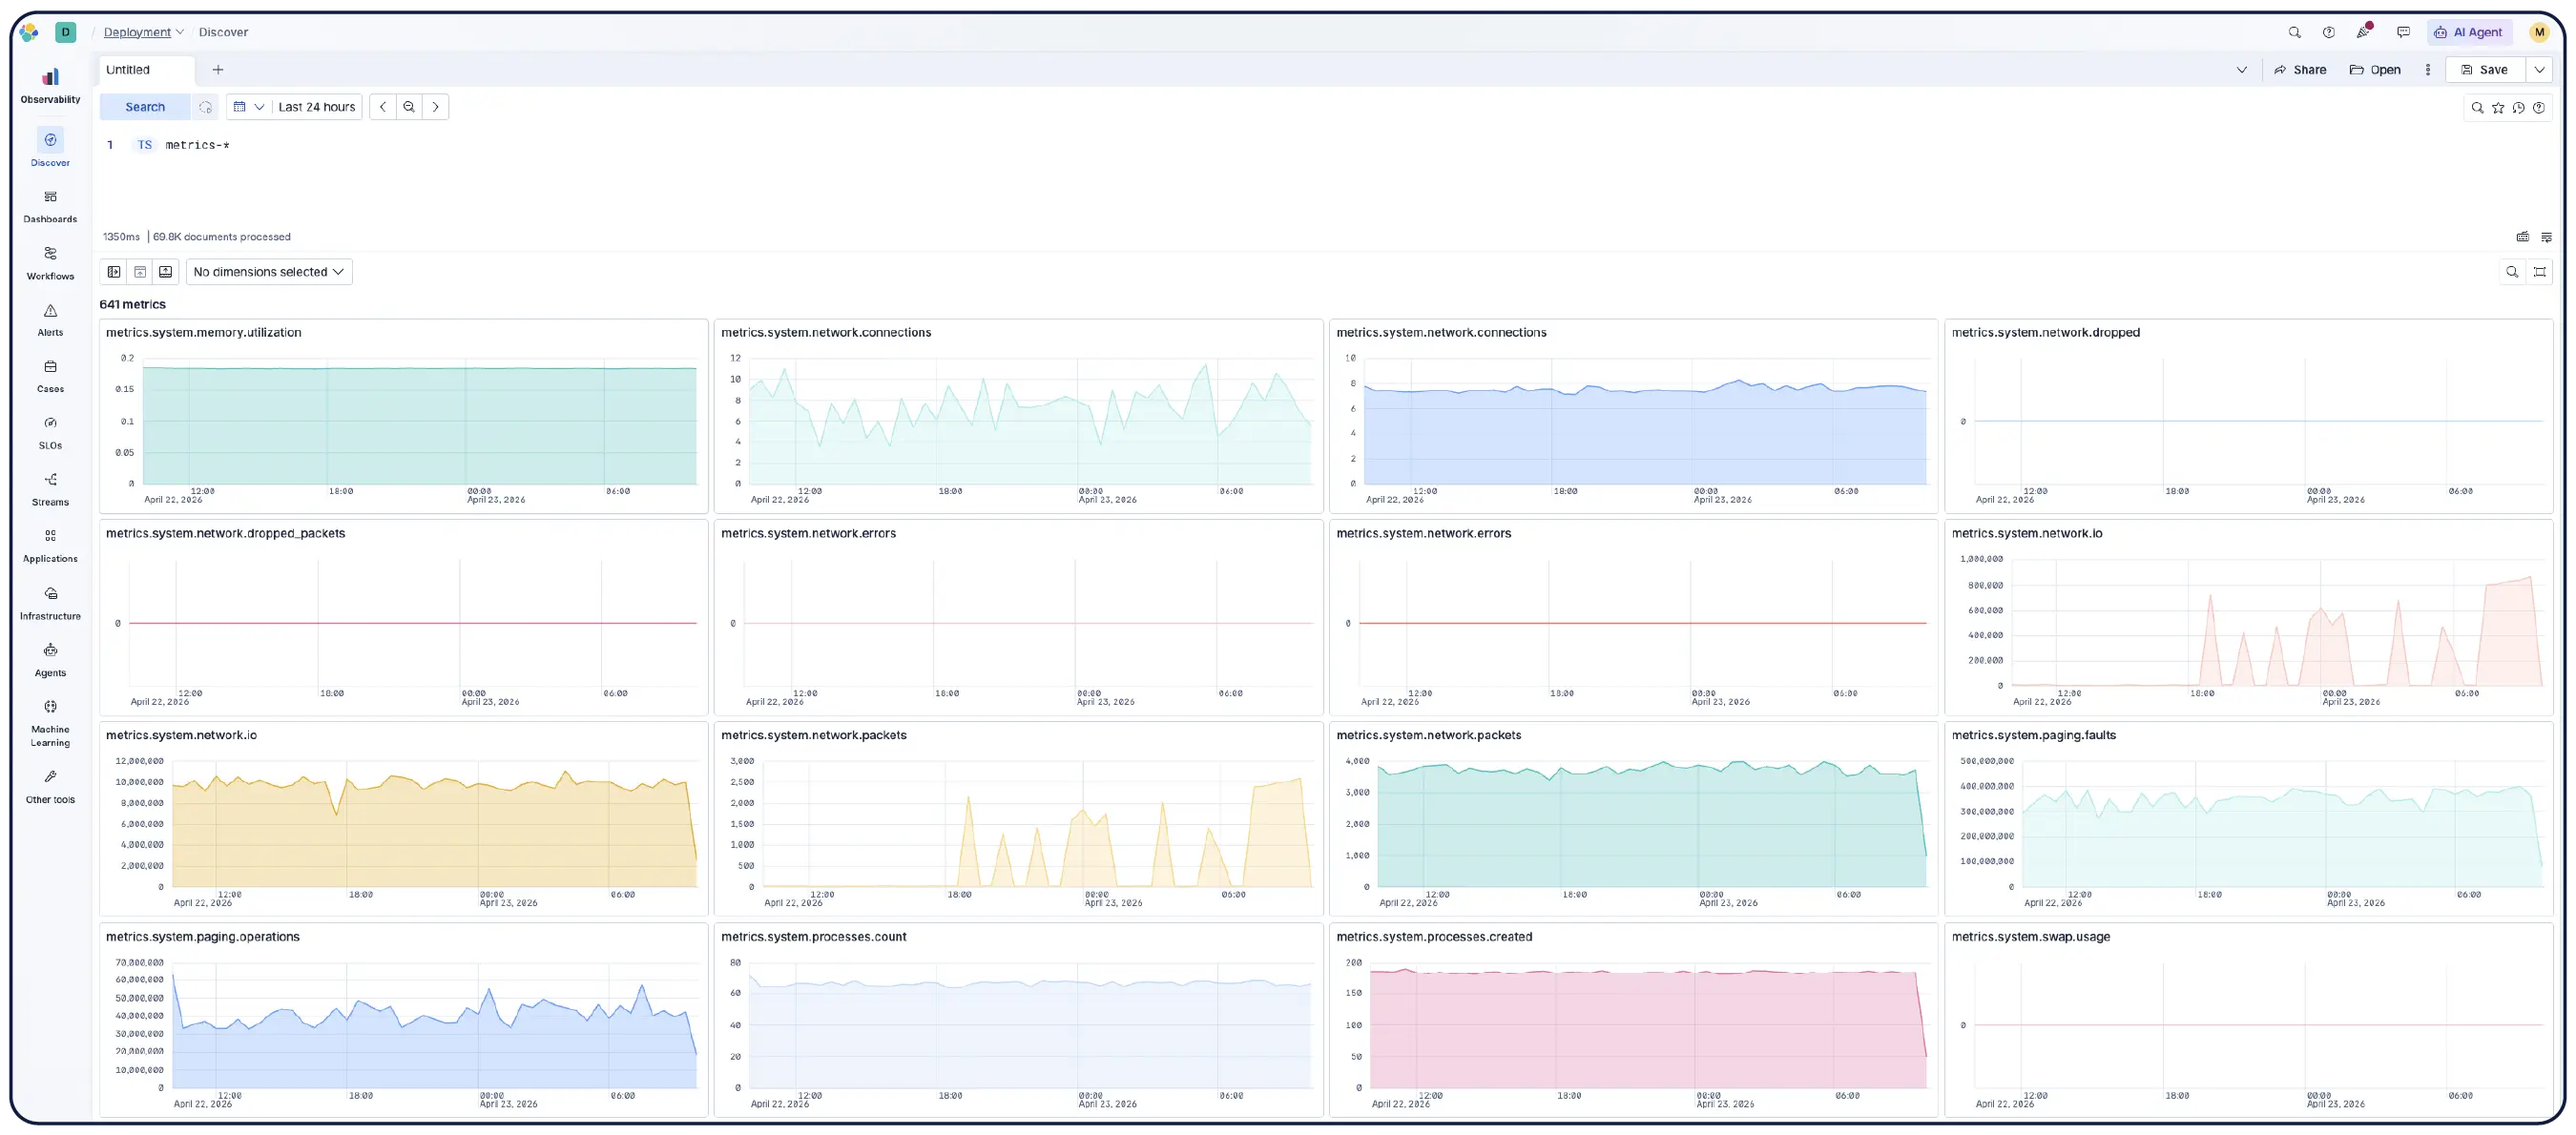
Elasticは、AIを活用してインフラのスタック全体にわたるオブザーバビリティを提供し、異常を検知し、根本原因を調査し、是正措置を自動化します。これにより、キャパシティの計画立案や問題の解決をより迅速に行うことが可能になります。また、カラム型ストレージにより、高いパフォーマンスを維持しつつ、コストを低く抑えることができます。


すでに利用中のすべての環境で豊富なAI機能を活用
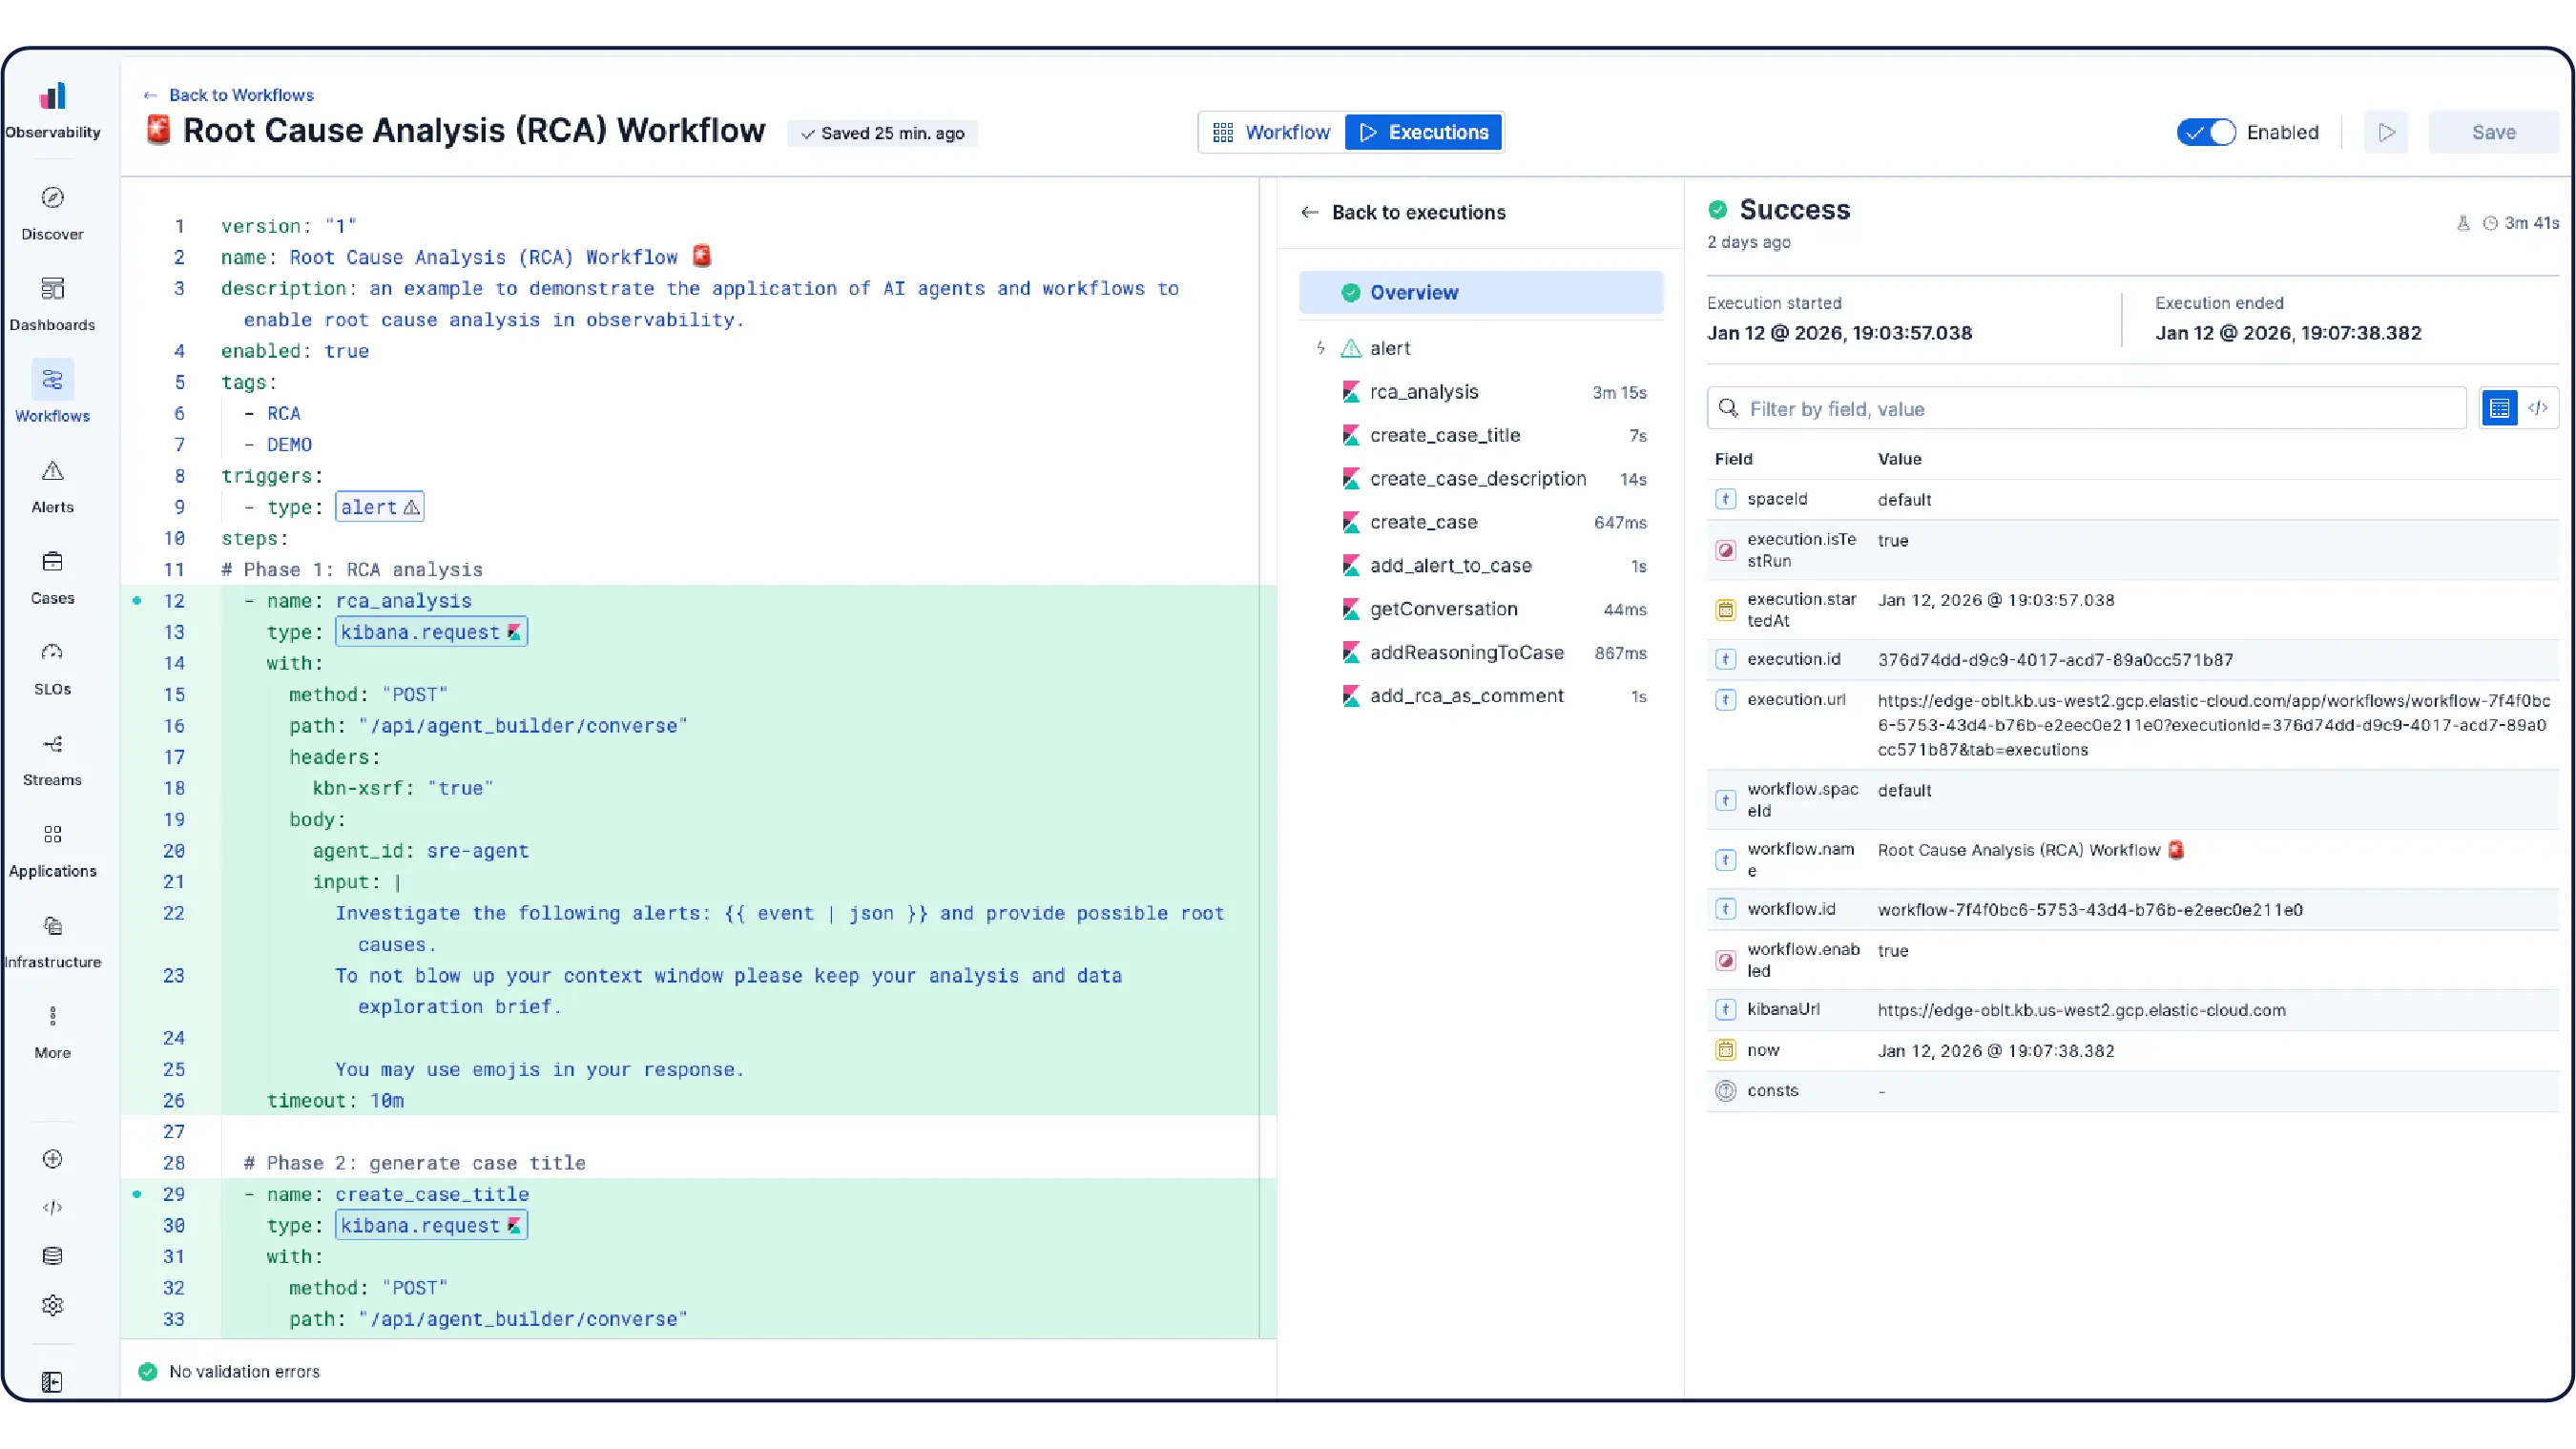
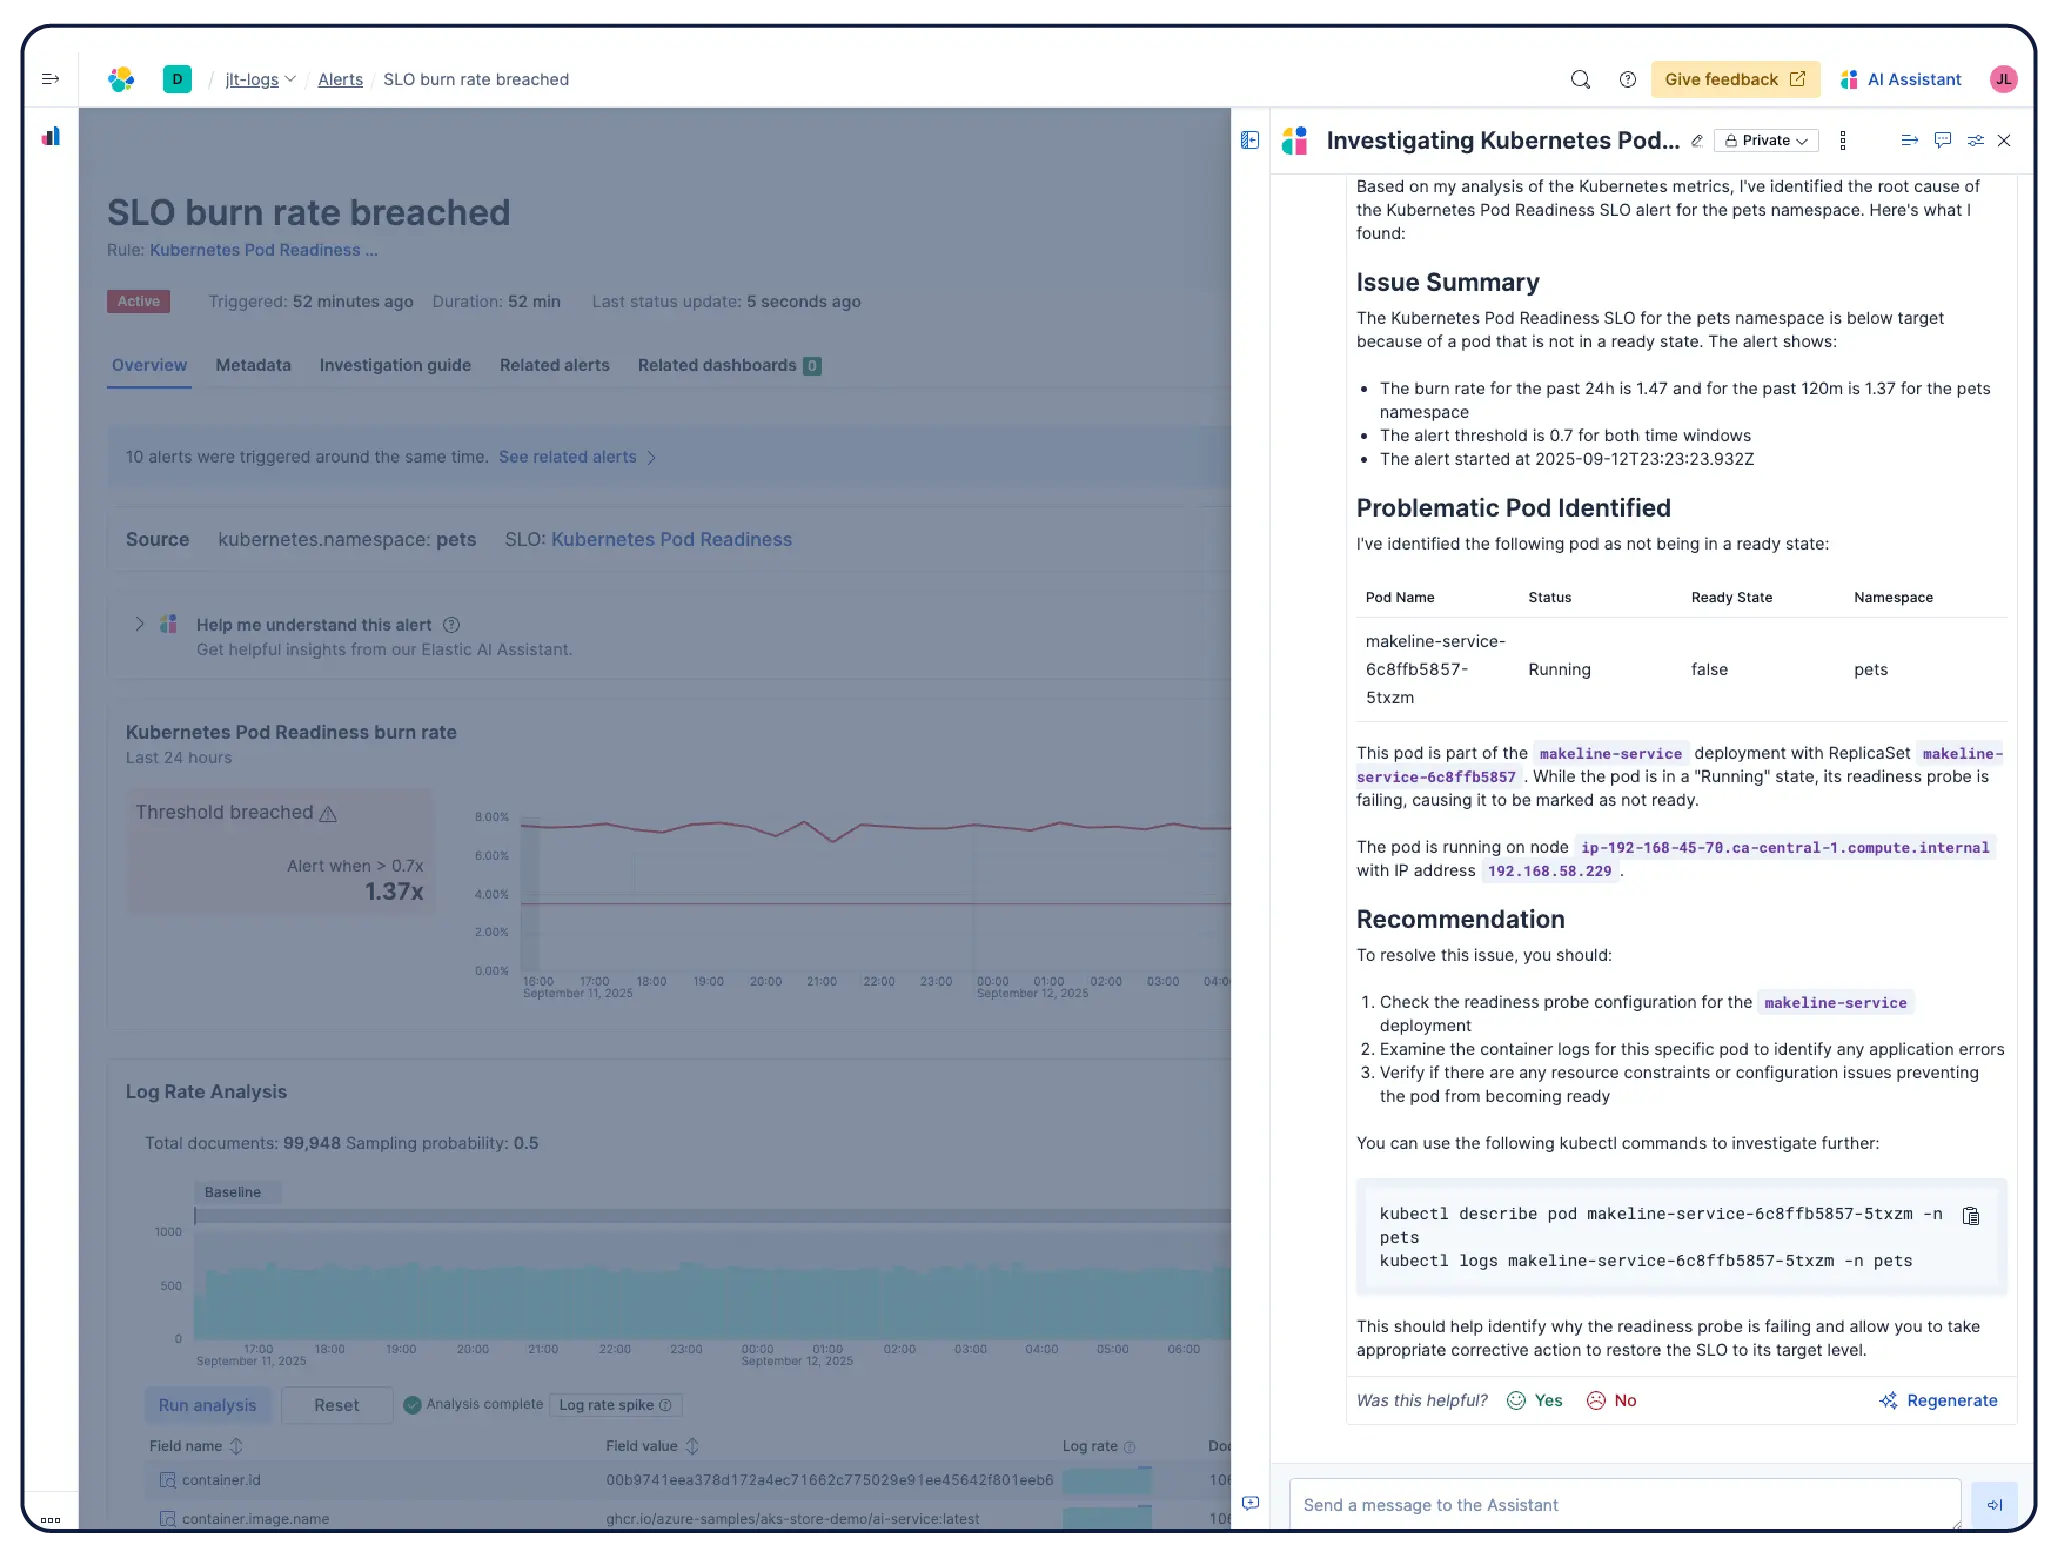
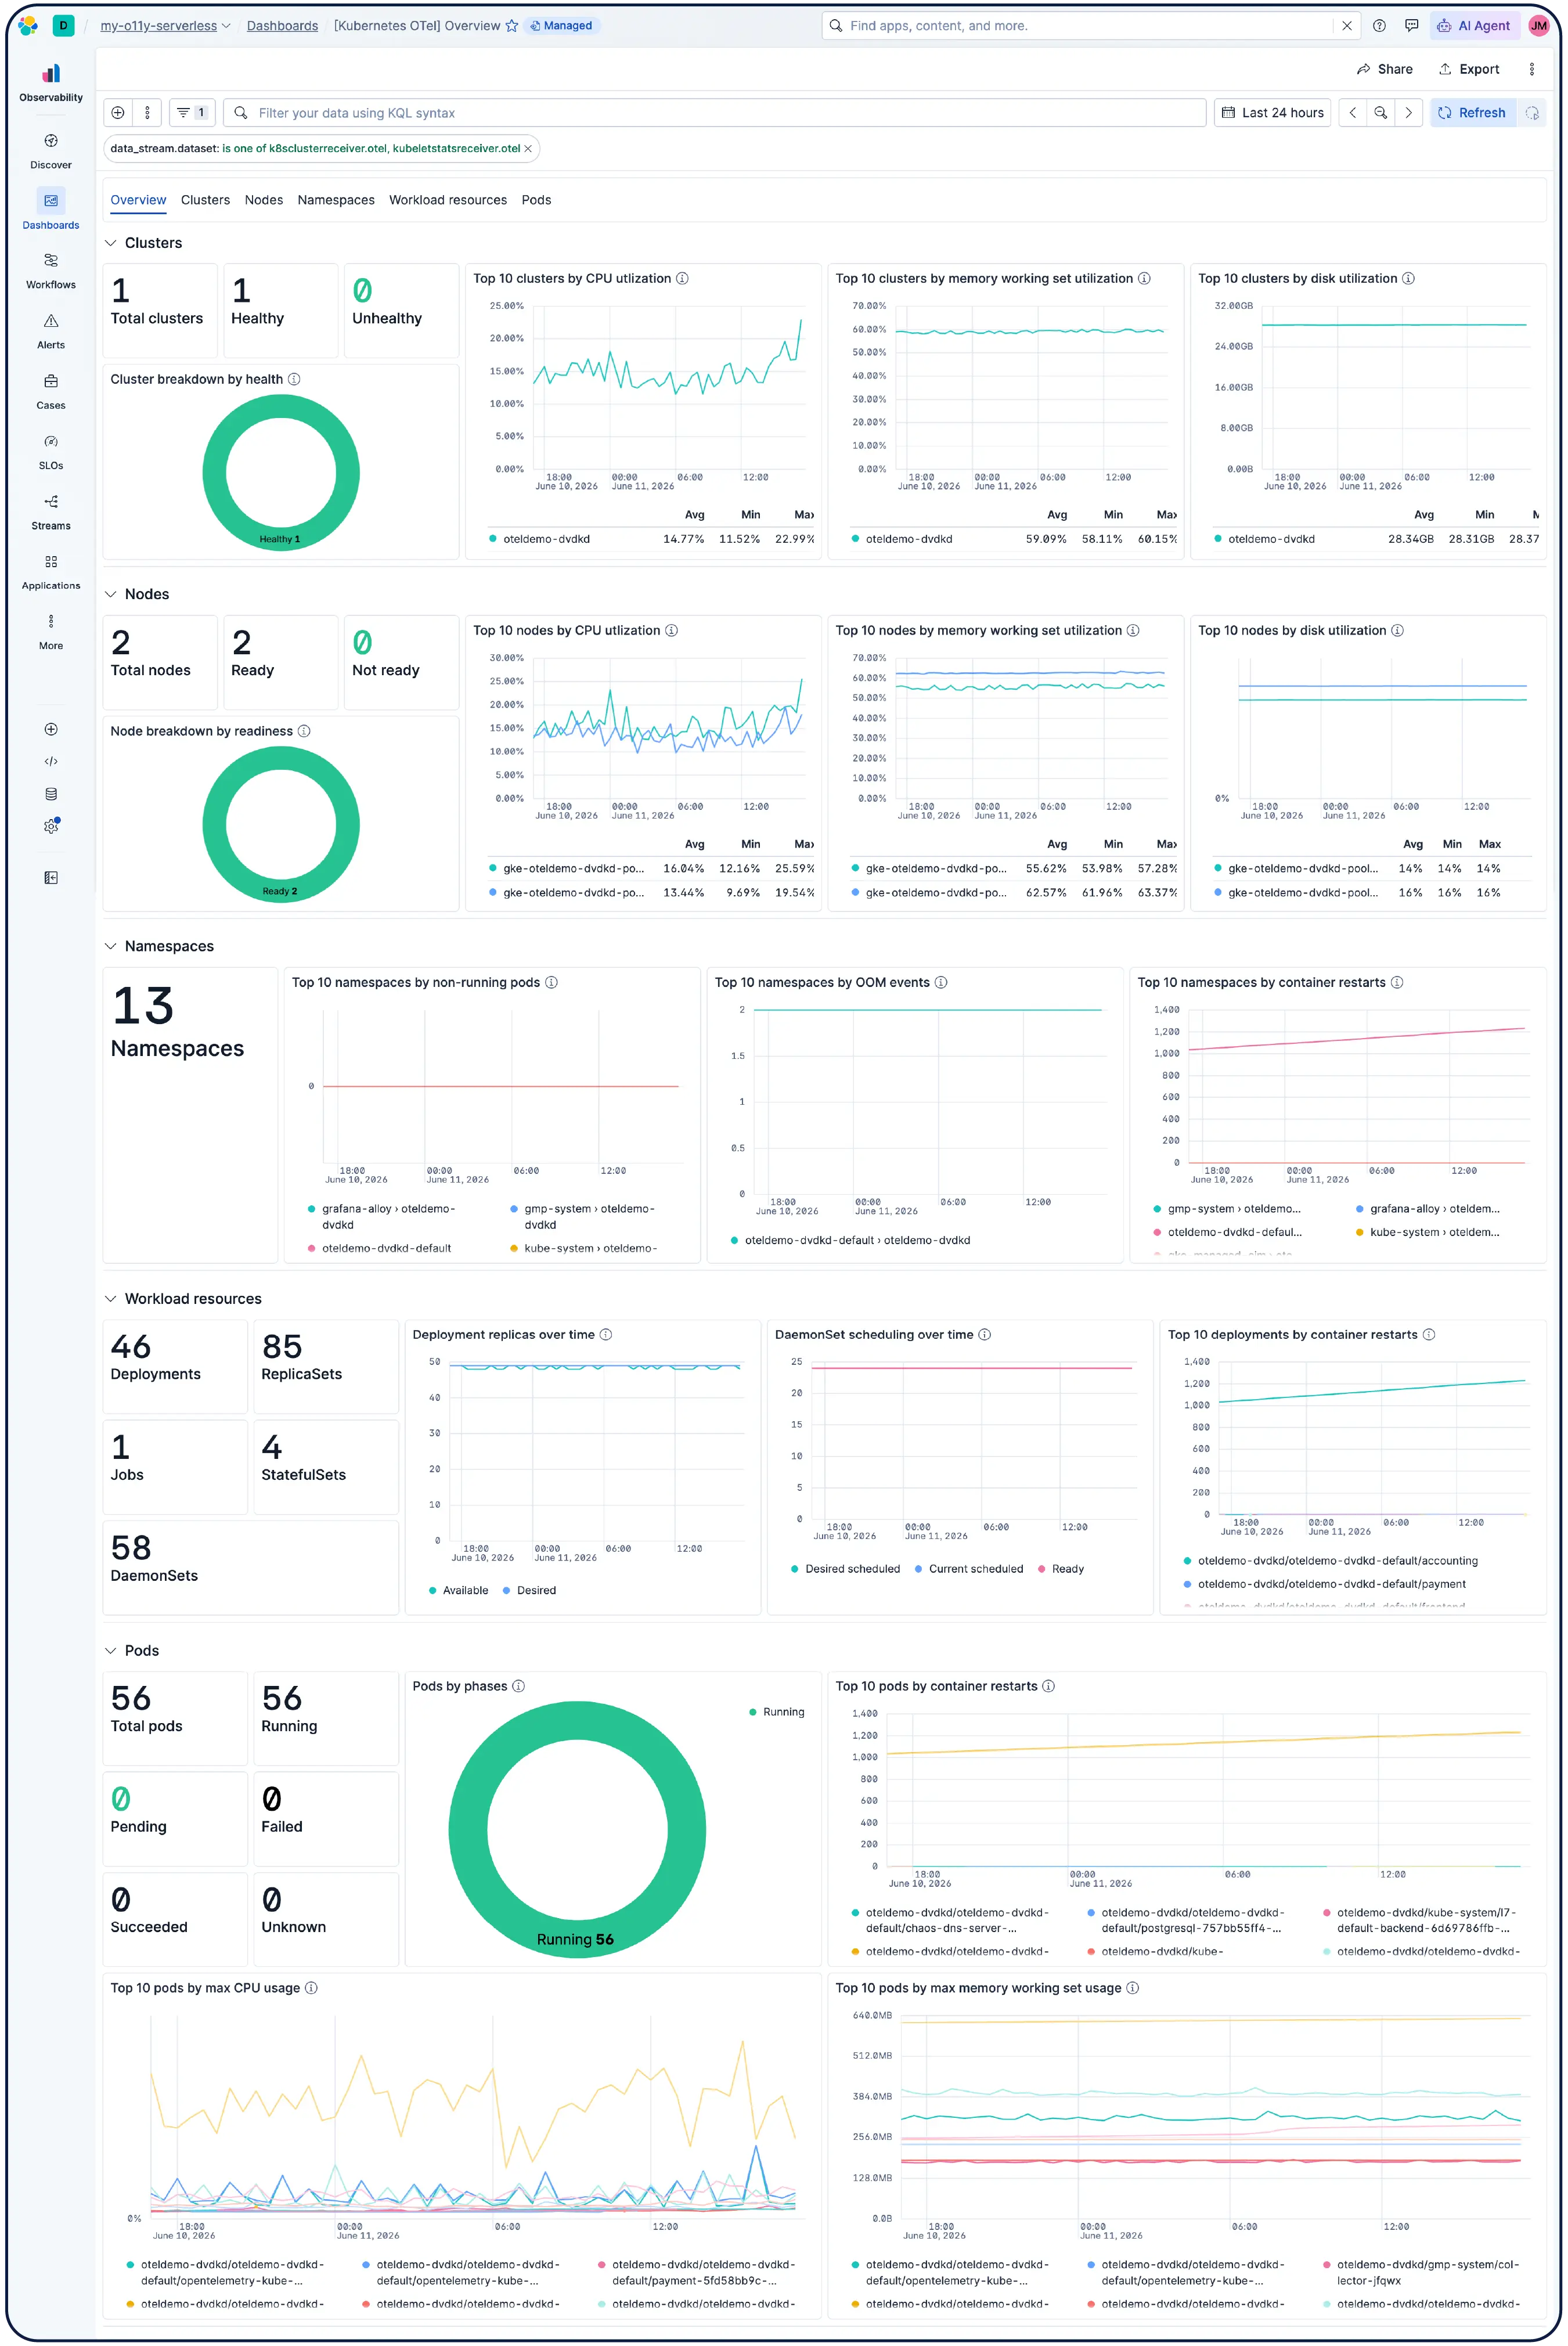
接続した瞬間からすぐに使えるセットアップが整っています。ElasticのKubernetesモニタリングには、事前設定済みのダッシュボード、アラート、SLO、機械学習ジョブが含まれており、エージェントスキルが利用可能で、健康監視、異常検知、インシデント調査、修復のためのMCPアプリも提供されています。

クラス最高の効率
パフォーマンスを低下させたりデータを損失したりすることなく、インフラを全面的に可視化し、豊富なログ分析をご利用いただけます。Elasticsearchのカラム型メトリクスエンジンは、取り込み、ストレージ、クエリ速度において、あらゆる規模で他のエンジンよりも優れています。
ElasticがElasticsearchを主要なカラム型メトリクスデータストアとして再構築した方法をご紹介します。ベンチマークを見る。
スキーマ非依存型
1つのデータストア、すべてのフォーマット、コンテキスト切り替えなし
ほとんどのインフラストラクチャ監視スタックでは、すべてを単一のスキーマに正規化するか、複数のバックエンドやクエリ言語を行き来しなければなりません。しかし、Elasticは違います。OpenTelemetry、Prometheus、Beats、その他の形式を送っても、Elasticsearchはそれぞれを統一されたデータストアにネイティブに保存し、そのままクエリを行います。変換レイヤーや情報損失が無く、手作業での切り替えが多く伴う調査もありません。
インフラストラクチャーに焦点を
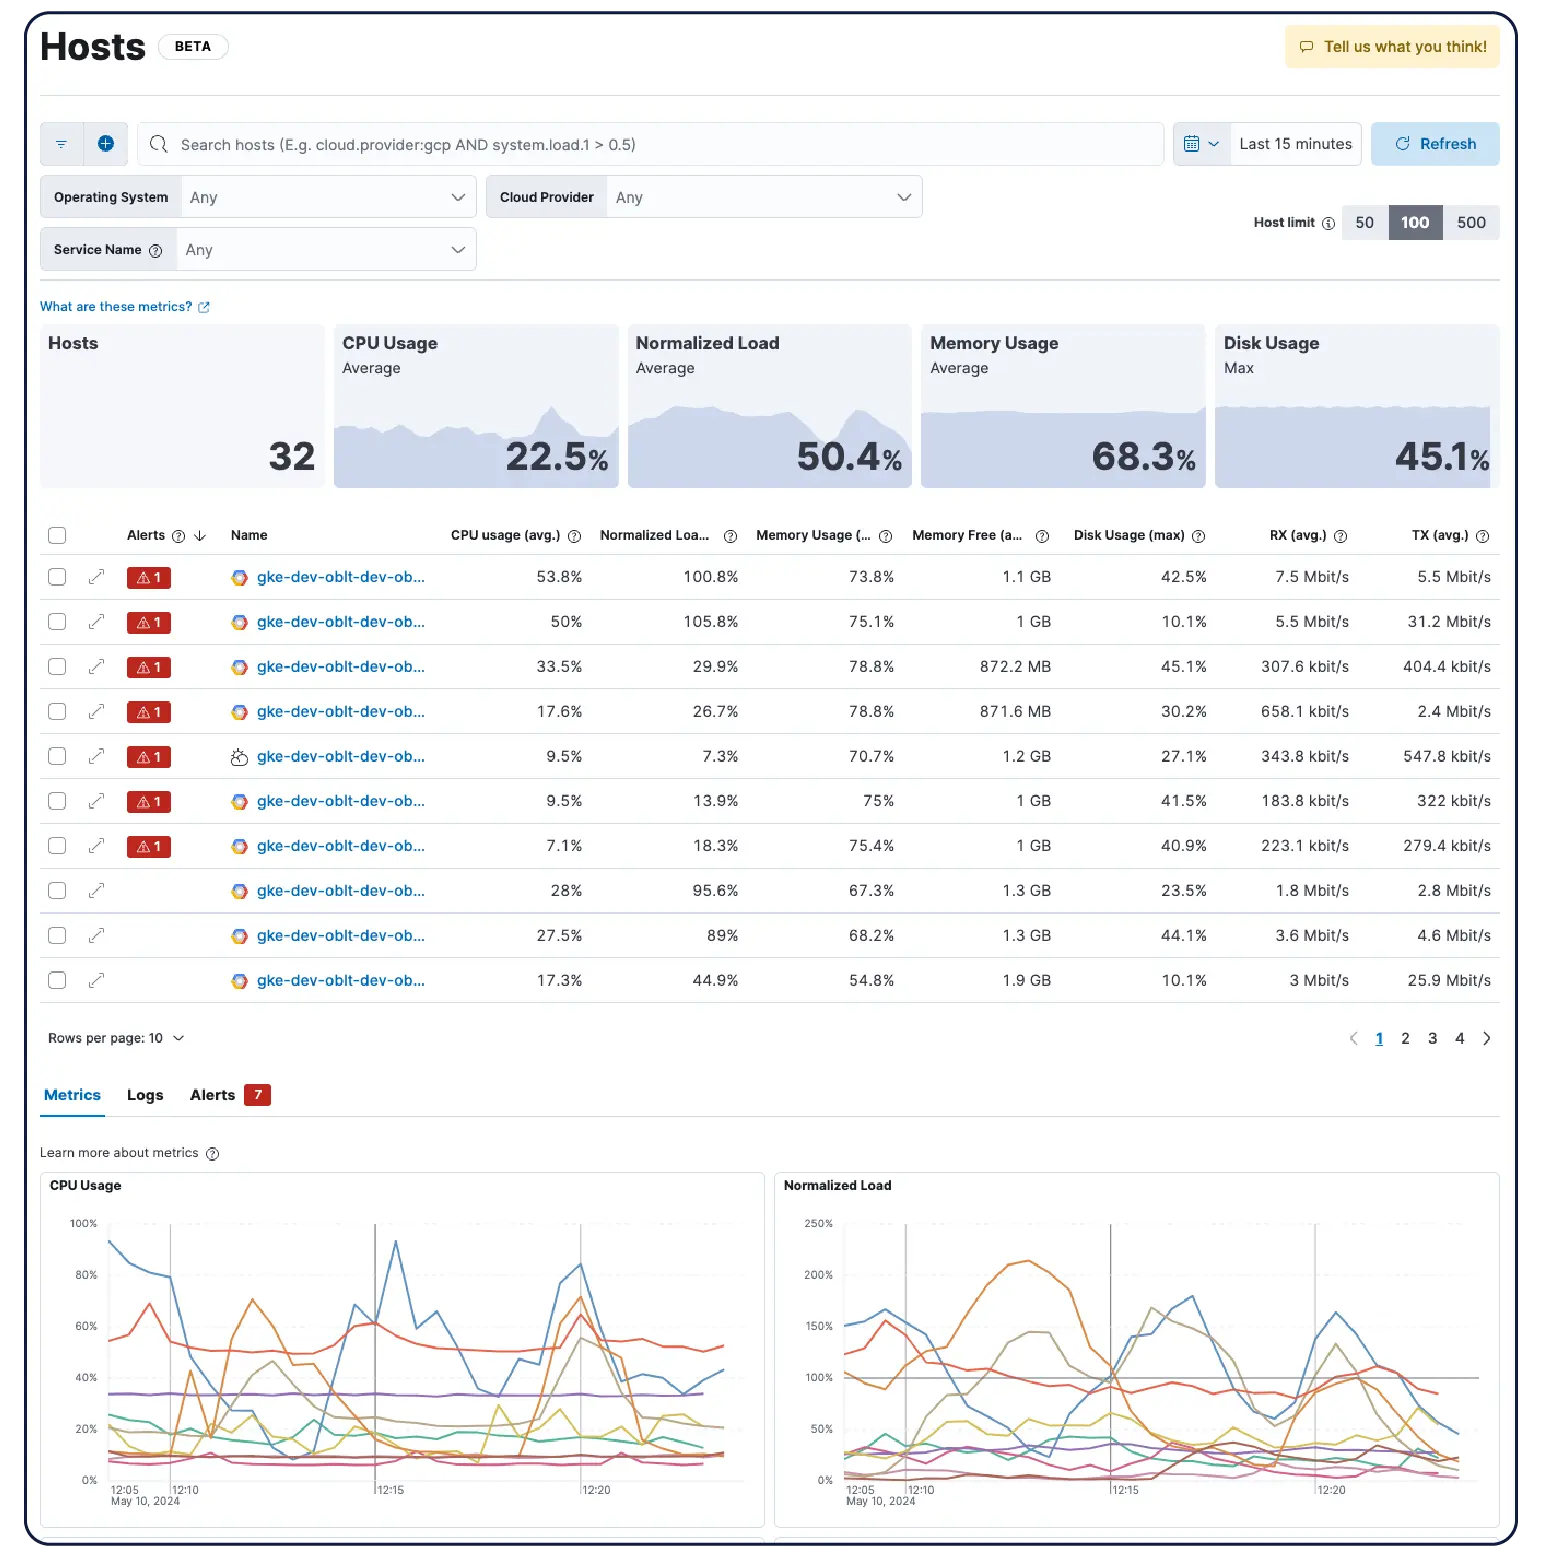
Kubernetesクラスター、VM、クラウド、オンプレミスサーバーのいずれを運用していても、550以上の事前構築済み統合、軽量エージェント、およびエージェントレスコレクターにより、AWS、Azure、GCPのデータ取り込みをスムーズに行えます。
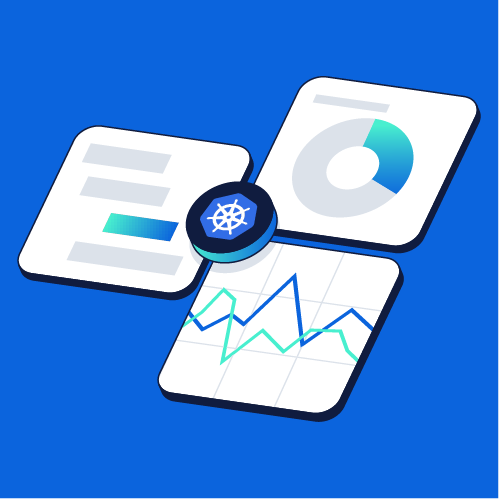
Discoverでデータを検索、フィルタリング、集計、可視化。セッションをダッシュボードに保存し、アラートを設定し、あらゆるデータに対してES|QLクエリを実行し、統合分析を行います。あらゆるディメンションのあらゆる指標でフィルタリングし、KibanaでPromQLを実行できます。
同業他社がElastic Observabilityを選ぶ理由をご覧ください
お客様事例

ComcastはElasticを使用して毎日400テラバイトのデータを取り込み、サービスの監視と根本原因分析の迅速化を実現し、最高水準の顧客体験を提供しています。
お客様事例

ズープラスでは、Elasticを活用して、2,500のマイクロサービス、20,000のコンテナ、70のAWSサービスを含む600のAWSアカウント、および40のKubernetesクラスターを監視しています。
お客様事例

Informaticaは、100を超えるアプリケーションと300を超えるKubernetesクラスターのログワークロード全体をElasticに移行することで、コストを削減し、MTTRを短縮しました。
チャットに参加
Elasticのグローバルコミュニティとつながり、オープンな会話やコラボレーションに参加しましょう。


.jpg)

よくあるご質問
インフラ監視とは何ですか?
インフラ監視とは何ですか?
インフラ監視は、アプリケーションが実行されるシステム(ウェブサーバー、コンテナ、クラウドインスタンス、ネットワークデバイス、キャッシュ、キュー、データベース、ストレージなど)の健全性とパフォーマンスを追跡します。CPU使用率、メモリ消費量、ディスクI/O、ポッドの再起動などのメトリクスを収集し、チームがリソースの飽和を検出し、障害がエスカレートする前に捕捉し、インフラの状態がアプリケーションの動作にどのように影響するかを理解できるようにします。効果的なインフラ監視は、これらのメトリクスをログやトレースと相関させ、エンジニアが「このホストが飽和状態に近づいている」という情報から根本原因へと、ツールを切り替えることなく移動できるようにします。
Elasticはインフラストラクチャをどのように監視していますか?
Elasticはインフラストラクチャをどのように監視していますか?
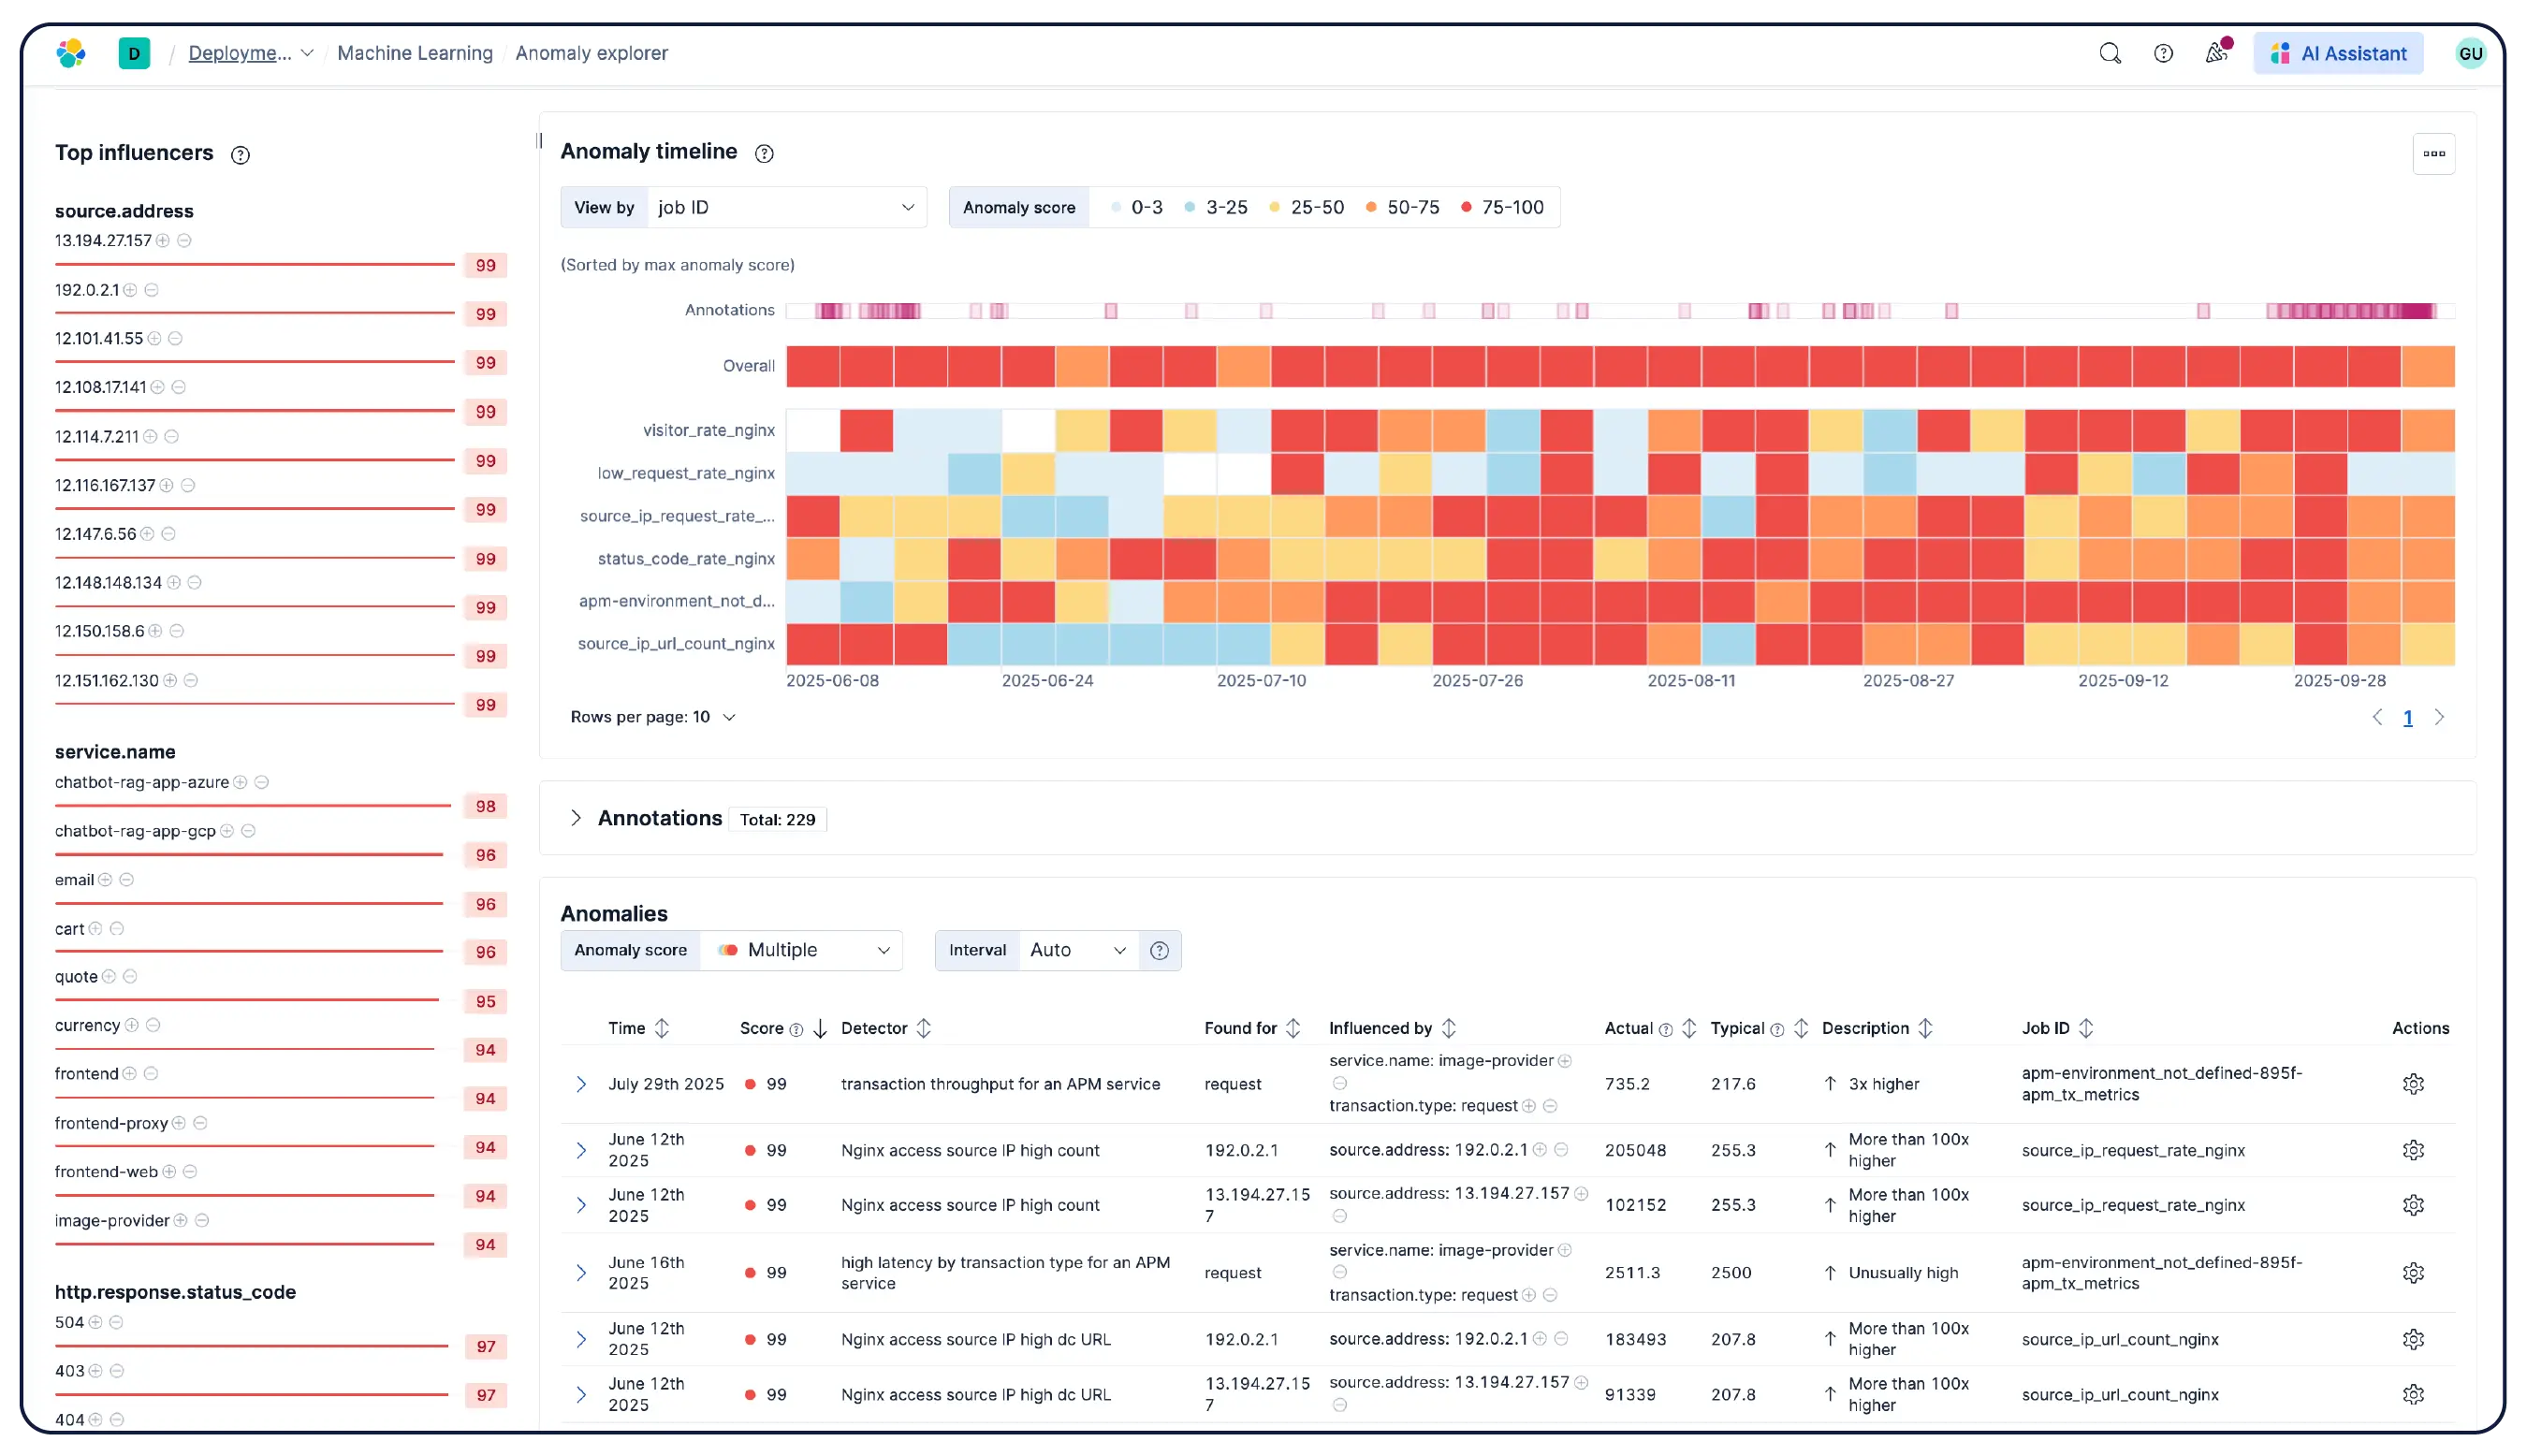
Elastic Observabilityは、ホスト、コンテナ、クラウドサービス、Kubernetesクラスターからメトリクス、ログ、トレースを収集し、それらをElasticsearchで相関させて、チームがすべてのシグナルを1か所で調査できるようにします。Elasticは、クラウド、オンプレミス、Kubernetes、サーバーレス、およびホスト全体の可視性を提供し、またすぐに利用開始できる550種類以上の統合とネイティブなOpenTelemetryサポートを提供します。Elastic AgentはFleetを介して収集を一元的に処理し、ホストごとのエージェント設定は不要です。機械学習ベースの異常検知により、異常な使用パターンを自動的に検出します。インフラのメトリックはアプリケーションのトレースやログと近い場所に保存されるため、エンジニアはプラットフォームを離れることなく、アラートから関連するコンテキストに直接切り替えることができます。
ElasticはKubernetes監視をサポートしていますか?
ElasticはKubernetes監視をサポートしていますか?
はい。Elastic Observabilityは、EKS、AKS、GKEのマネージドクラスターやセルフマネージドクラスターを含むKubernetes環境を監視するために構築されています。Elasticは、動的なKubernetesワークロードの変化を自動検出し、実行場所を問わずサービスとコンポーネントを監視します。取り込み時にメタデータが強化されるため、システム全体の共通属性をフィルタリング、追跡、識別できます。ポッドがスピンアップおよびスピンダウンしても、Elasticは手動で再構成しなくても対応します。クラスターリソースの使用状況、ポッドレベルのログ、アプリケーショントレース、インフラのメトリクスはすべて1つの導入によって収集され、Kibanaで相互に関連付けられます。異常検知とログの分類により、探す必要性すら認識していなかった問題を明らかにします。
Elasticはどのデータ形式をサポートしていますか?
Elasticはどのデータ形式をサポートしていますか?
Elastic Observabilityは、オープンスタンダードを基盤として構築されています。スキーマ変換や独自の変換を行うことなく、OpenTelemetry Protocol(OTLP)—ログ、メトリクス、トレース—をネイティブに取り込むことができます。 EDOT(Elastic Distributions ofOpenTelemetry)は、本番環境ですぐに利用できるOTelネイティブのエコシステムを提供します。EDOT Collectorをインストールし、言語別SDKを使用して自動インストルメンテーションを有効にするだけで、OTelスキーマを変更することなく、データをElasticsearchに取り込むことができます。PrometheusのメトリクスとPromQLはネイティブでサポートされており、450以上のワンクリック統合により、クラウドプロバイダー、データベース、メッセージキュー、ネットワークデバイス、アプリケーションフレームワークを網羅しています。Elastic AgentとBeatsは、事実上すべての一般的なソースからの構造化および非構造化のログ形式を処理します。
Elasticはどのようにインフラ監視コストを削減するのでしょうか?
Elasticはどのようにインフラ監視コストを削減するのでしょうか?
Elasticは、ストレージ層とアーキテクチャ層の両方でオブザーバビリティのコストに対処します。Logsdbインデックスモードは、データの順序を最適化し、Synthetics _sourceを使用して重複を排除し、圧縮を改善することで、ログストレージの必要性を最大65%削減できます。メトリクスに関しては、時系列データストリーム(TSDS)がカラム型ストレージと時系列固有のコーデック(デルタオブデルタ、ランレングスエンコード、XORエンコード)を使用することで、Kubernetes、AWS、Nginxなどの統合全体でメトリクスのディスク容量を最大70%削減します。Elastic Cloud Serverlessを使用するチームの場合、クラウドネイティブのオブジェクトストレージが記録システムとなるため、すべてのデータはオブジェクトストレージの経済性で格納され、階層や容量計画は不要です。
Elasticのメトリクスの価格設定は競合他社と比べてどうですか?
Elasticのメトリクスの価格設定は競合他社と比べてどうですか?
Elastic Observabilityは、ホストごとの料金やハイウォーターマーク課金のない従量課金制を採用しています。一方、Datadogのホストごとの料金体系では、オートスケーリングイベントは月全体の最大ノード数に基づいて課金され、平均使用量は考慮されません。カスタムメトリクスには追加料金がかかり、平均請求額の最大52%を占める場合があります。Elasticのモデルでは、一時的なワークロードや高カーディナリティのPrometheus環境でも、月末に予期せぬ料金が発生することはありません。