


Exploring Jaeger traces with Elastic APM
Jaeger is a popular distributed tracing project hosted by the Cloud Native Computing Foundation (CNCF). In the Elastic APM 7.6.0 release we added support for ingesting Jaeger traces directly into the Elastic Stack.
Elasticsearch has long been a primary storage backend for Jaeger. Due to its fast search capabilities and horizontal scalability, Elasticsearch makes an excellent choice for storing and searching trace data, along with other observability data such as logs, metrics, and uptime data. If Jaeger already supports storing traces in Elasticsearch, what is this new feature all about?
We extended the Elastic APM Server such that it can directly receive Jaeger trace data from jaeger-agent, making it wire-compatible with jaeger-collector. The Elastic APM Server translates the trace data it receives from Jaeger into the same format used to store trace data received from Elastic APM agents. The end result is that you can visualise and explore your Jaeger traces in the Elastic APM app in Kibana.
Sending Jaeger traces to the Elastic APM Server brings them into the Elastic Observability solution, which comes with some powerful integrations, including:
- Central configuration for managing sampling rates
- Index lifecycle management for managing Elasticsearch indices as they age
- Machine learning for automated anomaly detection
- Alerting and actions in Kibana (7.7+)
How to send Jaeger traces to Elastic APM
In the typical Jaeger architecture, your applications will be instrumented by a Jaeger client, which sends data to a (typically host-local) jaeger-agent, and from there to a centralised jaeger-collector.
We’ll assume that you have already set up Elastic APM. To send your Jaeger traces to Elastic APM, you need to:
1. Configure APM Server, enabling the Jaeger gRPC endpoint:
apm-server.jaeger.grpc.enabled: true
apm-server.jaeger.grpc.host: ":14250"
2. Configure jaeger-agent via CLI flags, sending to Elastic APM Server with gRPC:
--reporter.grpc.host-port=apm-server:14250
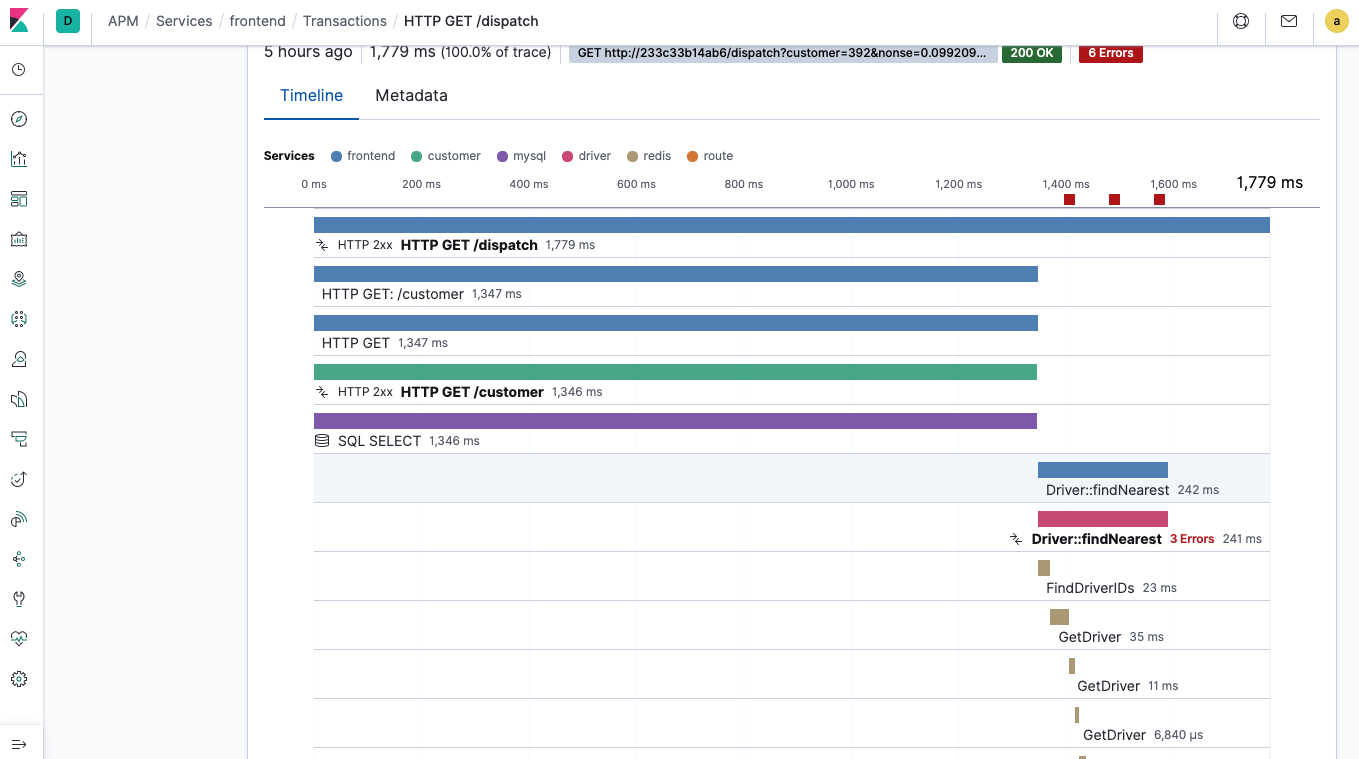
Soon you should see traces and errors showing up in the APM app in Kibana, like those from the Hot R.O.D. demo application shown below:
Configuring sampling in Kibana
Jaeger clients support various sampling configurations, for deciding whether or not to record a trace. One of the configuration options is “remote sampling”, whereby the client polls jaeger-agent for client configuration changes, including its sampling configuration. Jaeger-agent in turn queries jaeger-collector for centralised sampling configurations, which can be defined in a JSON-encoded file.
Elastic APM Server implements the required API to serve sampling configuration, but with a twist: instead of defining sampling configuration in a file, sampling is defined using the same Agent configuration UI in Kibana that is used for configuring Elastic APM agents.
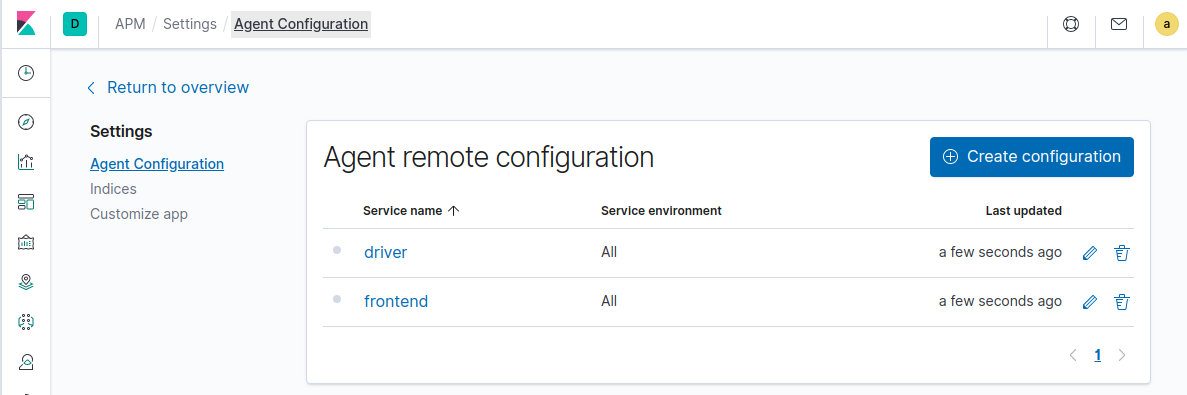
One important thing to bear in mind when configuring Jaeger sampling is that the transaction counts and rates will be scaled down by the configured sampling rate, unlike when using the Elastic APM agents. We are researching options to address this limitation – watch this space.
Securing communications with Elastic APM Server
Depending on your environment, you may wish to secure the communications between jaeger-agent and Elastic APM Server. There are two things you can do to secure communications: configure TLS and configure an “auth tag”.
TLS configuration
Jaeger-agent can be configured to use TLS when sending trace data via gRPC, both for server and for client authentication:
--reporter.grpc.tls.enabled=true
--reporter.grpc.tls.ca=<path/to/server/ca.pem>
--reporter.grpc.tls.cert=<path/to/client/cert.pem>
--reporter.grpc.tls.key=<path/to/client/key.pem>
Similarly, the Elastic APM Server can be configured to serve requests over TLS, and optionally to require clients to present valid certificates:
apm-server.ssl.enabled: true
apm-server.ssl.certificate: <path/to/server/cert.pem>
apm-server.ssl.key: <path/to/server/key.pem>
apm-server.ssl.certificate_authorities: [<path/to/client/ca.pem>]
By specifying apm-server.ssl.certificate_authorities, clients will be required to present a valid certificate in order to connect and send trace data to the Elastic APM Server.
Auth tag
As an addition or alternative to client certificate auth, we provide an “auth tag” feature that works with the existing secret token and API Key auth methods supported by Elastic APM Server and agents. The way this works is by configuring Elastic APM Server to specify the name of a special “Process tag”, which will be expected to hold the secret token or API Key:
apm-server.jaeger.grpc.auth_tag: “authorization”
You can then configure jaeger-agent to add the Process tag to all trace data that passes through it. The tag value format is either “Bearer
For example, if you configure API Key auth in Elastic APM Server, then you would add a CLI flag to jaeger-agent like:
--agent.tags=”authorization=APIKey cVQ0dHoyOEIxZzVDZ3dnMzVWJia3hPQQ==”
The server will require this tag to be present, and verify it before accepting any data from Jaeger. The auth tag will be excluded from documents recorded in Elasticsearch to avoid leaking secrets.
What’s next for Elastic APM and Jaeger?
Most of the pieces of this puzzle are in place now. There remain a few limitations, which will be addressed over time:
- Support for upscaling metrics to compensate for trace sampling in reported transaction rates/counts.
- Support for Jaeger on Elastic Cloud. Currently, Jaeger support is not available in Elastic Cloud.
- Support for W3C Trace Context headers in Jaeger (jaeger#855). Once this has been implemented, it will be possible to mix Jaeger and Elastic APM agents within a distributed application and obtain a complete distributed trace.
- Support for indexing logs in Elastic APM Server. Currently we extract errors from Jaeger span logs, and record those as error documents. We are now looking into additional support for ingesting and indexing arbitrary logs, which would pave the way for indexing Jaeger span logs.
If you don’t already have the Elastic Stack set up, try it for free today, and let us know what you think about the Jaeger integration on the Elastic APM forum.