How to troubleshoot slow Elasticsearch queries for better user experience


 Share on Twitter
Share on Twitter

 Share on LinkedIn
Share on LinkedIn

 Share on Facebook
Share on Facebook

 Share by Email
Share by Email

 Print this page
Print
For anyone using Elasticsearch® as their search engine, identifying and troubleshooting queries is a crucial skill to master. Be it ecommerce, observability, or workplace-oriented search solutions, a slow Elasticsearch will negatively impact your user’s experience.
To pinpoint slow Elasticsearch queries, you can use the slow log, which captures the query run at a certain threshold. Setting the slow log threshold correctly is a challenge in and of itself. For example, a query that takes 500 milliseconds under full load might be acceptable, but the same query under low load might be unacceptable. The slow log does not differentiate and logs everything above 500 milliseconds. Slow log does its job very well, so you can capture different levels of granularity depending on the threshold value. Tracing, instead, can look at all queries, identifying how many of your queries are within certain thresholds.
Application performance monitoring (APM) is no longer confined to just your application. Using instrumentation in Elasticsearch, we can now add Elasticsearch as a fully fledged service rather than a dependency on your application stack. This way, we get a more nuanced view of performance than the slow log can provide.
For the following example, our data corpus is the OpenWebText, which provides roughly 40GB of pure text and roughly 8 million individual documents that run locally on an M1 Max Macbook with 32GB RAM.
Getting started
Activating tracing in Elasticsearch is done with static settings (configured in the elasticsearch.yml) and dynamic settings, which can be toggled during runtime using a PUT _cluster/settings command, where one of those dynamic settings is the sampling rate. Some settings, like the sampling rate, can be toggled during the runtime. In the elasticsearch.yml we want to set the following:
Valid for Version 9.x
telemetry.agent.enabled: true
telemetry.agent.server_url: "url of the APM server"Valid for Version 7.x and 8.x
tracing.apm.enabled: true
tracing.apm.agent.server_url: "url of the APM server"The secret token (or API key) must be in the Elasticsearch keystore. The keystore tool should be available in <your elasticsearch install directory>/bin/elasticsearch-keystore using the following command for version 7.x and 8.x elasticsearch-keystore add tracing.apm.secret_token or tracing.apm.api_key. For version 9.x please use telemetry.secret_token or telemetry.api_key instead. After that, you need to restart Elasticsearch. More information on tracing can be found in our tracing document.
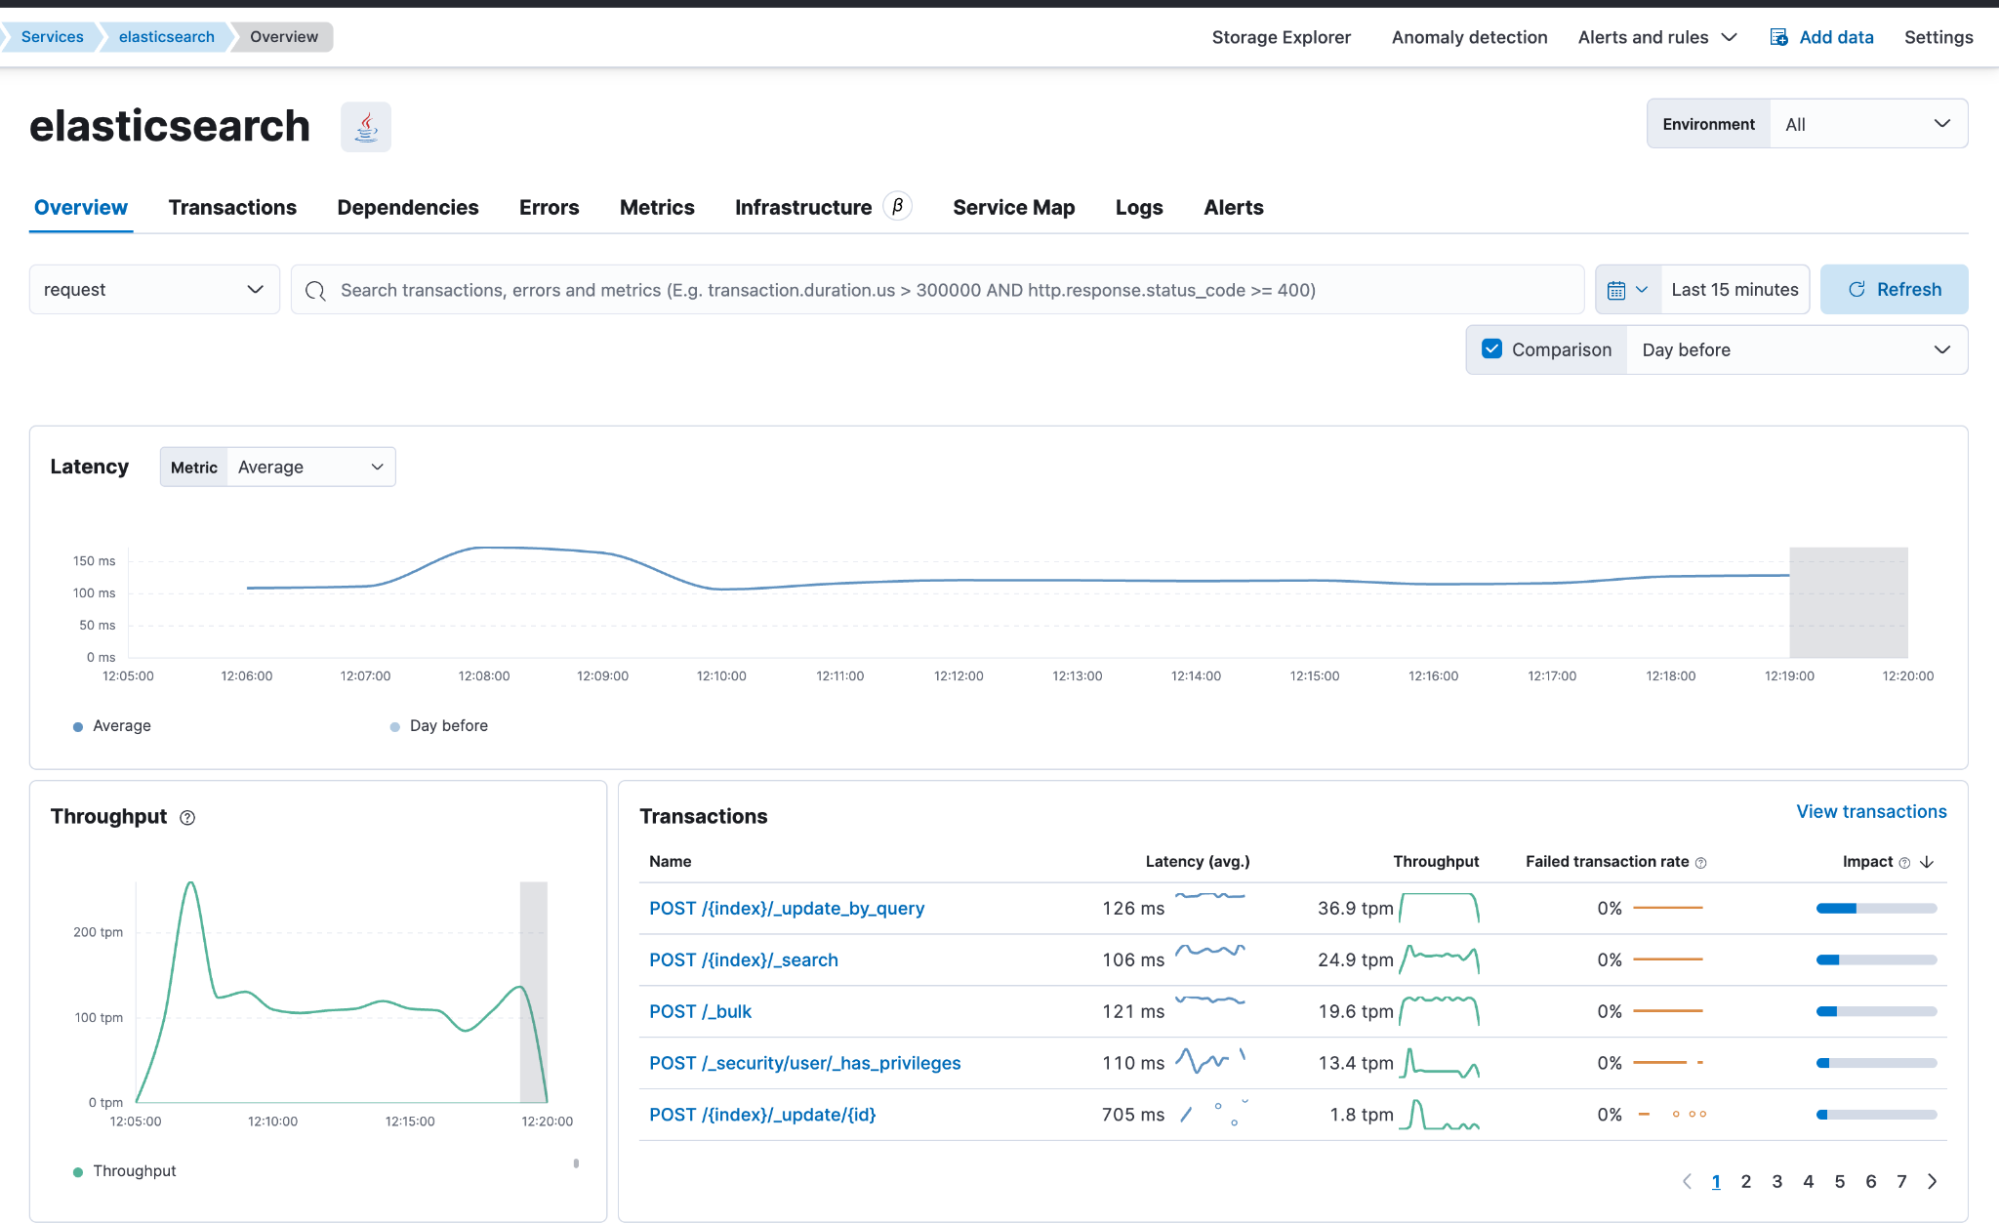
Once APM is active we can look at the APM view in Kibana and see that Elasticsearch captures various REST API endpoints automatically. Here, we focus mainly on the POST /{index}/_search calls and see what we can gain from it.
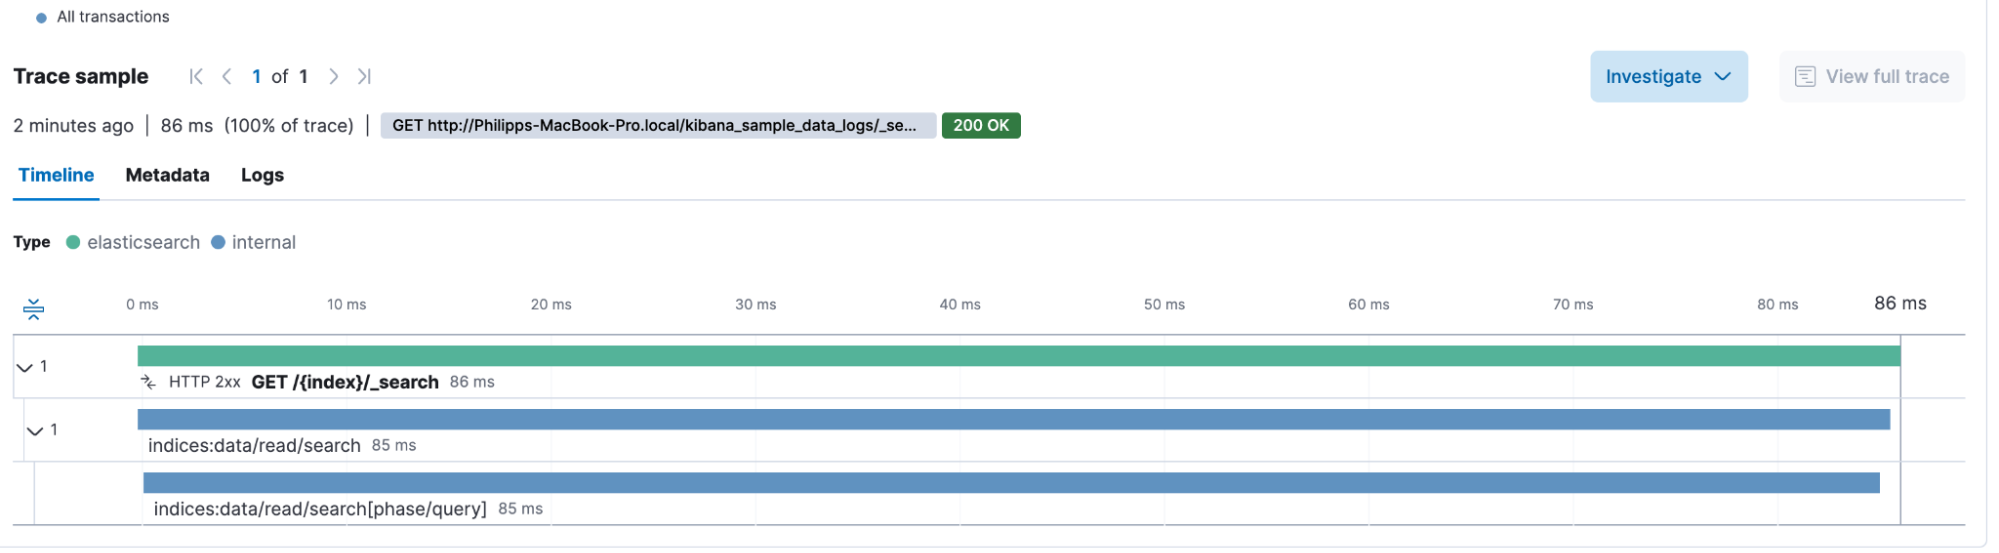
By examining a simple query directly on the GET /{index}/_search box, we see the following waterfall breakdown. This contains internal spans that provide deeper insights into what Elasticsearch is doing under the hood. And we see the overall duration of this search (86 milliseconds).
The metadata accompanying the query includes extensive information around the HTTP header, user agent, Elasticsearch node location (cloud provider metadata, hostname, container info), some system information, and URL details. Using some basic transaction information, we can create a Lens chart that plots the average transaction duration and allows us to see if there is an upward or downward trend.
Our search application
It is nice not needing to use slow logs anymore! I can determine the transaction duration and identify how many searches are answered beneath any threshold. However, there is one setback — Elasticsearch does not capture the query sent, so we know that a query took a long time, but we don’t know what the query was.
Let’s instrument a sample search application. In this case, we will use a simple Flask app with two routes, search_single and search_phrase, which will represent a match and a match_phrase query in Elasticsearch. For example, we could use the following queries:
{
  "query": {
    "match": {
      "content": "support"
    }
  }
}
And
{
  "query": {
    "match_phrase": {
      "content": "support protest"
    }
  }
}The following Flask code implements the search_single route. The search_phrase is very similar, except it uses match_phrase instead of match.
@app.route("/search_single", methods=["GET"])
def search_single():
    query = request.args.get("q", "")
    if not query.strip():
        return jsonify({"error": "No search query provided"}), 400
    try:
        result = es.search(
            index=ES_INDEX, query={"match": {"content": query}}
        )

        hits = result["hits"]["hits"]
        response = []
        for hit in hits:
            response.append(
                {
                    "score": hit["_score"],
                    "content": hit["_source"]["content"],
                }
            )

return jsonify(response)With all that prepared, I can now call curl -XGET "http://localhost:5000/search_single?q='microphone'" to search for the term microphone.
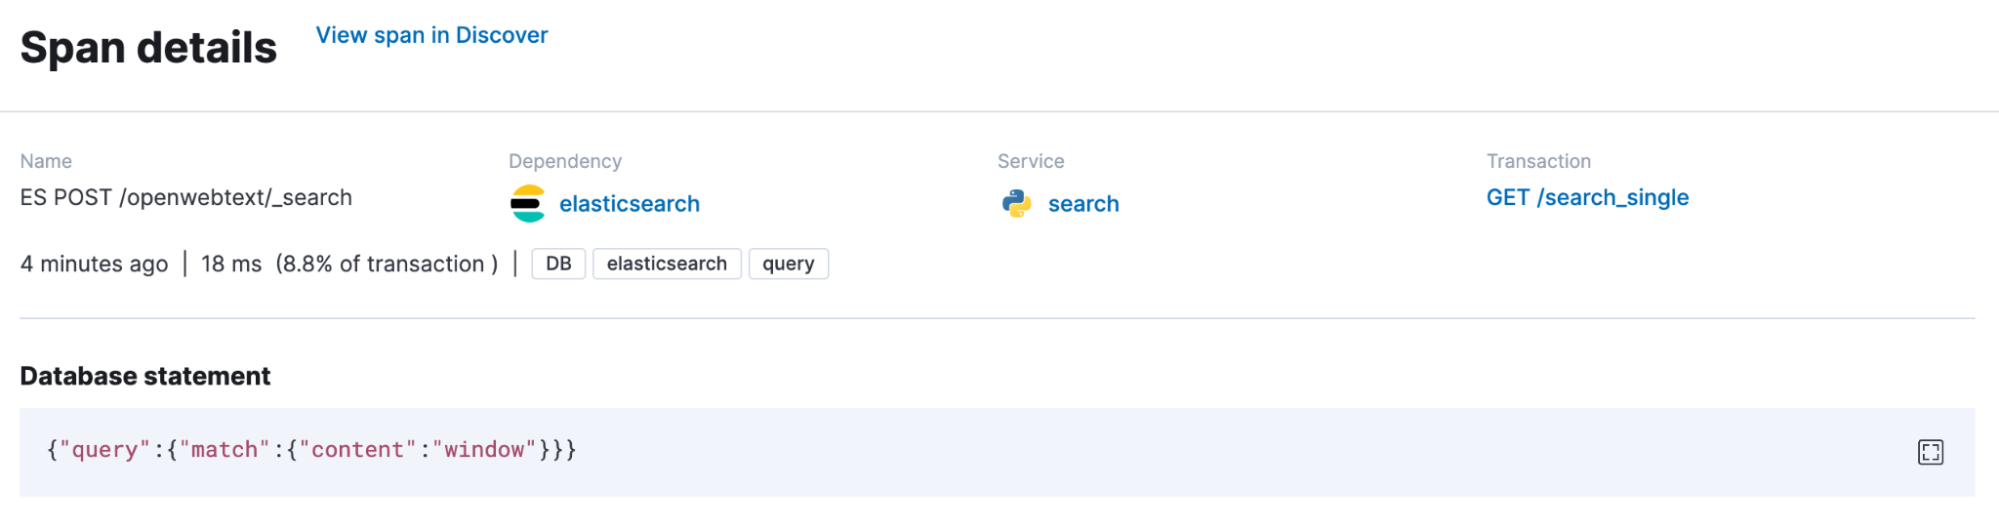
We mainly add APM to our search application to observe, but our APM agents capture outgoing requests and enrich them with metadata information. In our case, the span.db.statement contains the Elasticsearch query. And in this case below, someone searched for window.
Piecing it all together
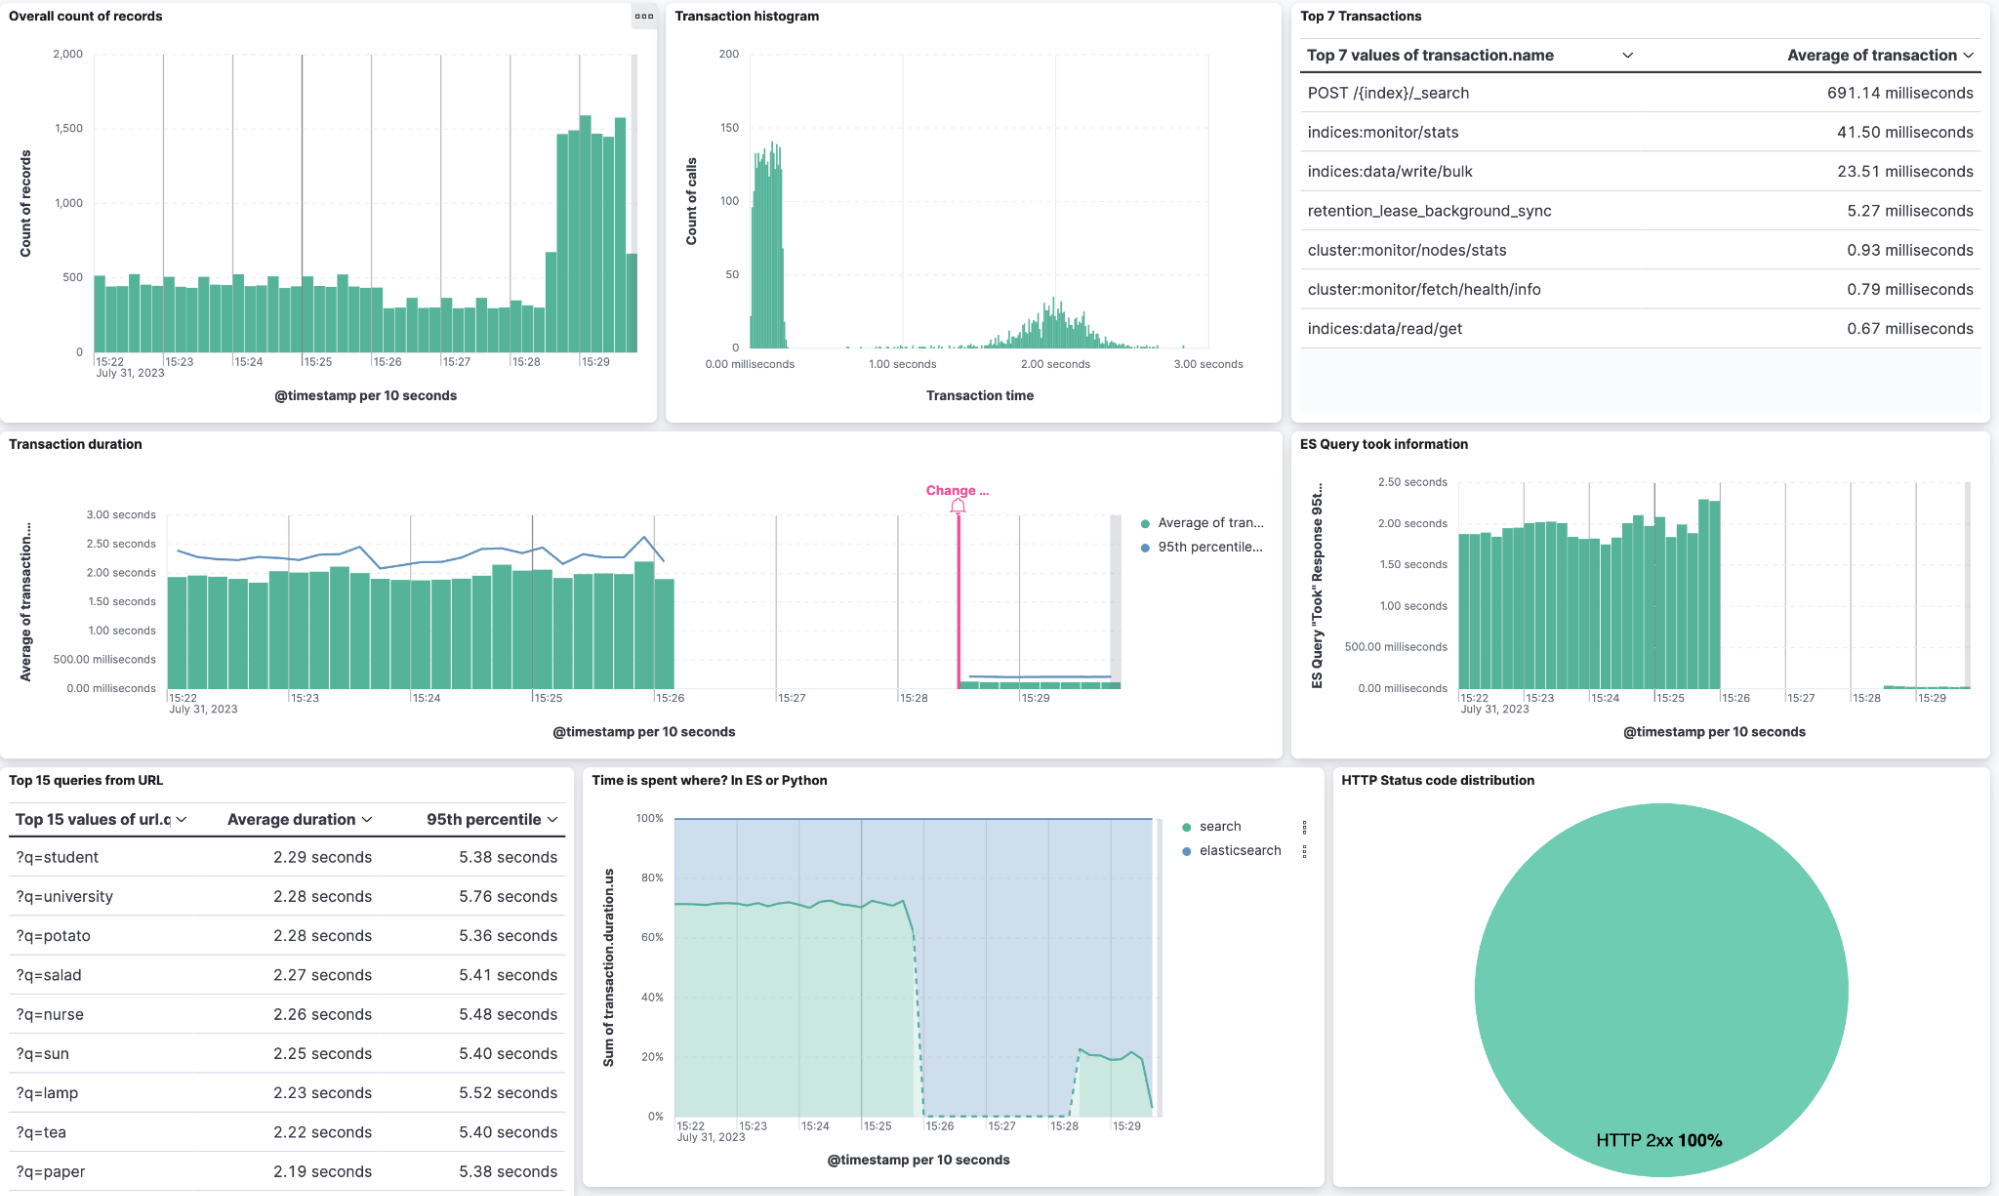
In my Flask service, I set the query size to 5,000, meaning that Elasticsearch should give me up to 5,000 matching documents in a single JSON response. That is a large number, and much of the time is spent retrieving that amount of documents from the disk. After changing it to the top 100 documents, I can quickly identify what happened in my dashboard by comparing it.
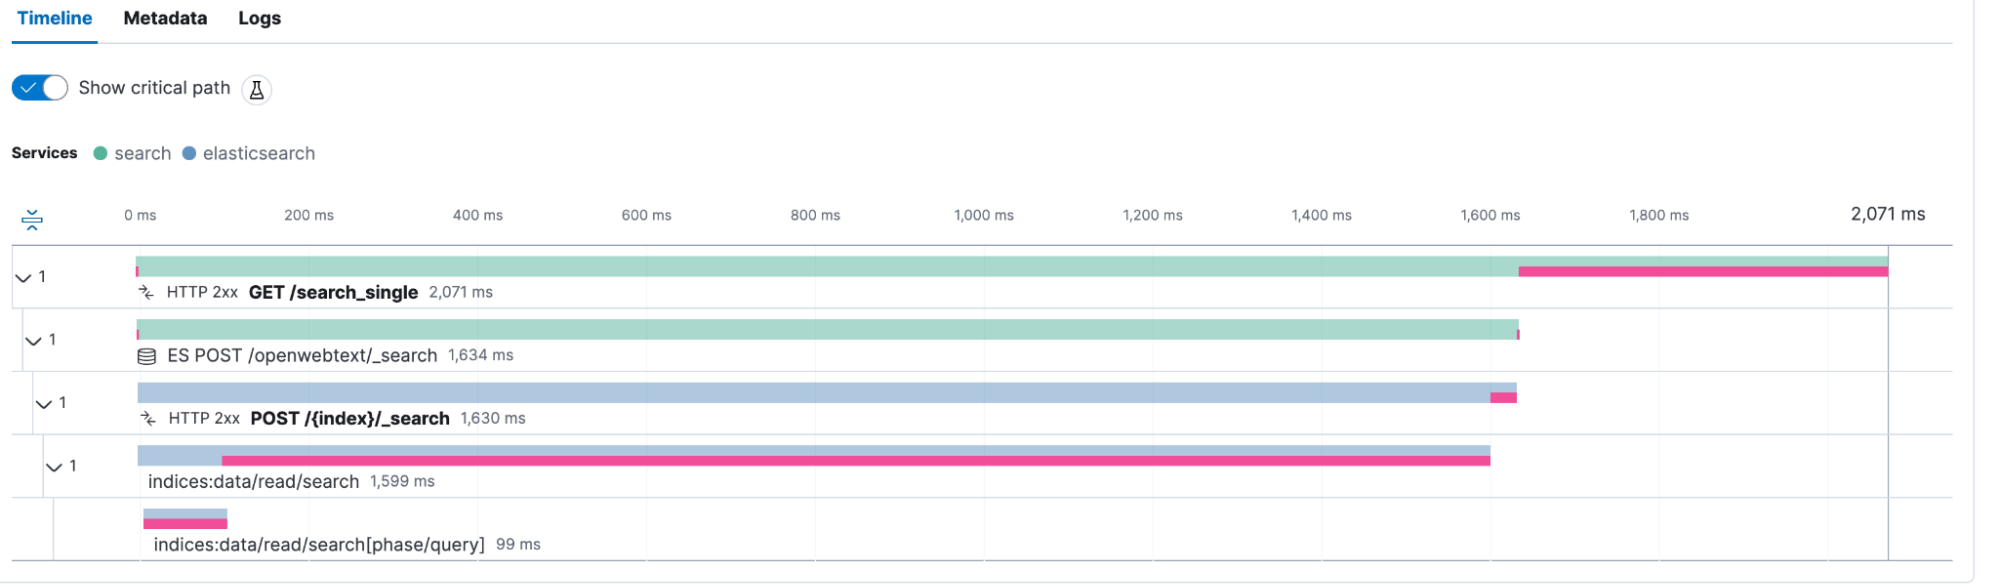
Looking at a transaction in the APM view and activating the labs function for the critical path creates an overlay, showing us where our application is spending its time.
After that, I created a dashboard using the fields transaction.duration.us, es_query_took, transaction.name. General KQL filters contain service.name, processor.event: transaction, transaction.name: POST /{index}/_search.
Side tip: go to data view management > select your data view containing the APM data streams > select the transaction.duration.us field > and change the format to duration. It will automatically render it now in human-readable output instead of microseconds.
Leveraging the Lens annotation feature, we can see in the middle Lens that the change to 100 docs brought down the average search transaction by a lot. Not only that, look at the overall count of records in the top right corner. Since we can search faster, we have a higher throughput! I really enjoy histograms, so I created one in the middle in the top row, where I have the transaction duration on the X-axis and the count of records on the Y-axis. Furthermore, APM delivers metrics, so we can identify how much CPU% usage is occurring at any time as well as JVM heap, non-heap usage, thread count, and more useful information.
Conclusion
This blog post showed you how important it is to have Elasticsearch as an instrumented application and identify bottlenecks much more easily. Also, you can use the transaction duration as a metric for anomaly detection, do A/B testing for your application, and never wonder again if Elasticsearch feels faster since you now have data to answer that question. Furthermore, all the metadata that is collected from user agents to queries help you to troubleshoot.
The dashboards and data view can be imported from here.
Warning
There is an issue with the duration of transactions inside Elasticsearch. This is fixed in the upcoming release of 8.9.1. Until then, the transactions use the wrong clock, which disturbs the overall duration.
The release and timing of any features or functionality described in this post remain at Elastic's sole discretion. Any features or functionality not currently available may not be delivered on time or at all.
Share
- Share on Twitter
Share on Twitter
- Share on LinkedIn
Share on LinkedIn
- Share on Facebook
Share on Facebook
- Share by Email
Share by Email
- Print this page
Print