Shipping Kubernetes Logs to Elasticsearch with Filebeat
We recently wrote about the new Filebeat features to retrieve & enrich Docker logs using Filebeat, and since the 6.0 release, you can leverage the same technology when running Kubernetes.
Metadata is key
When shipping logs from containers infrastructure it’s important to include context metadata to ensure we can correlate logs later. This becomes especially important for the Kubernetes case. You may want to watch logs from a full deployment, a namespace, pods with a specific label, or just a single container. Metadata is key to ensure you can filter logs to focus on what’s important to you.
Metadata is also useful to correlate events from different sources. When troubleshooting an issue it’s very common to check logs and metrics together, thanks to Kubernetes metadata we can filter both at the same time.
Add Kubernetes metadata
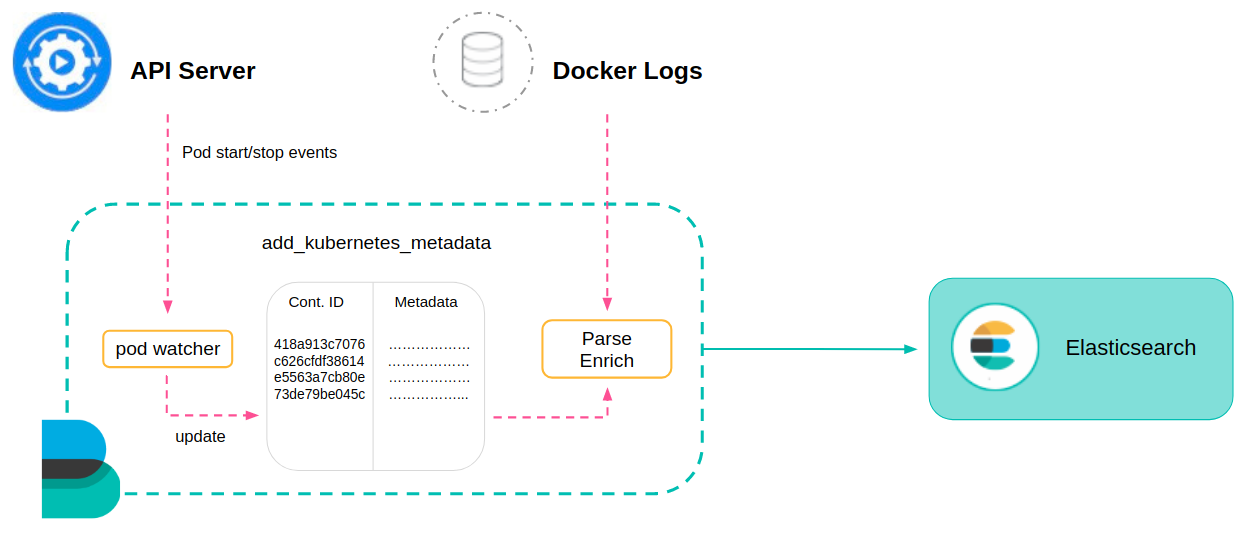
We use processors across all Beats to modify events before sending them to Elasticsearch, some of them are used to add metadata, as part of the 6.0.0 release we added addkubernetesmetadata to the list!
add_kubernetes_metadata enriches logs with metadata from the source container, it adds pod name, container name, and image, Kubernetes labels and, optionally, annotations. It works by watching Kubernetes API for pod events to build a local cache of running containers. When a new log line is read, it gets enriched with metadata from the local cache.
Deployment
Shipping logs from Kubernetes with Filebeat is pretty straightforward, we provide documentation and sample manifests to do it. Filebeat is deployed as a DaemonSet, this ensures one agent is running on every Kubernetes node. Docker logs folder from the host is mounted in the Filebeat container, Filebeat tails all container logs and enriches them using add_kubernetes_metadata. To deploy and see it yourself, just follow these simple steps:
# Download Filebeat DaemonSet manifest
curl -L -O https://raw.githubusercontent.com/elastic/beats/6.0/deploy/kubernetes/filebeat-kubernetes.yaml

# Update Elasticsearch connection details
- name: ELASTICSEARCH_HOST
 value: elasticsearch
- name: ELASTICSEARCH_PORT
 value: "9200"
- name: ELASTICSEARCH_USERNAME
 value: elastic
- name: ELASTICSEARCH_PASSWORD
 value: changeme

# Deploy it to Kubernetes
kubectl create -f filebeat-kubernetes.yaml
Logs will start flowing into Elasticsearch, enriched with Kubernetes metadata! You can now use it to filter logs:
Get started with the Elastic Stack and try it yourself.