Santa drives his sleigh using Kibana Dashboards!

 Share on Twitter
Share on Twitter

 Share on LinkedIn
Share on LinkedIn

 Share on Facebook
Share on Facebook

 Share by Email
Share by Email

 Print this page
Print
It’s the festive season. Regardless of whether you believe in Santa or celebrate Christmas or another holiday in December, we can all appreciate the speed at which good ol’ St. Nick flies around the world with his trusty reindeer delivering presents to all the good children.
He’s been doing this job for a long time. But in 2022, his sleigh got an upgrade thanks to Kibana dashboards! He is now able to track the cities he’s visited along the way, the state of his journey, and his cool Christmas playlist.
This blog post shares details of building some of the key controls Santa uses to drive his sleigh and track his journey across the world. We’ll present the data behind it, and show how you can validate your maps through the Kibana replay feature for a live picture of where Santa is, and the controls used for each dashboard widget.
Data sourcing
The dashboard is populated by two distinct data sources. The most important source is the navigation information showing when Santa reaches each city on Christmas. For any stop on Santa’s journey, we need the geographical coordinates of that point along with the country and city to populate our map.
GeoJSON is an open format for representing graphical data for consumption by mapping libraries. As a result, there are many files available for us to use, such as this one containing capital city data from Stefanie Doll. It includes features that have the data we need in the following format:
{
        "properties": {
            "country": "Bangladesh",
            "city": "Dhaka",
            "tld": "bd",
            "iso3": "BGD",
            "iso2": "BD"
        },
        "geometry": {
            "coordinates": [90.24, 23.43],
            "type": "Point"
        },
        "id": "BD"
}There are two key transformations required to convert this data into NDJSON, or Newline delimited JSON, a file that can be consumed via the Kibana data import.
- Flatten the properties into a single object that also includes the geometry attribute. The geometry attribute itself requires no manipulation as it is already in a format supported by the geo_point data type present in Elasticsearch.
- Addition of a timestamp field representing the time Santa arrives in that city.
With a bit of Christmas magic, and running the resulting JSON through an NDJSON converter, we end up with data similar to the following:
{"country":"Bangladesh","city":"Dhaka","tld":"bd","iso3":"BGD","iso2":"BD","location":{"coordinates":[90.24,23.43],"type":"Point"},"@timestamp":"2022-12-24T16:15Z"}
{"country":"Belgium","city":"Brussels","tld":"be","iso3":"BEL","iso2":"BE","location":{"coordinates":[4.2,50.5],"type":"Point"},"@timestamp":"2022-12-25T00:45Z"}The NDJSON file can be uploaded via the Upload file integration to create the index santa-city-visits-2022, making use of the advanced import to tweak the index mappings. Irrespective of which option you use, pay careful attention to the data types of your timestamp and location fields, which should be of types date and geo_point respectively as illustrated below.
PUT santa-city-visits-2022 {
    "mappings": {
      "properties": {
        "@timestamp": {
          "type": "date"
        },
        "city": {
          "type": "keyword"
        },
        "country": {
          "type": "text"
        },
        "iso2": {
          "type": "keyword"
        },
        "iso3": {
          "type": "keyword"
        },
        "location": {
          "type": "geo_point"
        },
        "tld": {
          "type": "keyword"
        }
      }
    }
}On such a long journey, Santa may want to crank up the tunes just as we would on a long car ride. Therefore, our second dataset is a festive playlist to get him in the mood for a rest after his shift. The mapping for the santas-playlist index is comparatively simpler than our location data as it doesn’t have any time series or geographic information. Our year could have been used as a date field, but it’s not required for our uses. What is needed is ensuring that we have keyword fields for any fields presented in our table, such as title and artist. For that reason, we have used multi-fields to have support for full-text search and aggregations.
PUT santas-playlist
{
  "mappings": {
    "properties": {
      "title": {
        "type": "keyword",
        "fields": {
          "raw": {
            "type":  "text"
          }
        }
      },
      "artist": {
        "type": "keyword",
        "fields": {
          "raw": {
            "type":  "text"
          }
        }
      },
      "album": {
        "type": "keyword",
        "fields": {
          "raw": {
            "type":  "text"
          }
        }
      },
      "release_year": {
        "type": "short"
      },
      "rating": {
        "type": "byte"
      }
    }
  }
}These items can be crafted into a _bulk request to add the documents to the index. I’ve hand-crafted a few favorites in this sample request:
POST santas-playlist/_bulk
{ "index": {} }
{ "title": "I Wish It Could Be Christmas Everyday", "artist": "Wizzard", "album": "Now That's What I Call Christmas", "release_year": "1973", "rating": "4" }
{ "index": {} }
{ "title": "Merry Christmas Everyone", "artist": "Shakin' Stevens", "album": "Merry Christmas Everyone", "release_year": "1985", "rating": "5" }
{ "index": {} }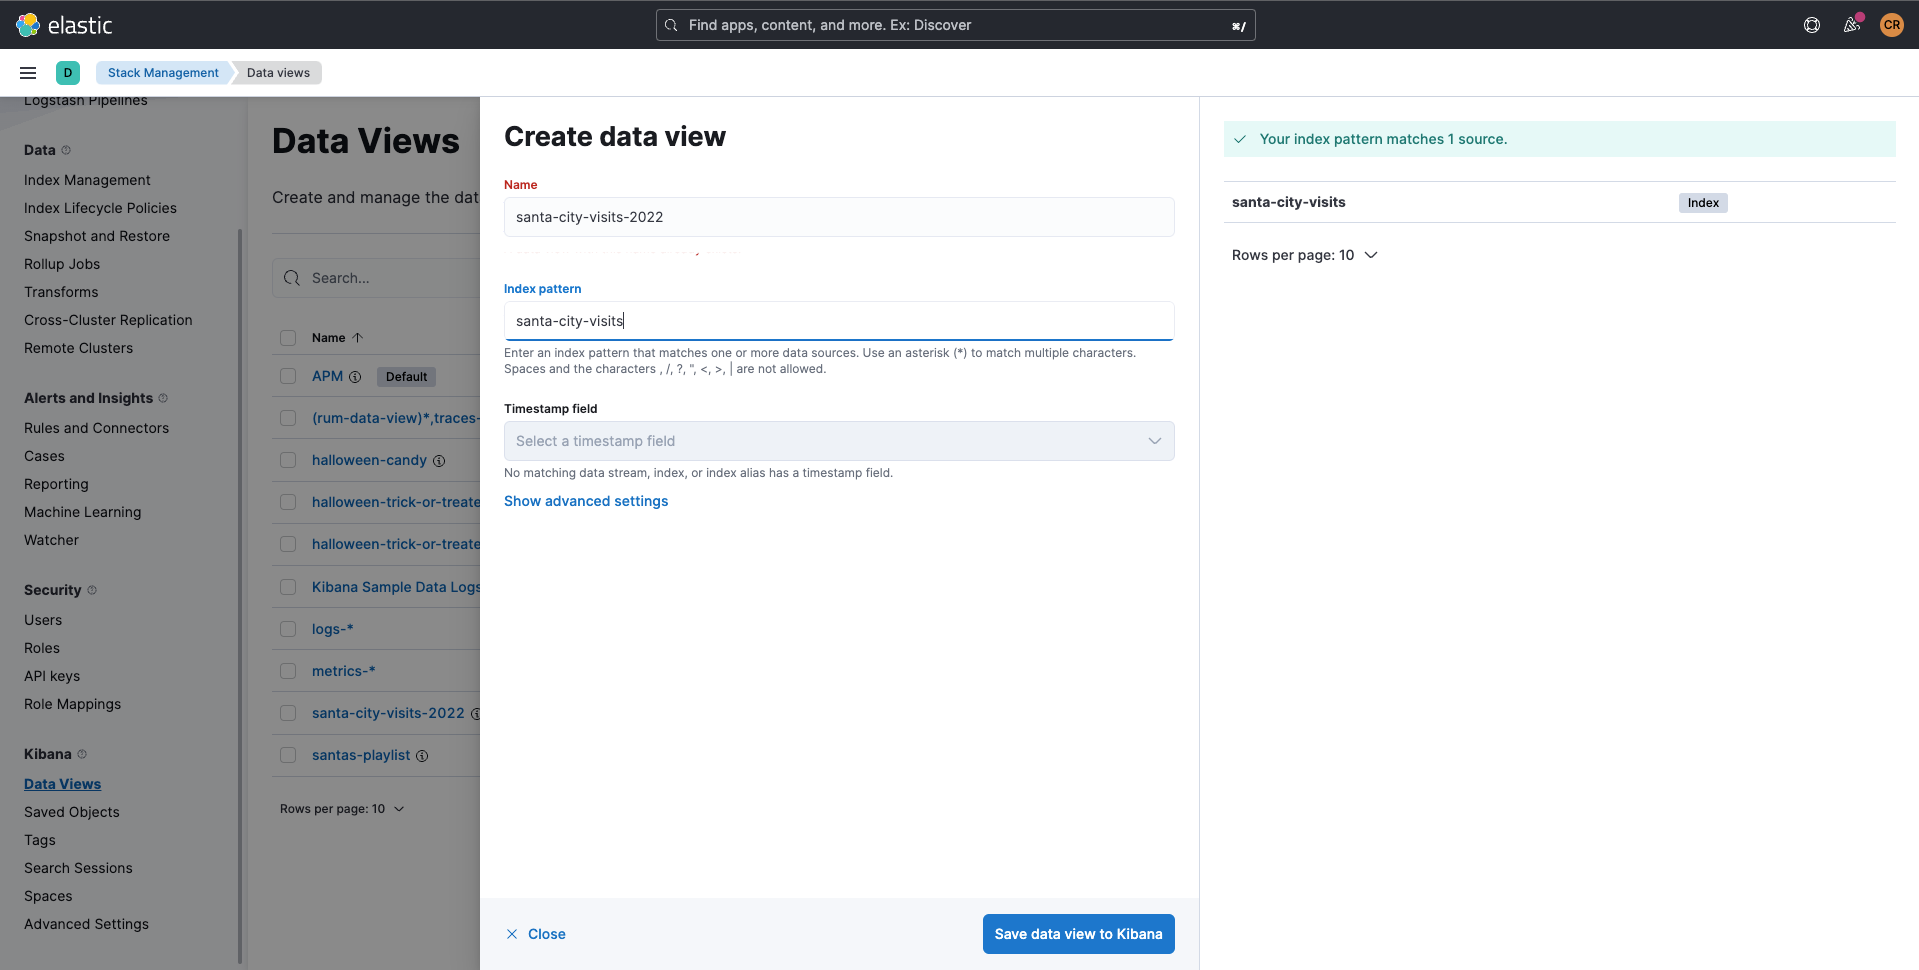
{ "title": "One More Sleep", "artist": "Leona Lewis", "album": "Christmas, With Love", "release_year": "2013", "rating": "2" }A data view is required for each index to allow us to create controls on top using Kibana. With the upload integration, this is generated automatically. But when creating our index, as we did for the playlist, we need to create a new data view matching our index pattern within Stack Management.
Now onto the fun bit: creating our Dashboard!
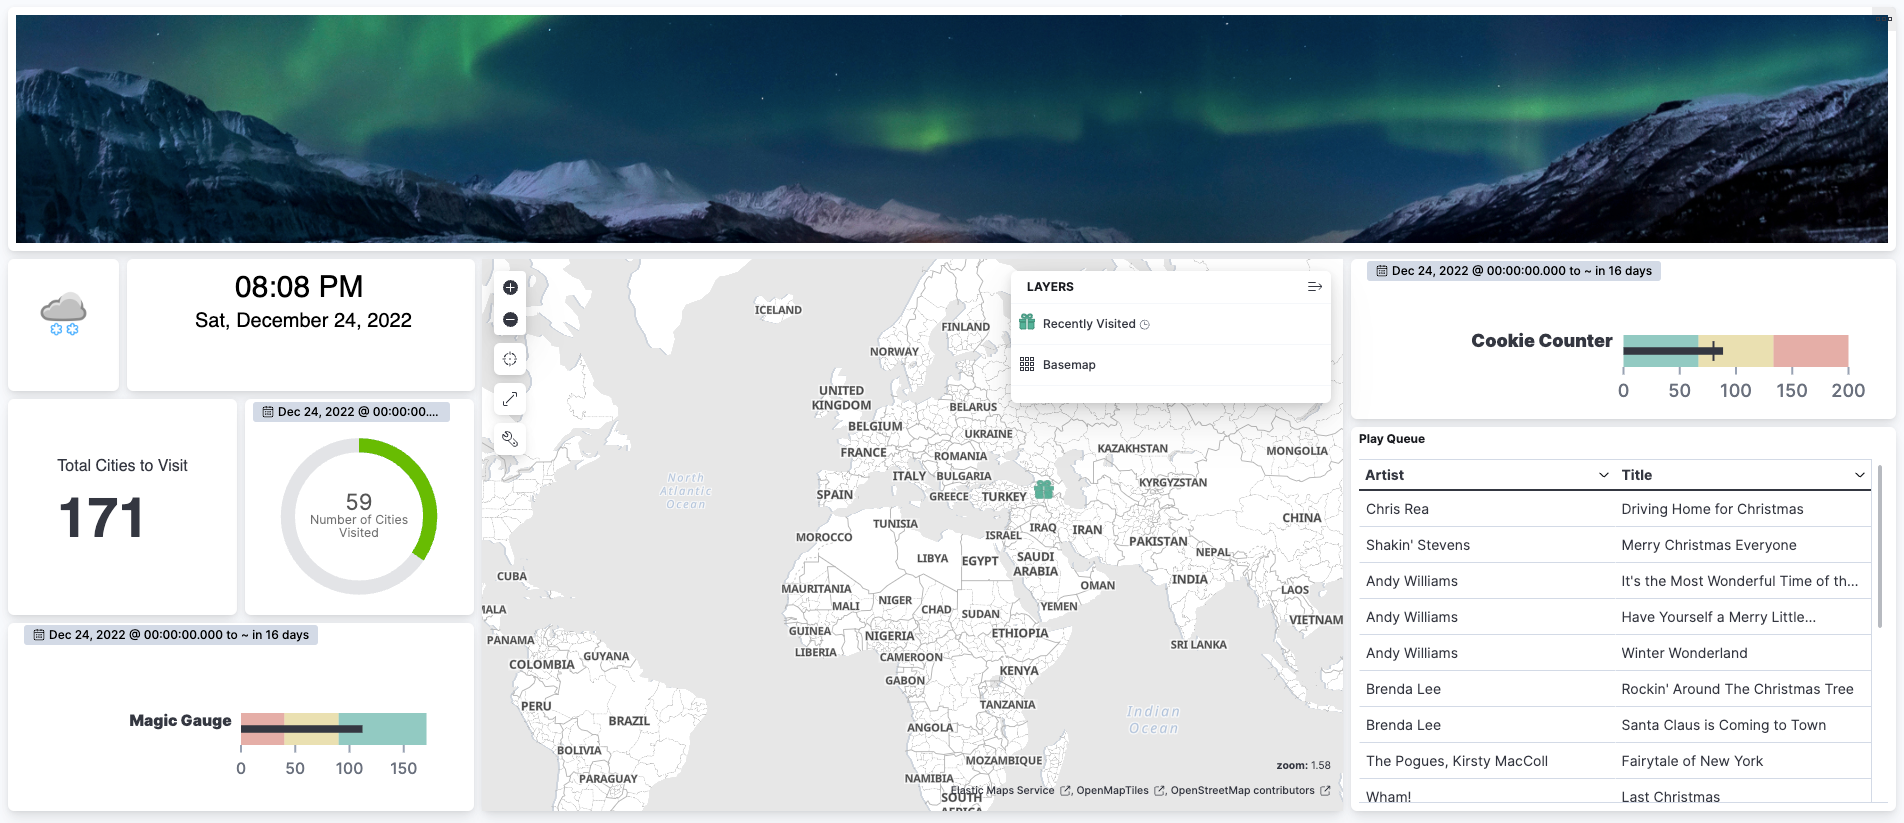
Control inventory
The dashboard contains many types of control created using different Kibana features. Each is important for helping Santa guide his reindeer-pulled sleigh across the world to deliver presents. High-level details of how each control is created are given according to the numbered figure below within this section.
Metric widgets
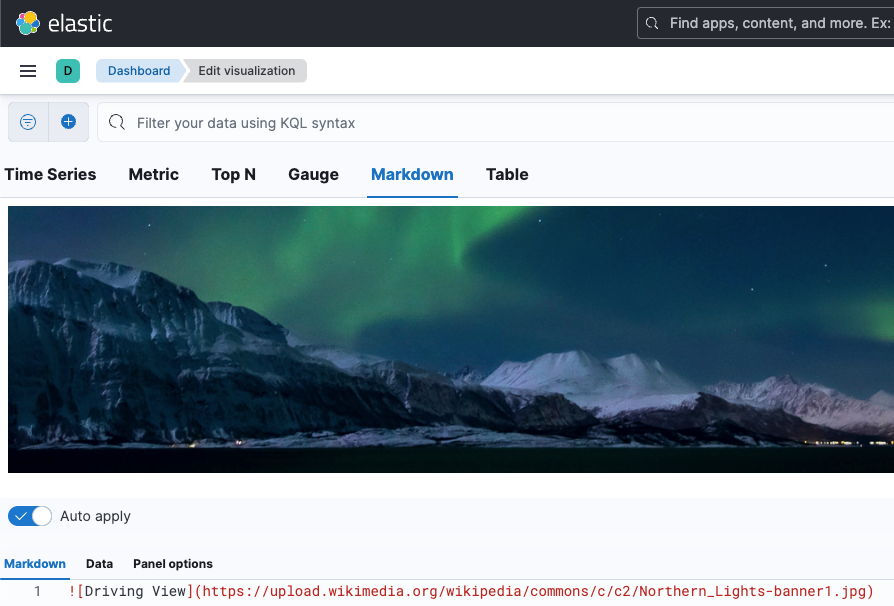
Santa will see wonderful sights as he travels through the world, such as the Northern Lights! Images are not explicitly supported controls in Kibana. But Markdown can! The Markdown support in TSVB is how controls 1 and 2 show Santa’s view and the current weather have been created. Santa’s view is driven via the below configuration:
Santa needs to know the time to make sure he’s on track with his deliveries. In control 3 we have added UTC time using signal updates in VegaLite via the Custom visualization feature. Credit goes to our wonderful Discuss community who came up with this solution, which has been revamped to use the utcFormat method instead of string concatenation:
{
  "$schema": "https://vega.github.io/schema/vega/v5.json",
  "signals": [
    {
      "name": "time",
      "init": "utcFormat(now(), '%I:%M %p')",
      "on": [{"events": {"type": "timer", "throttle": 1000}, "update": "utcFormat(now(), '%I:%M %p')"}]
    }
  ],
  "marks": [
    {
      "type": "text",
      "align": "center",
      "encode": {
        "update": {
          "text": {"signal": "time"},
          "opacity": {"value": 1},
          "x": {"value": 100},
          "y": {"value": 30},
          "fontSize": {"value": "30"}
        }
      }
    }
  ]
}Lens is a great way to create simple visualization controls quickly for dashboards. Many of our widgets are created using the basic Lens options, including:
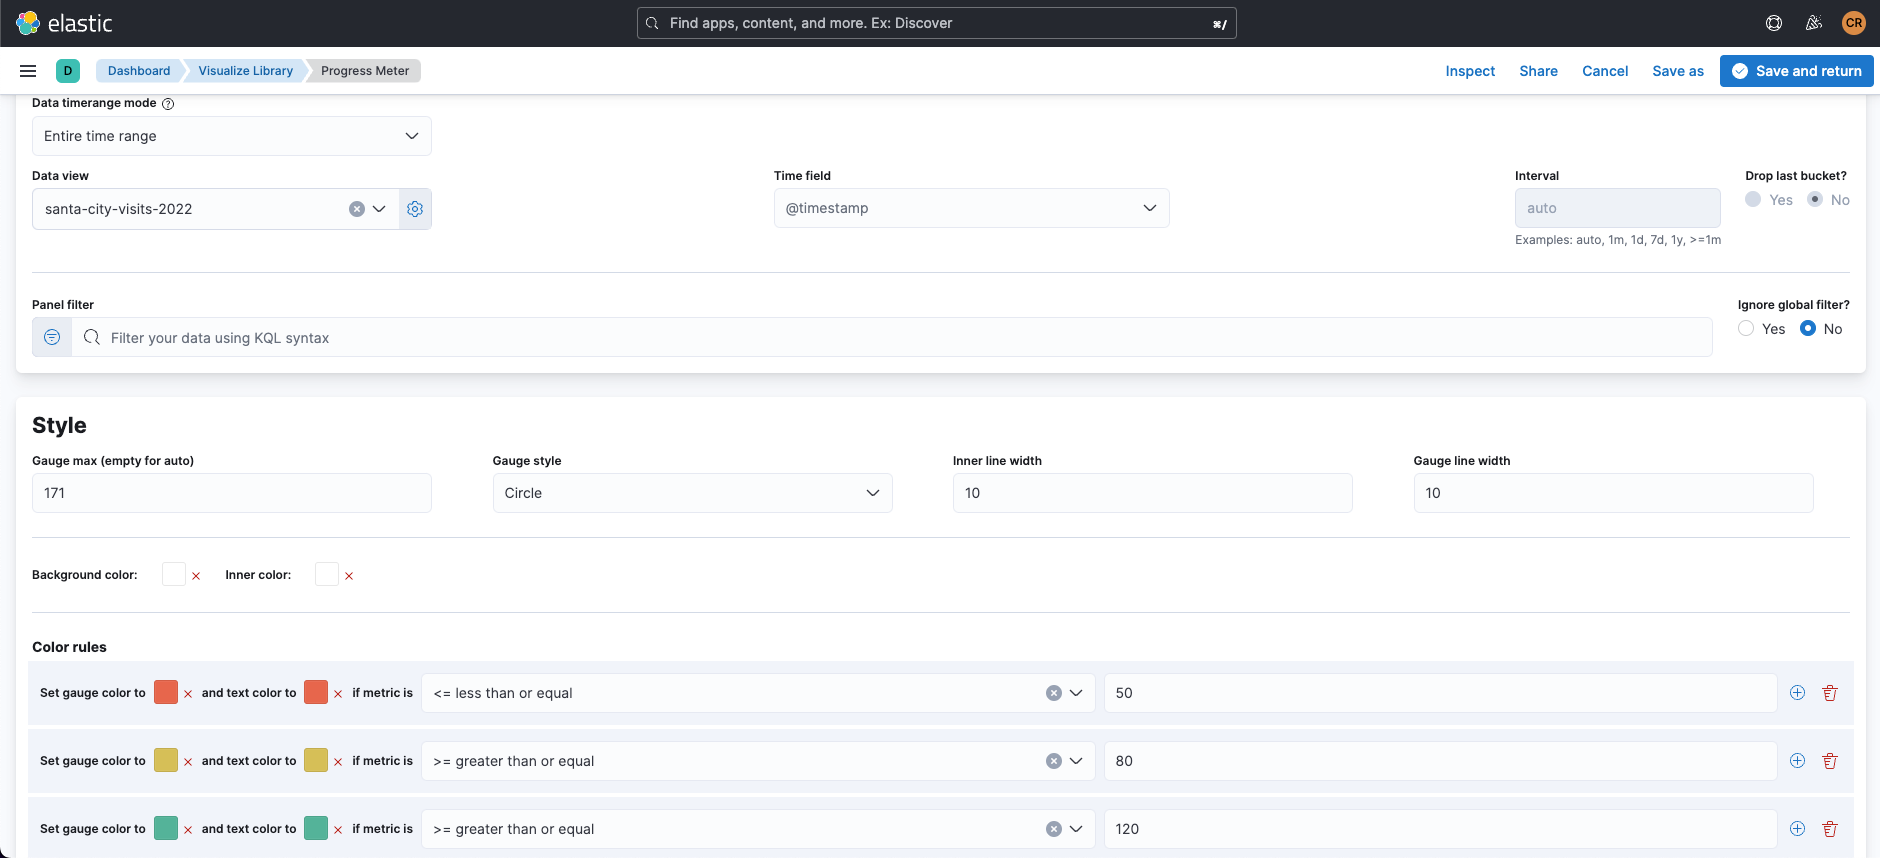
- The magic and cookie gauges, as denoted as controls 5 and 8. These controls have reversed color mapping rules using the traditional red-amber-green color coding. Low magic is red as it is problematic as Santa needs fuel to drive his sleigh. But he needs to watch his sugar levels, which is why a large number of cookies is mapped to red instead of green.
- The total cities widget metric in item 6.
- Santa’s playlist in control 9 is a simple table using the title and artist keyword fields as rows, with a hidden metric column based on our song ratings.
The circular gauge presented in control 7 is different from the others as it’s generated via TSVB. The aggregation settings are a simple count in this case, but much like Lens gauges, we can add color rules to indicate status similarly, as illustrated below.
Finding Santa with maps
The central control of our dashboard is the map. This is the same as the sat nav in the central console of your car. It would be rather challenging for Santa to deliver presents and travel to his next destination if he didn’t know where he was!
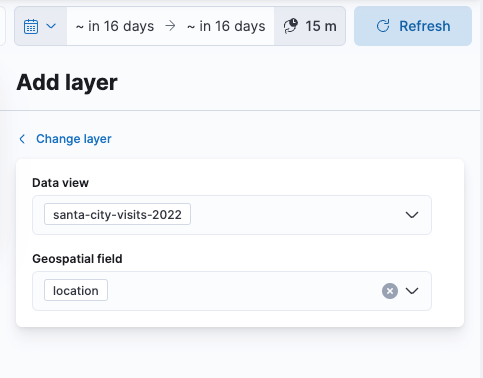
Kibana maps allow you to add multiple layers of data on top of the map. The Documents layer option allows for basic points to be included as needed here. With the work undertaken to define our location geo_point attribute on our santa-city-visits-2022 index, it will be automatically picked up when we select the corresponding data view.
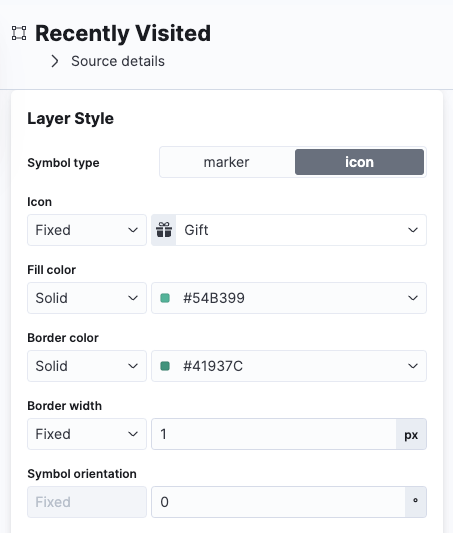
Within the layer settings, it’s important to specify tooltip fields to help users obtain more information on a given location. In our example, we set @timestamp, city, and country as the tooltip fields. What is more important is setting our marker as a gift, which is present as one of many in-built icons in the icon symbol type:
Epilogue: Tracking Santa
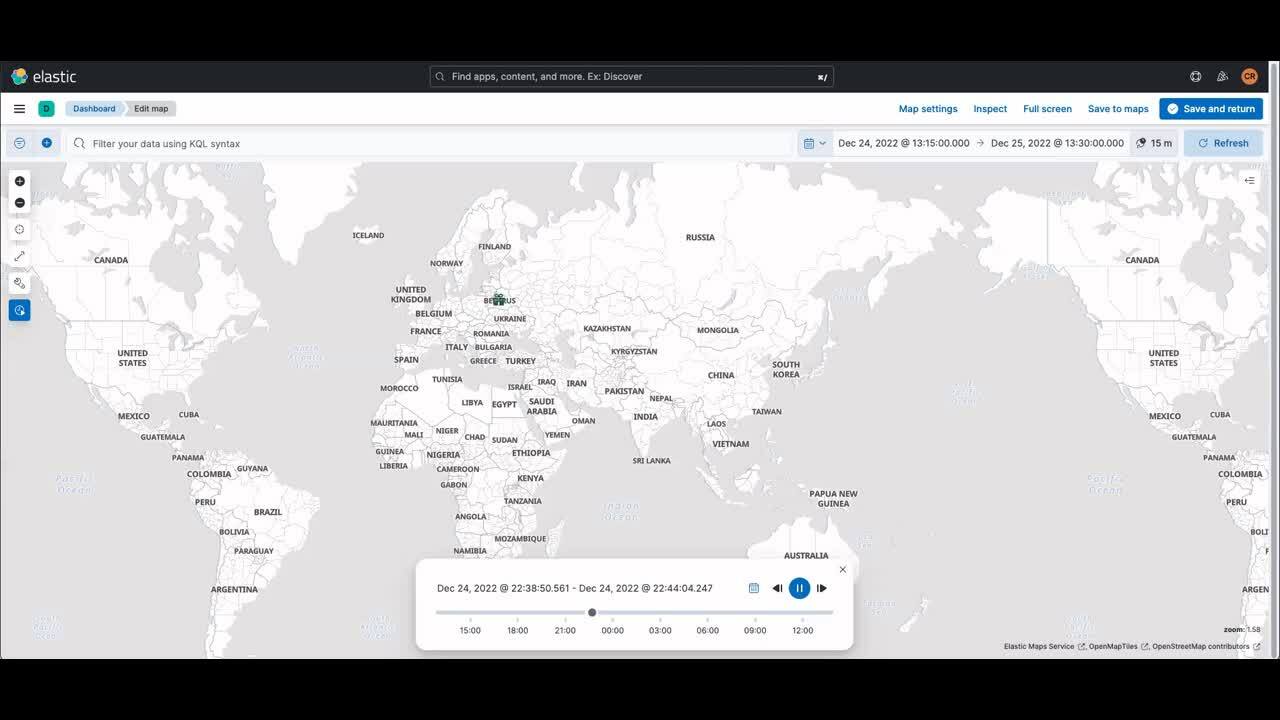
One challenge in validating our map data and configuration is that Christmas Eve is still a bit away. We’re all excited to see him trace across the world delivering presents, right? Thankfully Kibana can rescue our Christmas by allowing us to replay the time series data and see the map update using the Timeslider within the Edit map screen.
Happy holidays!
Share
- Share on Twitter
Share on Twitter
- Share on LinkedIn
Share on LinkedIn
- Share on Facebook
Share on Facebook
- Share by Email
Share by Email
- Print this page
Print