Ransomware testing with Elastic Endpoint Security
As attackers continue to evolve and advance their techniques, tactics, and procedures (TTPs), it is crucial for enterprise organizations to deploy necessary countermeasures and defenses to secure their networks. Elastic Security provides an endpoint protection platform (EPP) with some of the most advanced and effective endpoint protections and preventions on the market today. Among these protections and preventions is behavioral ransomware protection, which we’ll be exploring in depth in this blog post. To more effectively test this feature, we developed a framework that we refer to as DCART: decoupled components for automated ransomware testing.
Ransomware can be considered a non-linear category of malware. Though the ultimate payload may be an executable that simply encrypts files, the components that allow for the initial system infection and the payload to be dropped and launched are all just as important. Elastic Security has a layered approach to endpoint protection that is ideal for preventing and limiting ransomware infections due to the ability to detect both static and behavioral malicious functionality. Our solution’s static detections can detect and prevent exploits, along with malicious binaries and documents, prior to execution. Behavioral detections, such as process injection and rule-based detections that can identify and chain together anomalous events (i.e. volume shadow copy deletion), provide additional avenues for the mitigation of malicious behavior as it occurs.
If a piece of ransomware manages to circumvent our layered protection model, behavioral ransomware protection comes into play. By constantly monitoring file system activity across all processes on the file system, behavioral ransomware protection operates on the basis of rapidly identifying and mitigating anomalous file system activity as it occurs. For further details on Elastic Endpoint Security solutions and ransomware protection capability, check out our previous blog post: So You Wanna Stop Ransomware?
Throughout the research and development of this feature, testing against known ransomware samples has been critical to determining shortcomings and areas for improvement in the quest for maximum efficacy. Testing consists of the following steps:
- Sensor / feature startup
- Ransomware detonation
- Output monitoring
- Determination of a detected sample
Though this process is rather straightforward and was sufficient when evaluating detection efficacy with regards to a single sample, it does not hold up well in terms of scalability due to the following considerations:
- Background processes and system services have a direct effect on time to detect
- Changes introduced to the detection algorithm require manual sample retesting
- Ransomware may corrupt the test environment and render it unstable
Improved framework
In light of these noted scalability issues, we decided to build out a new testing framework with decoupled collection and analysis components, wherein:
- The collection component would be responsible for logging all relevant metadata pertaining to each file event observed
- The analysis component would analyze event trace files generated by the collection component and generate scores summarizing the level of suspicious activity observed in each active process
A key factor in the flexibility of this framework is the generation of event trace files. Once these files are generated and saved off of the test environment, they may be analyzed ad infinitum as long as the format that the analysis component expects remains consistent. Changes to the detection algorithm and background noise filtering can all take place and be retested rapidly via the analysis component. This makes it much easier to make meaningful adjustments that have a direct effect on improving both efficacy and time to detect.
Defining the event trace format was relatively straightforward as there are only four data fields required for each event:
- Operation
- File path(s)
- Contents
- Process
Proof of concept
When I set out to build out a POC framework to determine the feasibility of this approach for our production environment, one of my goals was to avoid the complexity of having to build or require a kernel driver for the event collection piece. I was hoping to use python throughout the framework and leverage a library to collect the events, but the libraries either relied on the ReadDirectoryChanges API and didn’t provide the associated process for each event, or required Event Tracing for Windows (ETW) and were either less performant than desired or provided an inconsistent data stream. Further experiments led me to look into Sysmon (can only capture file creation events), Procmon (non-standard backing file in PML format would require reverse engineering), and finally, file access auditing (proved to be unsuitable due to configuration and performance issues).
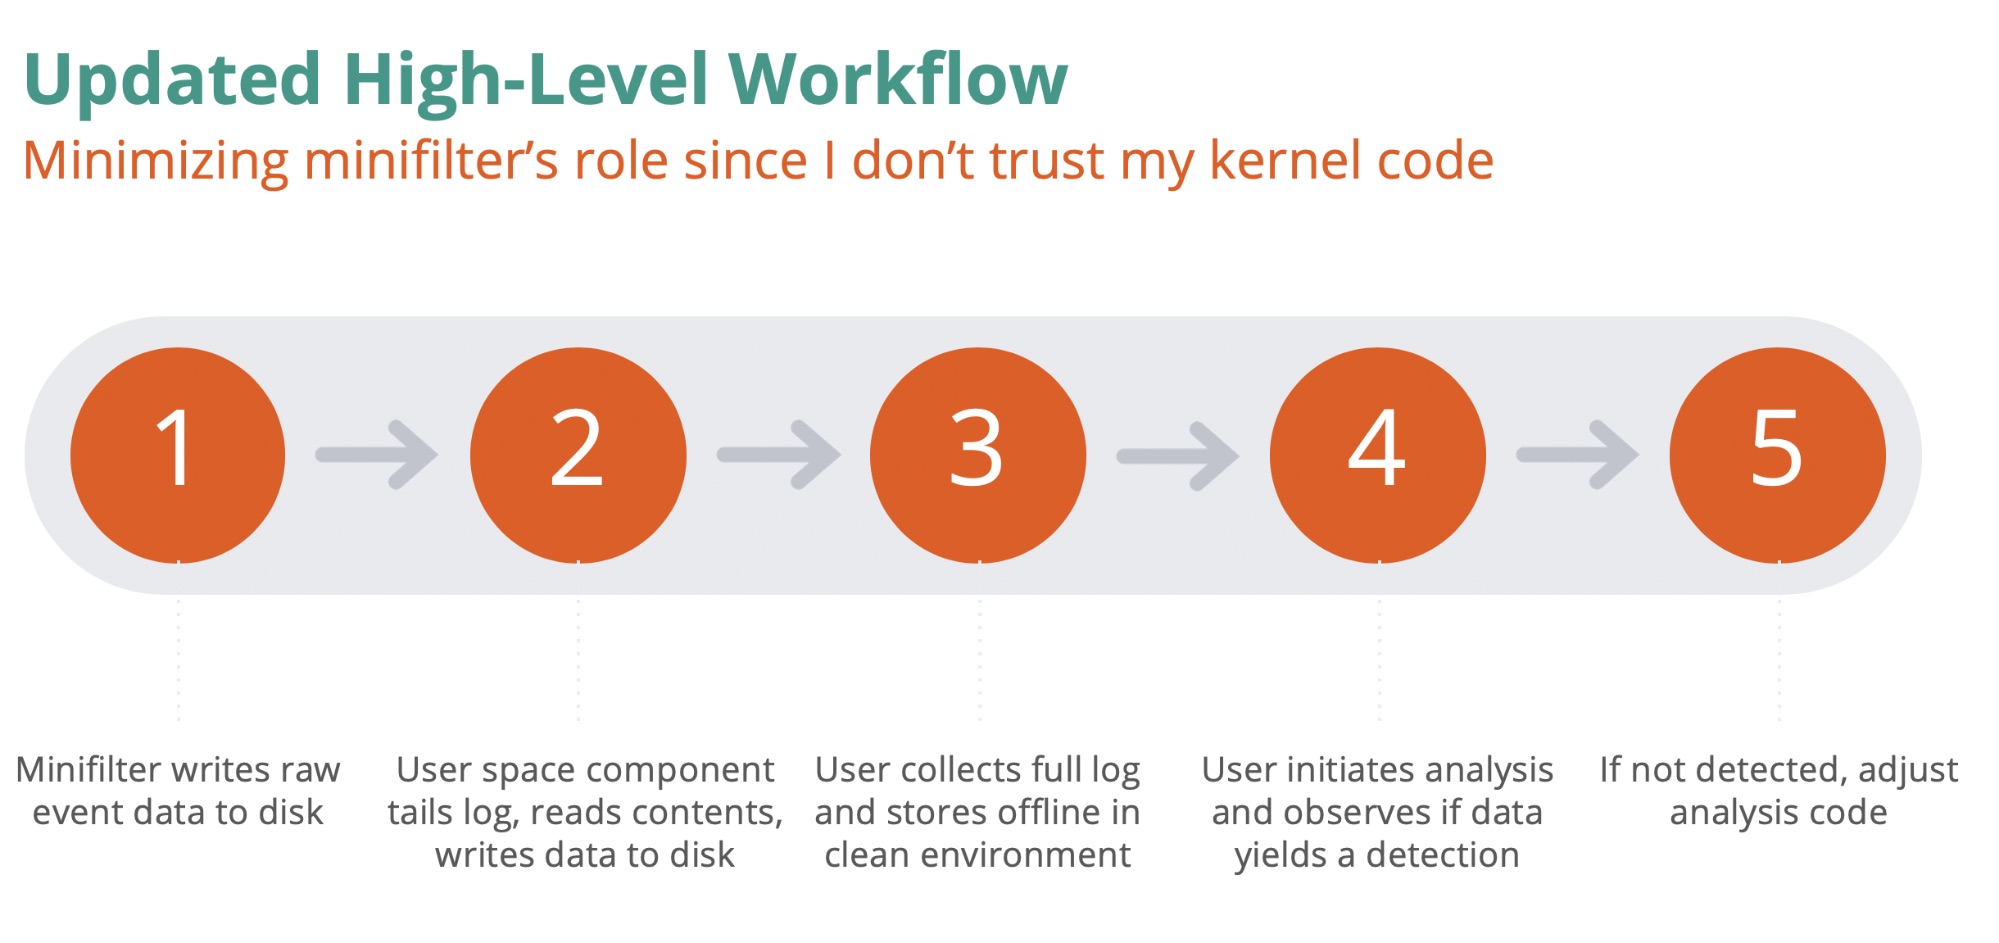
With all other options seemingly off the table, I decided that I would need to build my own file minifilter driver to collect the event data that the framework would need. While this was ultimately the most performant and complete approach to the problem, it was also the most complex and potentially unstable due to its presence in the kernel.
I ultimately decided to pair the minifilter driver with a user space process to avoid resource contention and complexity issues. This scenario greatly reduces the complexity of the driver by only requiring that it collect minimal event data and write it directly to disk. The user space process would be configured to read the event stream from this log file, obtain the relevant file contents for each event, and write an entry summarizing each event to a separate log file that will later be stored offline for analysis.
Analysis
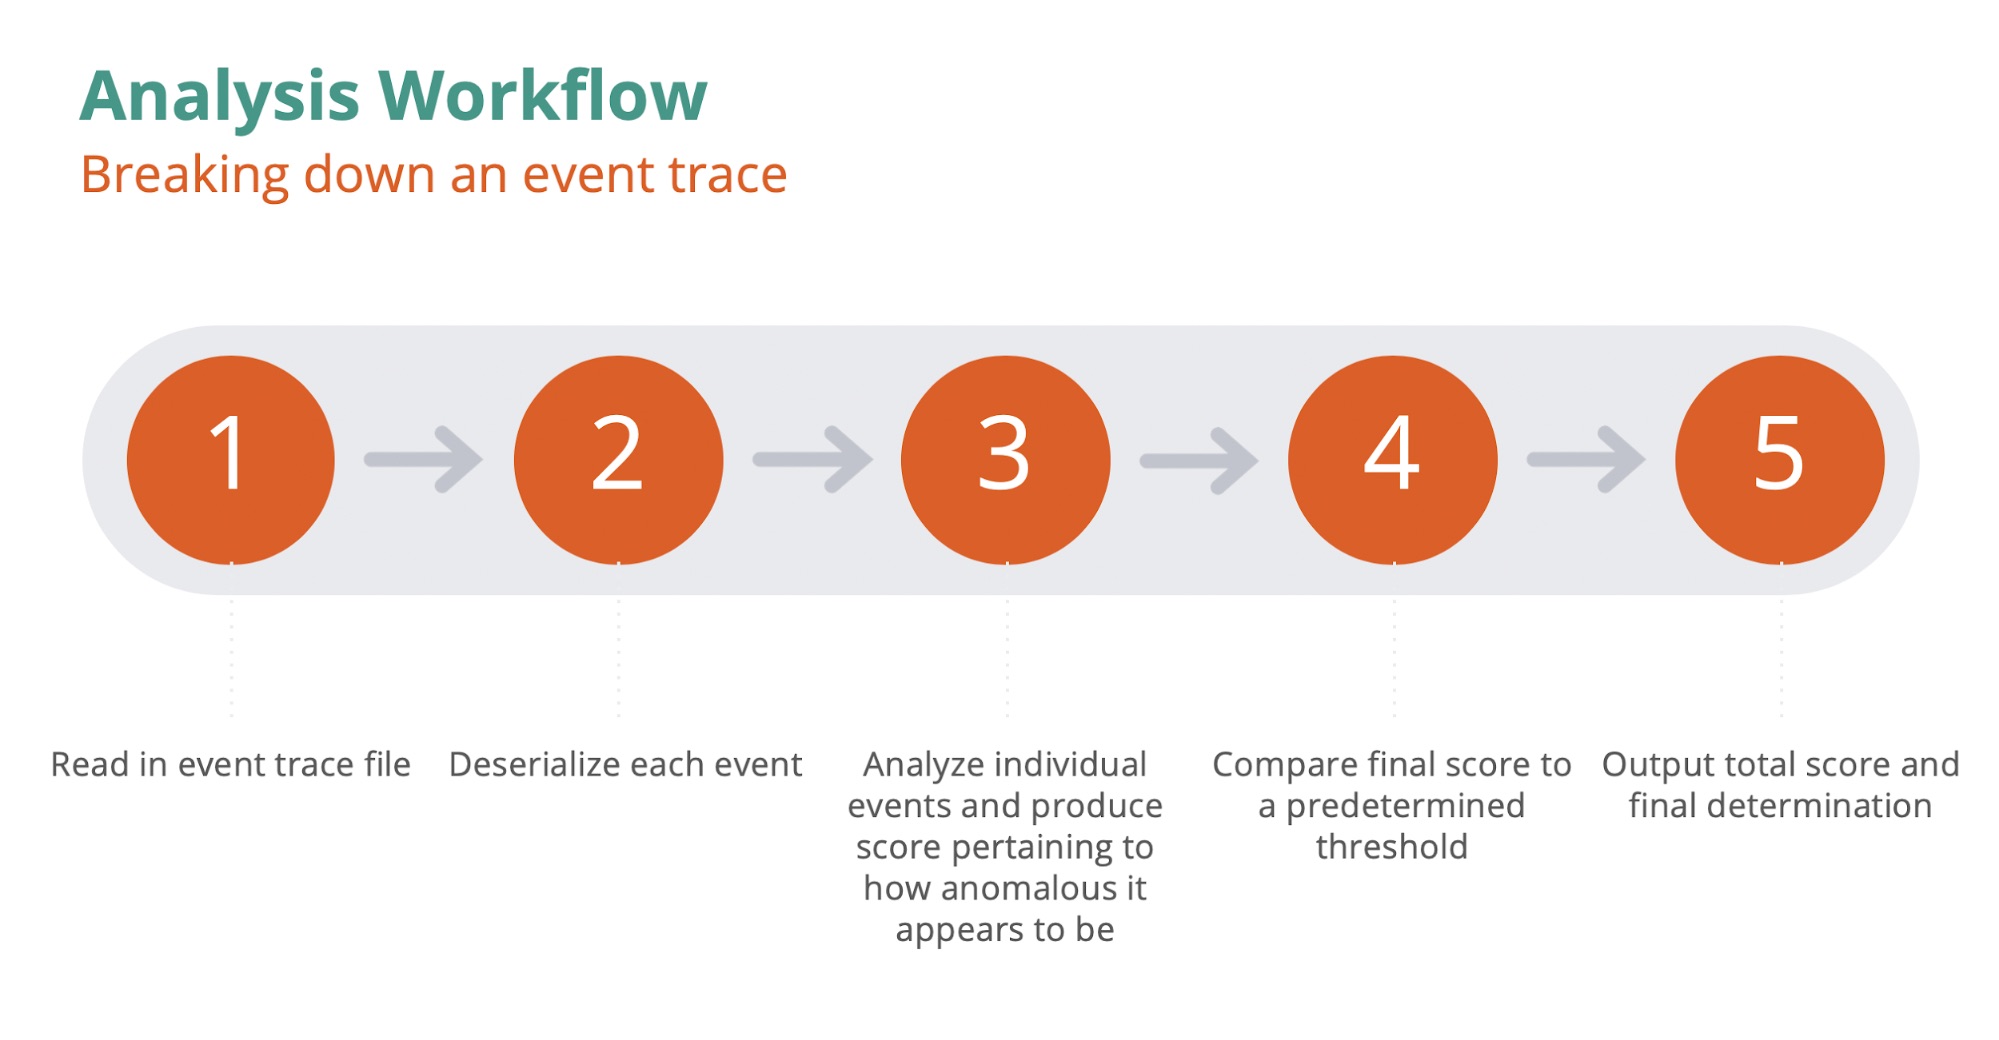
The analysis component is much more straightforward in architecture and workflow when compared to the collection component and its inter-process communication via log files. A single python script will read in a provided event trace file, deserialize the data for each event, determine how anomalous each event is, and tally up a score pertaining to any observed anomalous activity.
This python script is the one piece of the framework that is meant to be the most configurable. The script essentially serves as a “black box” analysis component — when given an event trace file, the box produces a ‘yes / no’ with sufficient correlating evidence.
To provide an initial detection capability (which can be further expanded upon), I implemented two unique metrics that I will highlight below.
Entropy analysis
Entropy is calculated from the byte values contained within a file and pertains to the randomness of the dataset. Entropy values will range between 0.0 and 8.0, where higher floating point values are more indicative of a higher degree of randomness.
Implementing entropy analysis in this framework was very straightforward: we enumerate the extensions that we are particularly interested in, along with corresponding values that represent the maximum entropy value that should be observed for a typical file with that extension. This data will then be stored in a dictionary. When we analyze individual events, we calculate the file entropy and, if there is a corresponding entry in the dictionary for the given file extension, compare the calculated value to the expected maximum value. Any case where the calculated value exceeds the expected maximum will be treated as noteworthy and will have a direct impact on the event score.
Header analysis
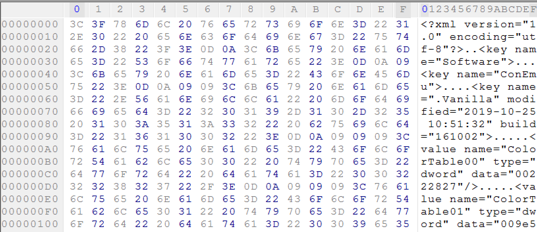
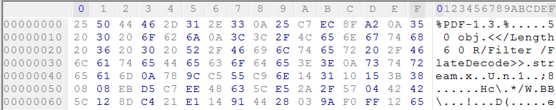
The first few bytes of a file, depending on the purported type indicated by its file extension, may provide immediately useful feedback as to the nature of the file modification. More strictly-defined formats (e.g., PDF, PNG, JPG, XLSX) are of particular importance depending on how they adhere to known magic byte sequences. For instance, a typical PDF header is provided below:
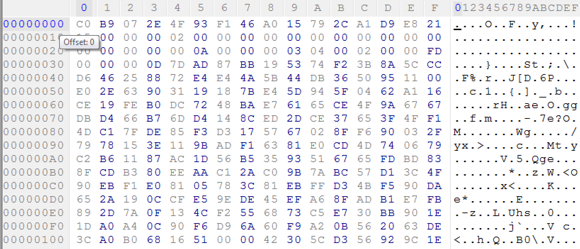
Now, if the same file is overwritten with encrypted contents, the header would look something like this:
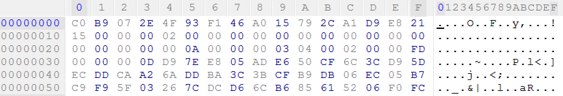
Visually, an analyst can spot the obvious differences. Programmatically, we can compare the encrypted contents with an expected standard PDF magic byte sequence ({0x25, 0x50, 0x44, 0x46} or “%PDF”) to determine that there is a mismatch and that the file does not adhere to the expected format.
Analysis caveats
It is important to note that these two metrics, while very useful and insightful, should not be considered silver bullets for determining anomalous behavior. Header analysis may be prone to false positives if you do not accurately account for how benign applications may modify certain file types that do not meet the most common expected magic byte sequences. Entropy may also be misleading when looking at binary or compressed data if expected ranges are not properly calibrated. To minimize false positive risk, it is best to weigh anomalous activity that spans multiple file extensions and types to a higher degree than individual events.
Demo videos
The videos below demonstrate the two basic modes of the DCART framework: collection and analysis.
The first video starts with the driver service and collection script being launched. Once the initial setup is complete, an InfiniteTear ransomware sample is detonated. The event data is then monitored until the collection script terminates after it has reached its 1000 event threshold.
The second video shows the previously captured event data being analyzed. Certain event data entries are highlighted as being particularly anomalous.
Automation
With event traces stored offline in a central repository, devising an approach to automated testing is rather straightforward. Any changes to the codebase would need to be tested against all stored traces to ensure there are no regressions in efficacy. If core changes to the detection logic are being made, event scoring changes should be expected, though the net result would ideally maintain at least the same number of sample detections, with the end goal being to eventually reach a 100% detection rate for all stored traces.
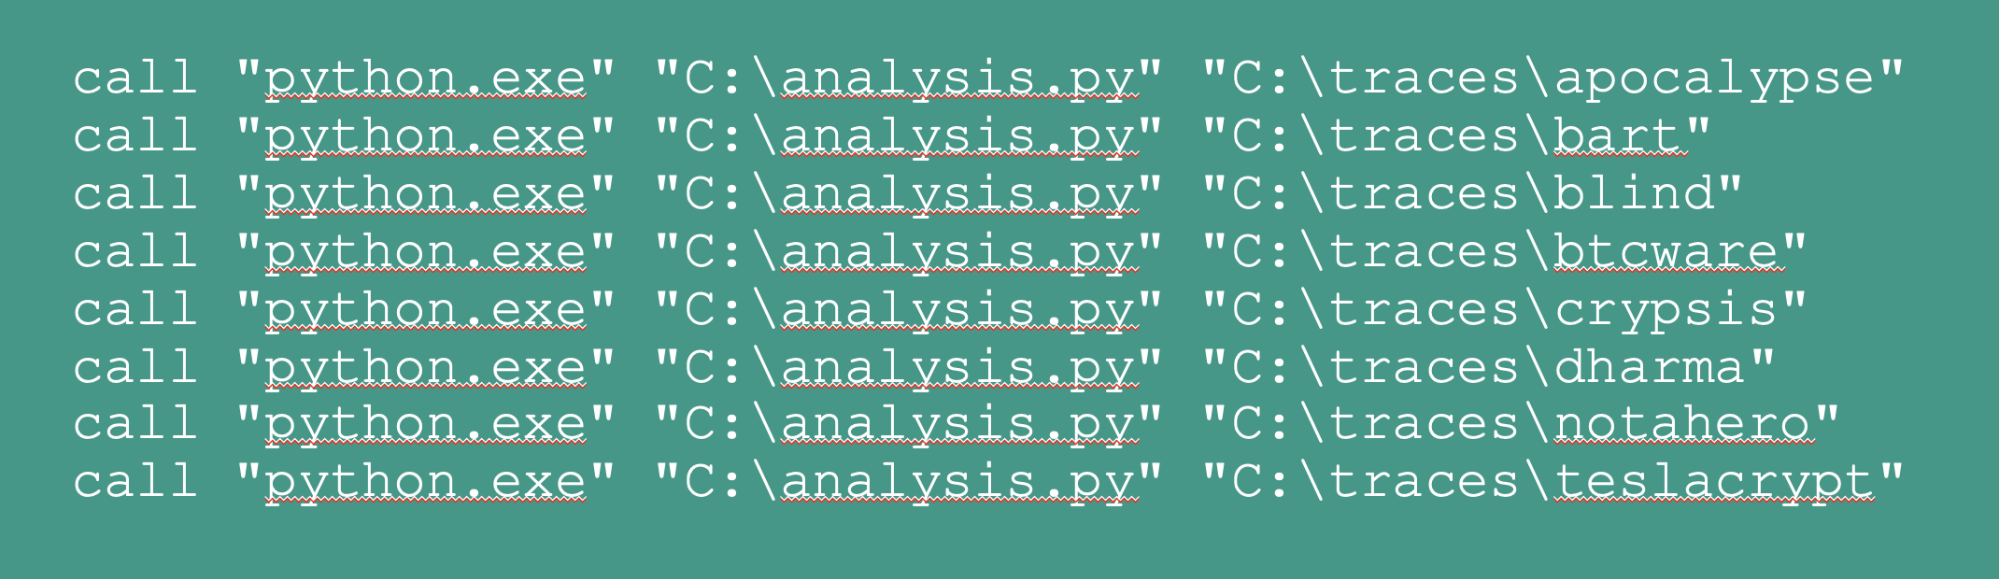
A simple batch file could be utilized to invoke the python interpreter and the analysis script with one of the event traces as the sole argument.
A more pragmatic approach would be to enumerate the contents of the directory, analyze each file as it is encountered, and then log the calculated score.
Future work
While this project forms a great foundation to build from for developing a behavioral ransomware detection framework, it would require much more work to reach anything resembling a production-ready state. To provide more value as a proof of concept testing tool, however, the following improvements could be made:
- Driver code would need to be overhauled and stabilized
- Improve performance of the Python collector code
- Provide a sample trace corpus
GitHub
All relevant source code pertaining to this project has been posted to the DCART project on the Elastic GitHub repository.