Monitoring Kafka with Elasticsearch, Kibana, and Beats
We first posted about monitoring Kafka with Filebeat in 2016. Since the 6.5 release, the Beats team has been supporting a Kafka module. This module automates much of the work involved in monitoring an Apache Kafka® cluster.
In this blog post, we'll focus on collecting logs and metric data with the Kafka modules in Filebeat and Metricbeat. We'll be ingesting that data into a cluster hosted on the Elasticsearch Service, and we'll explore the Kibana dashboards provided by the Beats modules.
This blog post uses the Elastic Stack 7.1. An example environment is provided on GitHub.
Why modules?
Anyone who’s worked with complex Logstash grok filters will appreciate the simplicity in setting up log collection via a Filebeat module. There are other benefits to utilising modules within your monitoring configuration:
- Simplified configuration of log and metric collection
- Standardised documents via the Elastic Common Schema
- Sensible index templates, providing optimum field data types
- Appropriate index sizing. Beats utilise the Rollover API to help ensure healthy shard sizes for Beats indices.
Consult the documentation for a full list of modules supported by Filebeat and Metricbeat.
Introducing the environment
Our example setup consists of the three-node Kafka cluster (kafka0, kafka1, and kafka2). Each node runs Kafka 2.1.1, along with Filebeat and Metricbeat to monitor the node. The Beats are configured via Cloud ID to send data to our Elasticsearch Service cluster. The Kafka modules shipped with Filebeat and Metricbeat will set up dashboards within Kibana for visualisation. As a note, if you want to try this in your own cluster, you can spin up a 14-day free trial of the Elasticsearch Service, which comes with all the bells and whistles.
Setting up the Beats
Next you'll configure, and then start up, the Beats.
Install and enable the Beats services
We'll follow the Getting Started Guide to install both Filebeat and Metricbeat. Because we're running on Ubuntu we'll install the Beats via the APT repository.
wget -qO - https://artifacts.elastic.co/GPG-KEY-elasticsearch | sudo apt-key add -
echo "deb https://artifacts.elastic.co/packages/7.x/apt stable main" | sudo tee -a /etc/apt/sources.list.d/elastic-7.x.list
sudo apt-get update
sudo apt-get install filebeat metricbeat
systemctl enable filebeat.service
systemctl enable metricbeat.service
Configure the Cloud ID of our Elasticsearch Service deployment
Copy the Cloud ID from the Elastic Cloud console, and use it to configure the output for Filebeat and Metricbeat.
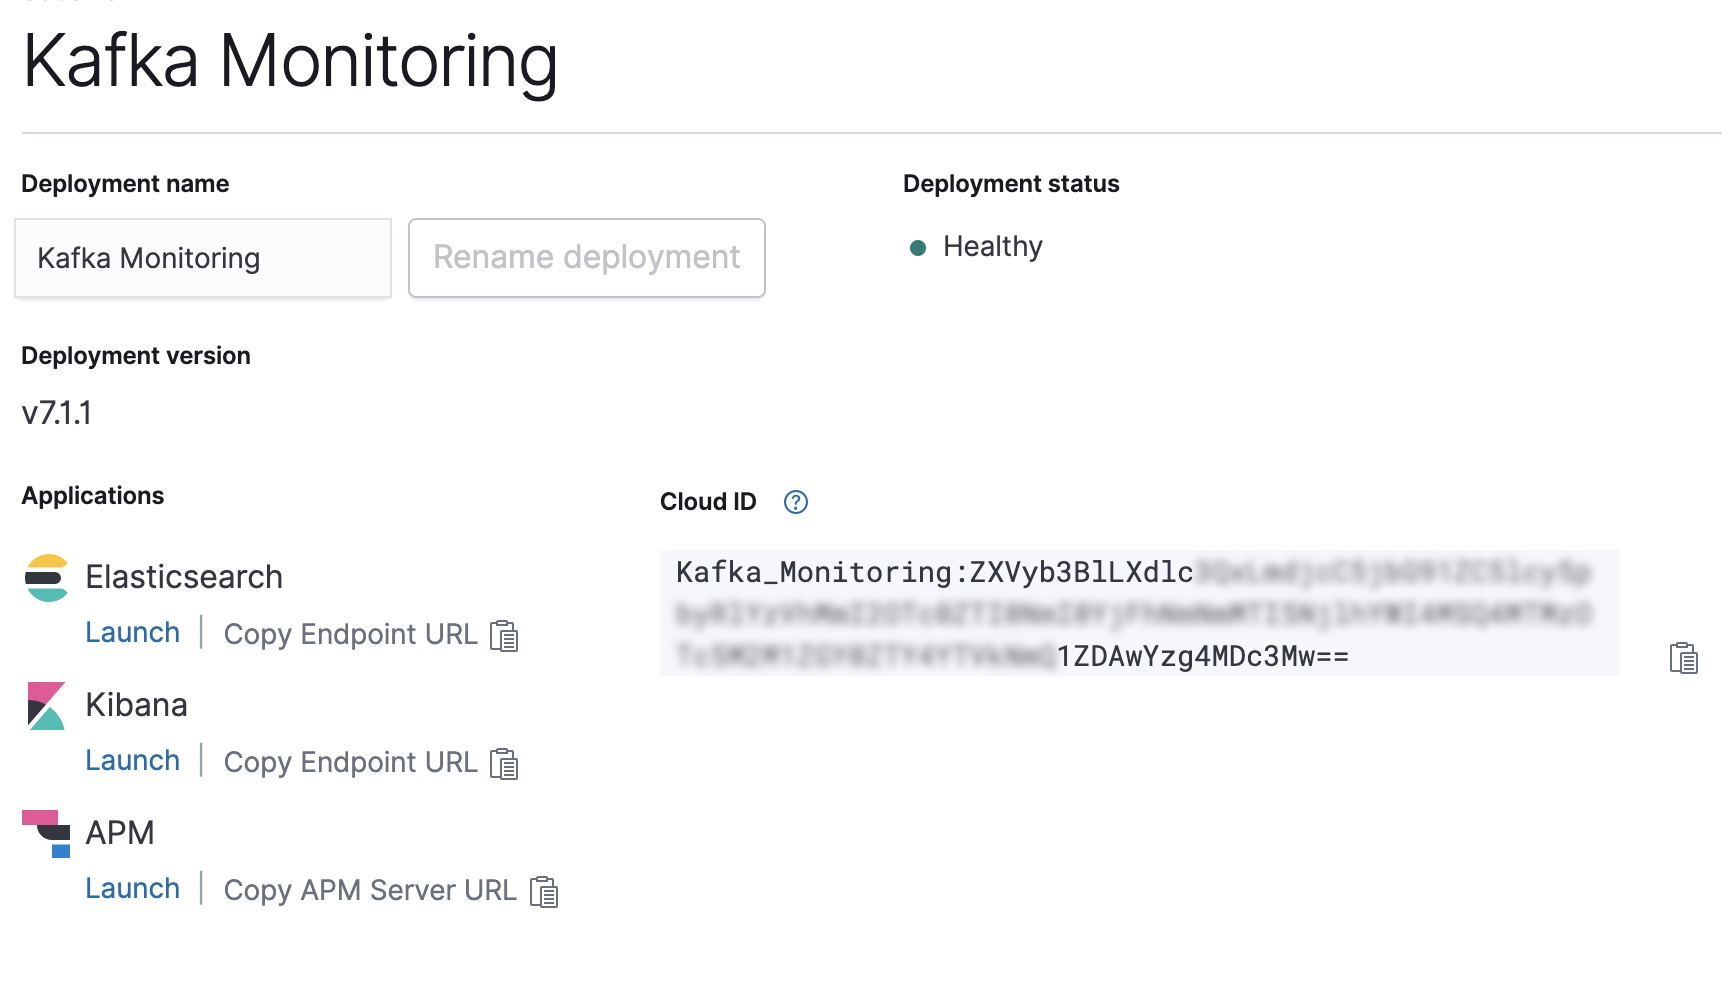
CLOUD_ID=Kafka_Monitoring:ZXVyb3BlLXdlc...
CLOUD_AUTH=elastic:password
filebeat export config -E cloud.id=${CLOUD_ID} -E cloud.auth=${CLOUD_AUTH} > /etc/filebeat/filebeat.yml
metricbeat export config -E cloud.id=${CLOUD_ID} -E cloud.auth=${CLOUD_AUTH} > /etc/metricbeat/metricbeat.yml
Enable the Kafka and System modules in Filebeat and Metricbeat
Next, we'll need to enable the Kafka and System modules for both of the Beats.
filebeat modules enable kafka system
metricbeat modules enable kafka system
Once enabled, we can run the Beats setup. This configures index templates and Kibana dashboards used by the modules.
filebeat setup -e --modules kafka,system
metricbeat setup -e --modules kafka,system
Start your Beats!
Ok, now that everything is configured, let's start up Filebeat and Metricbeat.
systemctl start metricbeat.service
systemctl start filebeat.service
Exploring the monitoring data
The default logging dashboard shows:
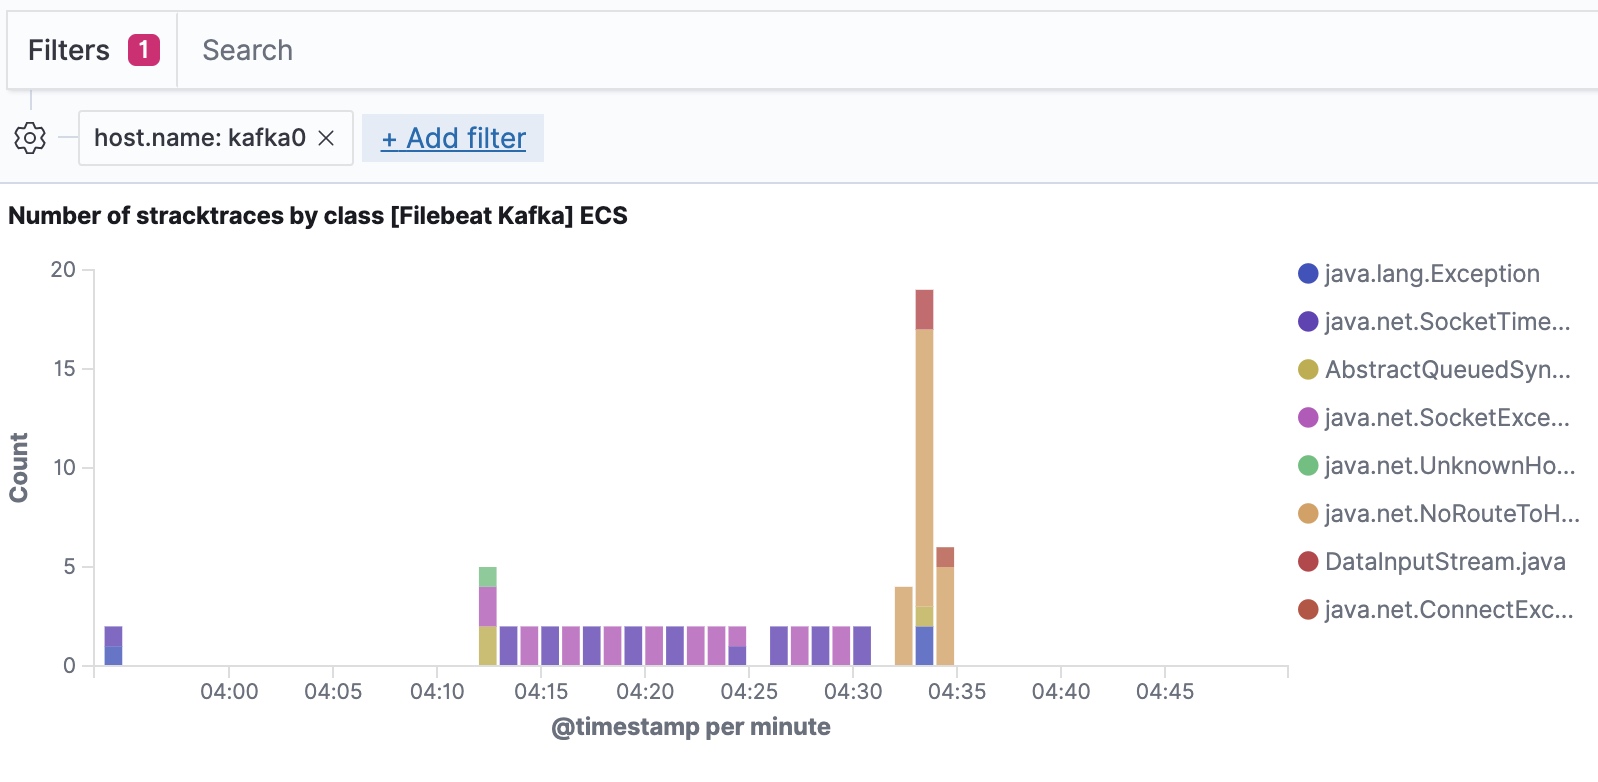
- Recent exceptions encountered by the Kafka cluster. Exceptions are grouped by the exception class and the full exception detail
- An overview of log throughput by level, along with the full log detail.
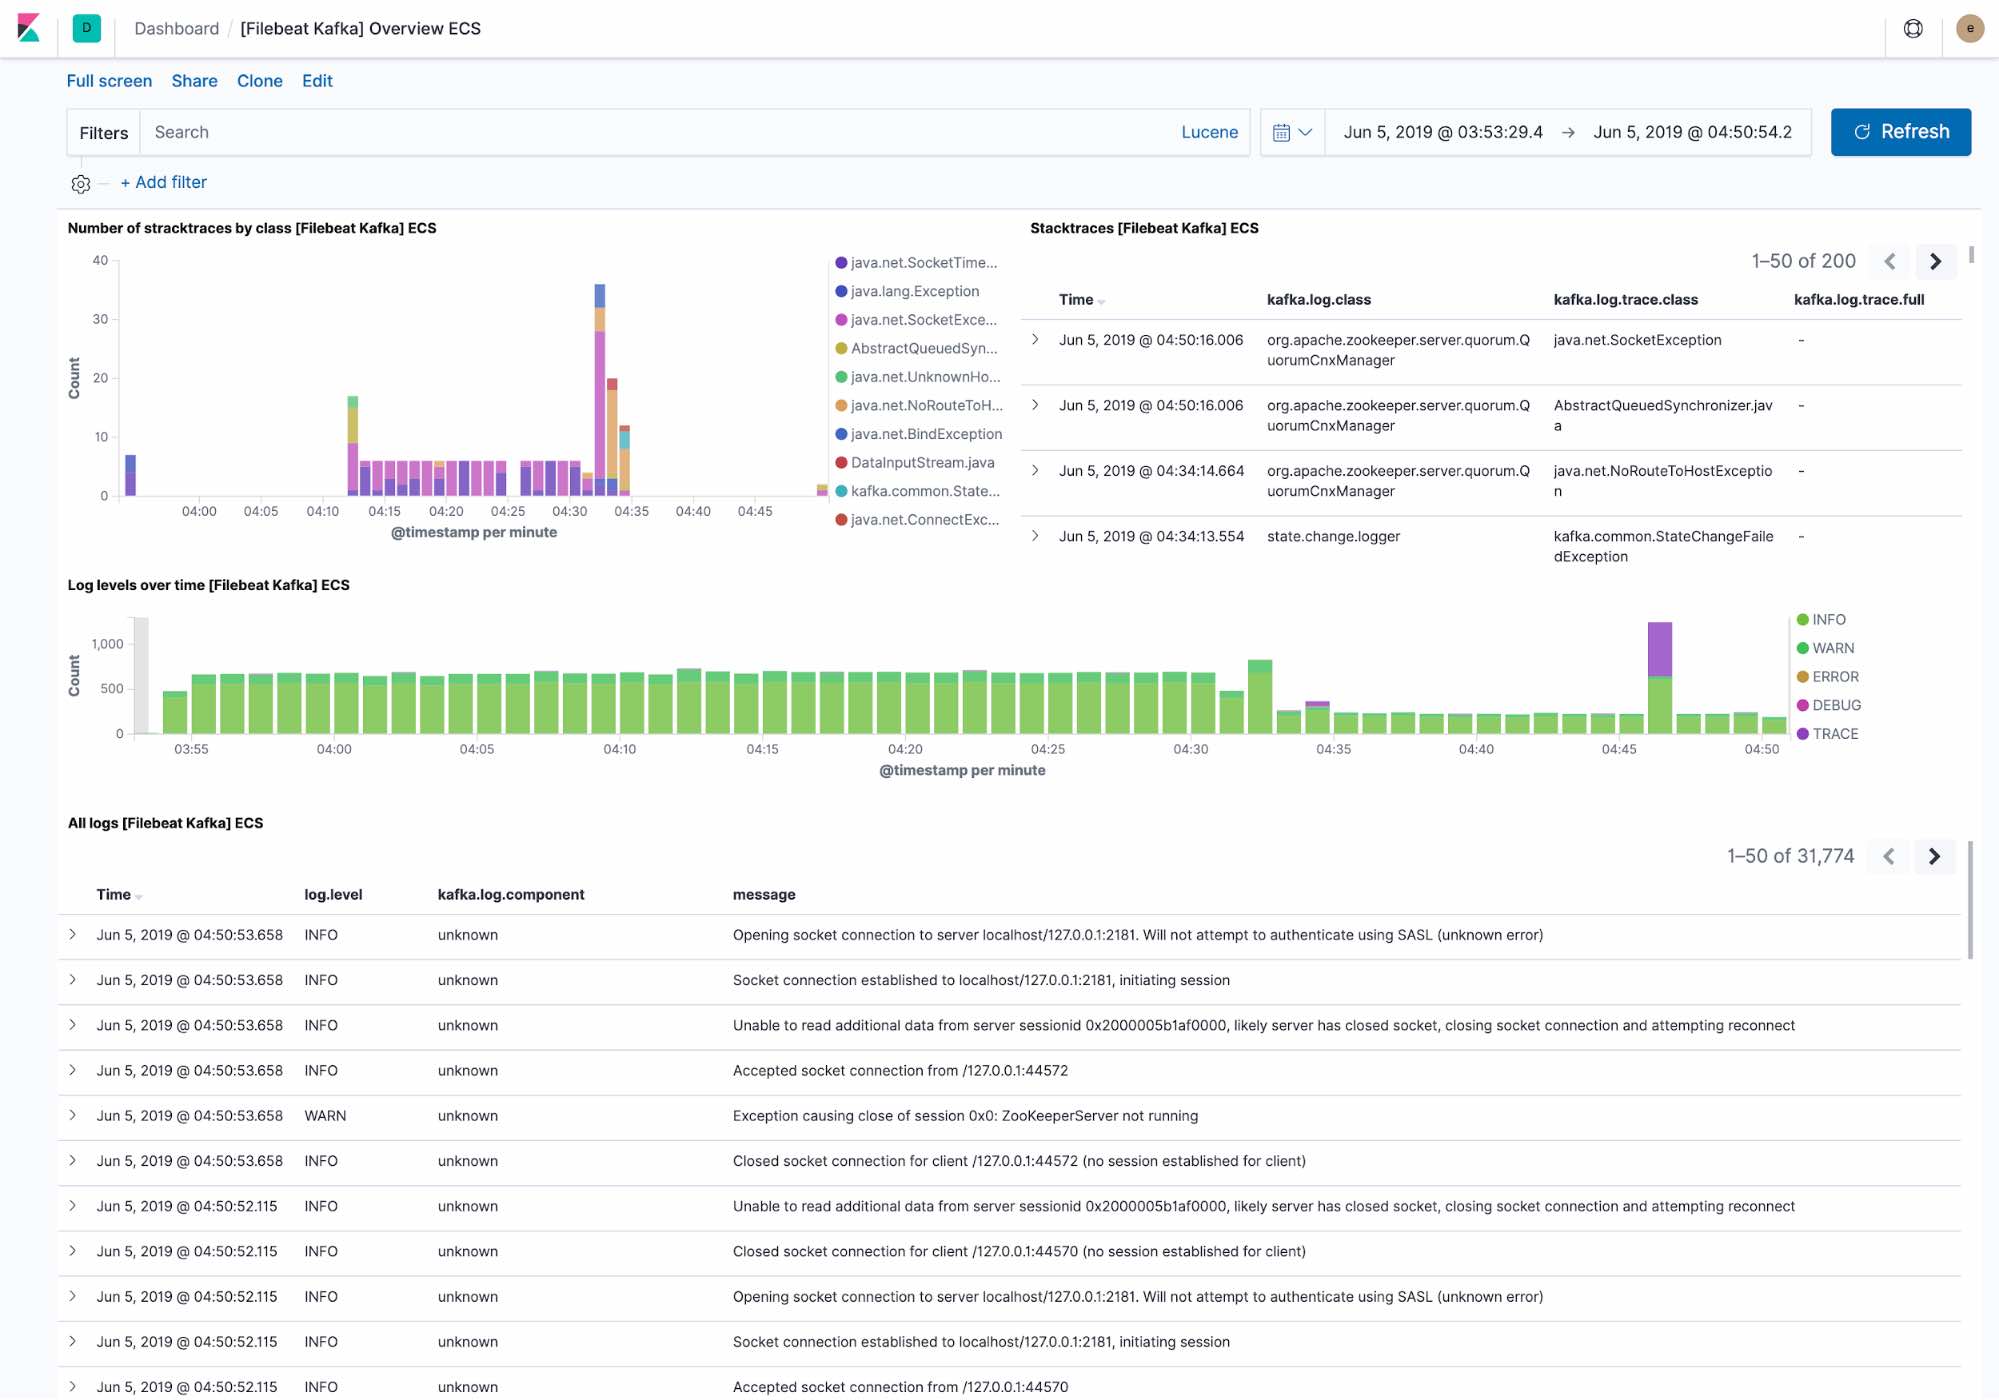
Filebeat ingests data following the Elastic Common Schema, allowing us to filter down to the host level.
The dashboard provided by Metricbeat shows the current state of any topics within the Kafka cluster. We also have a drop-down to filter the dashboard to a single topic.
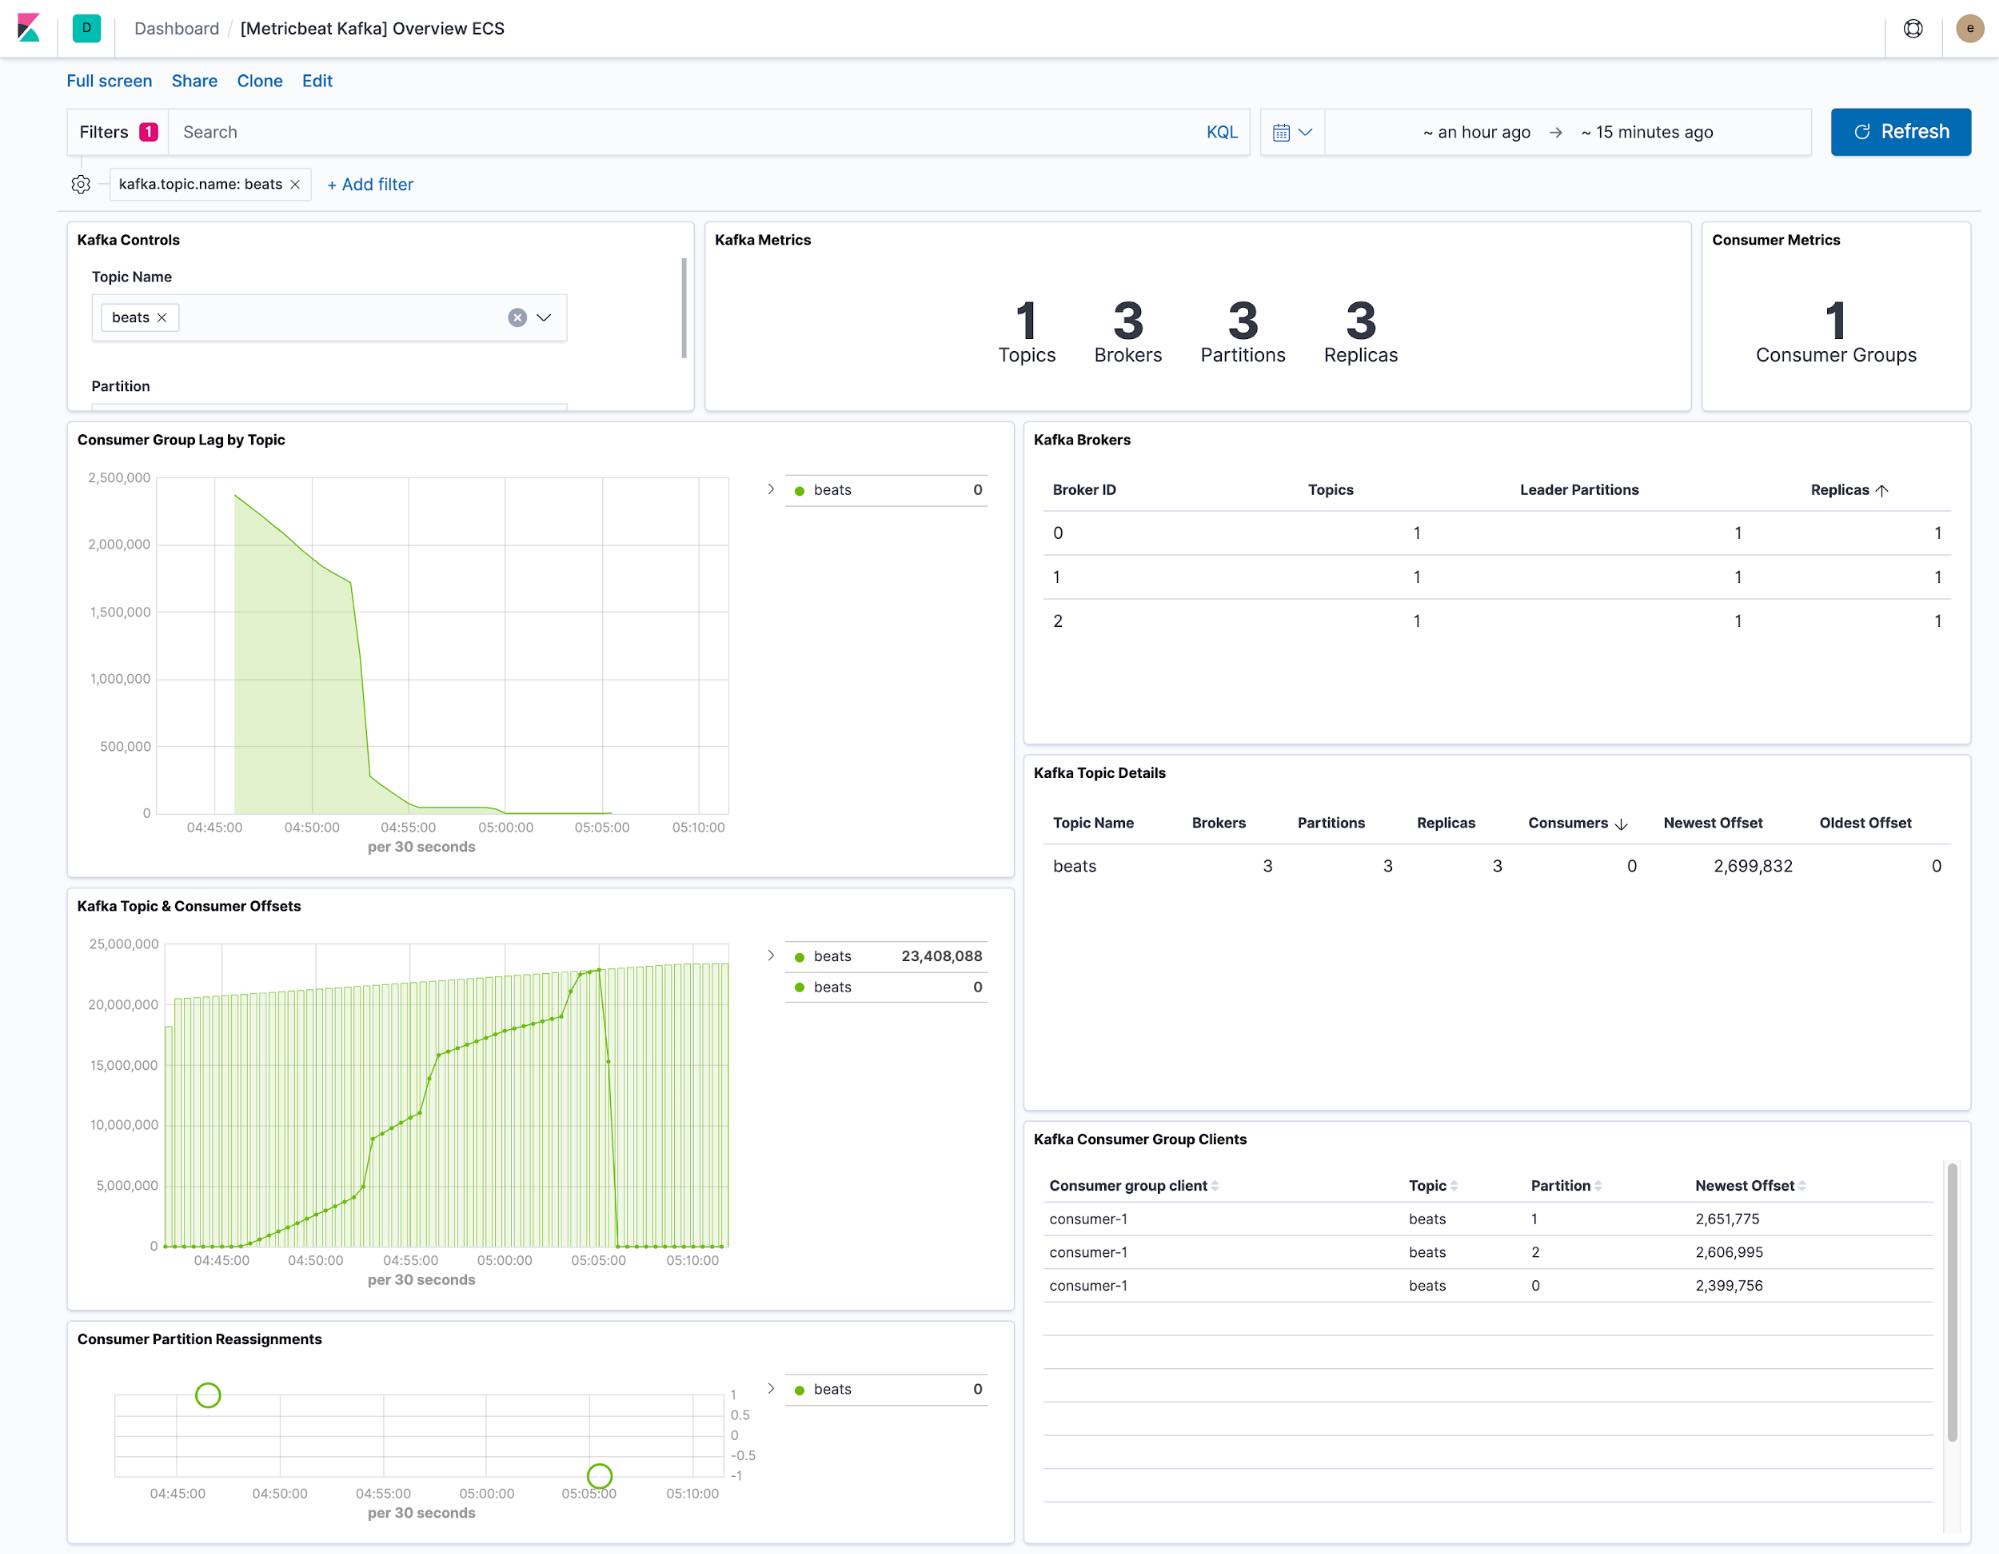
The consumer lag and offset visualisations show if consumers are falling behind specific topics. Per-partition offsets also show if a single partition is lagging behind.
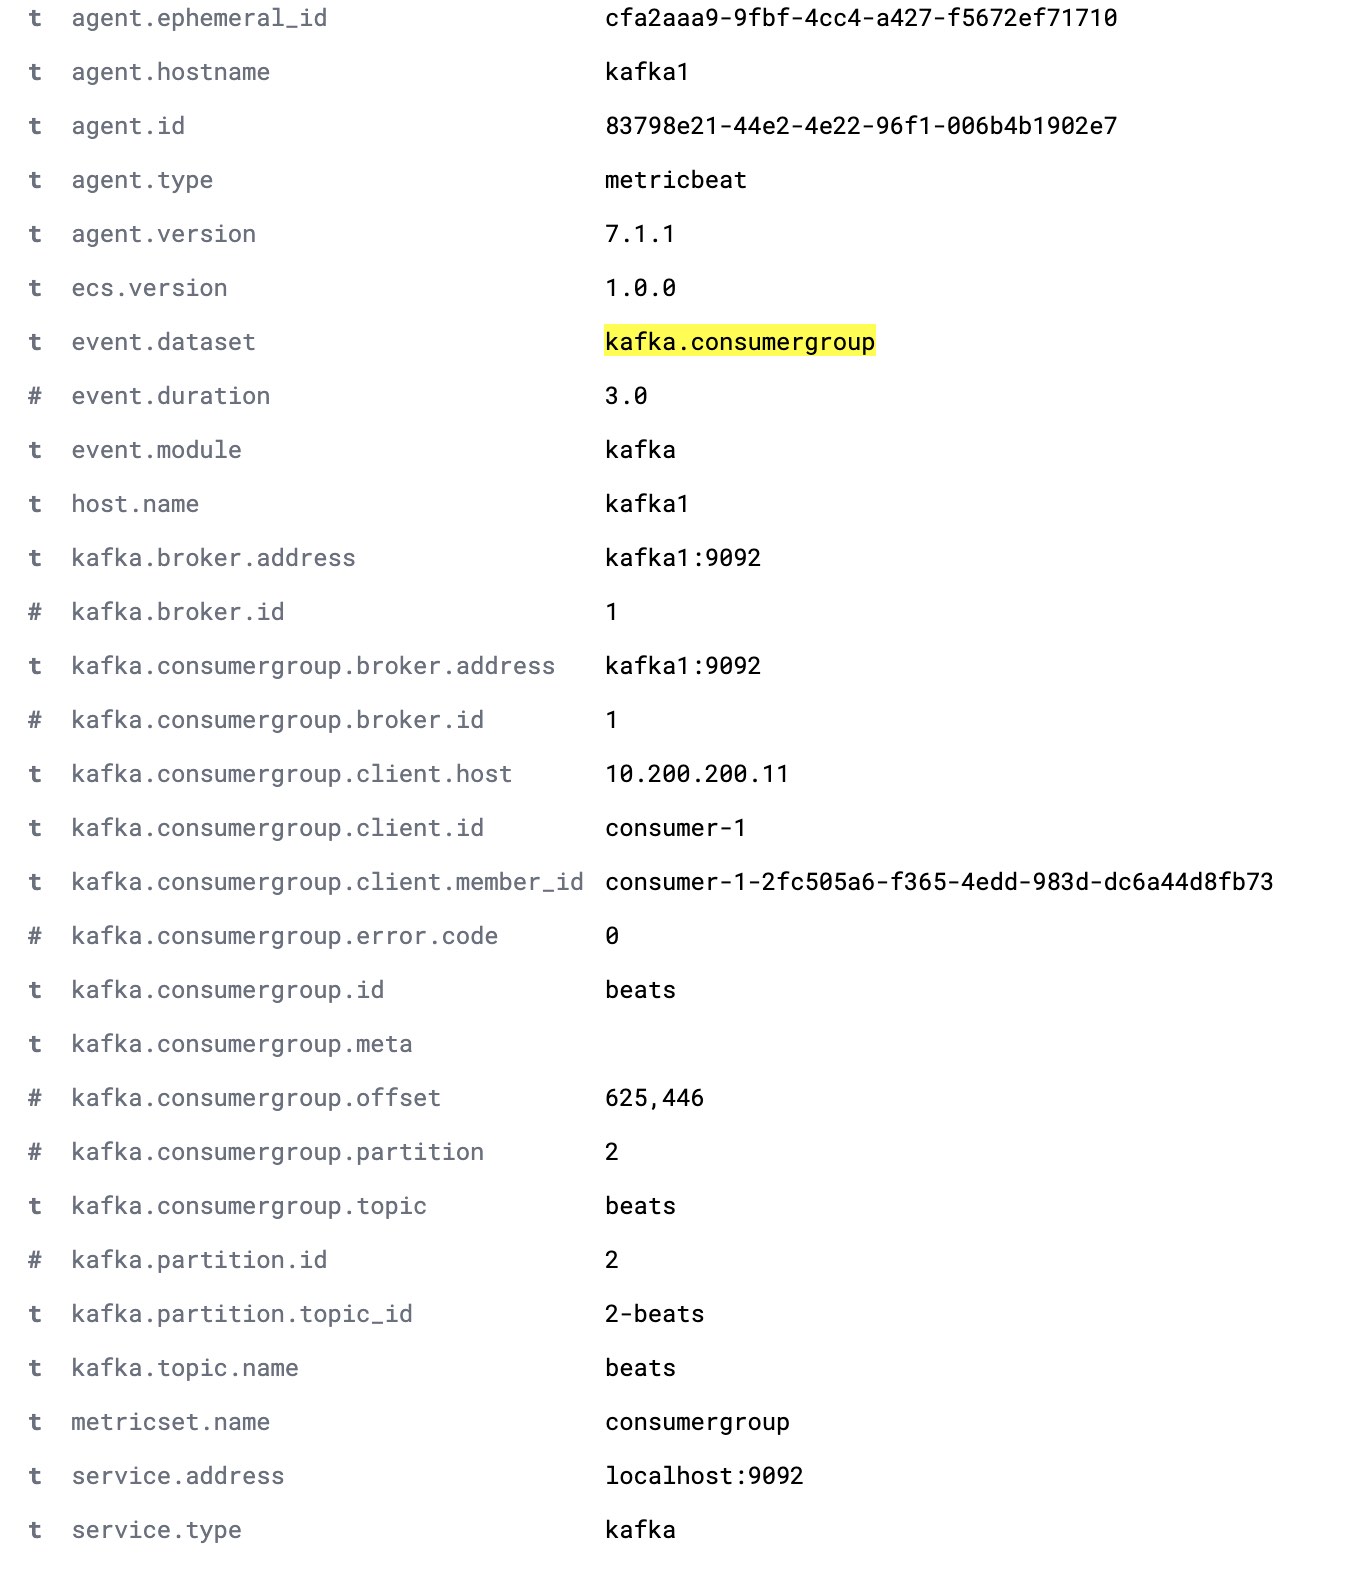
The default Metricbeat configuration collects two datasets, kafka.partition and kafka.consumergroup. These datasets provide insight into the state of a Kafka cluster and its consumers.
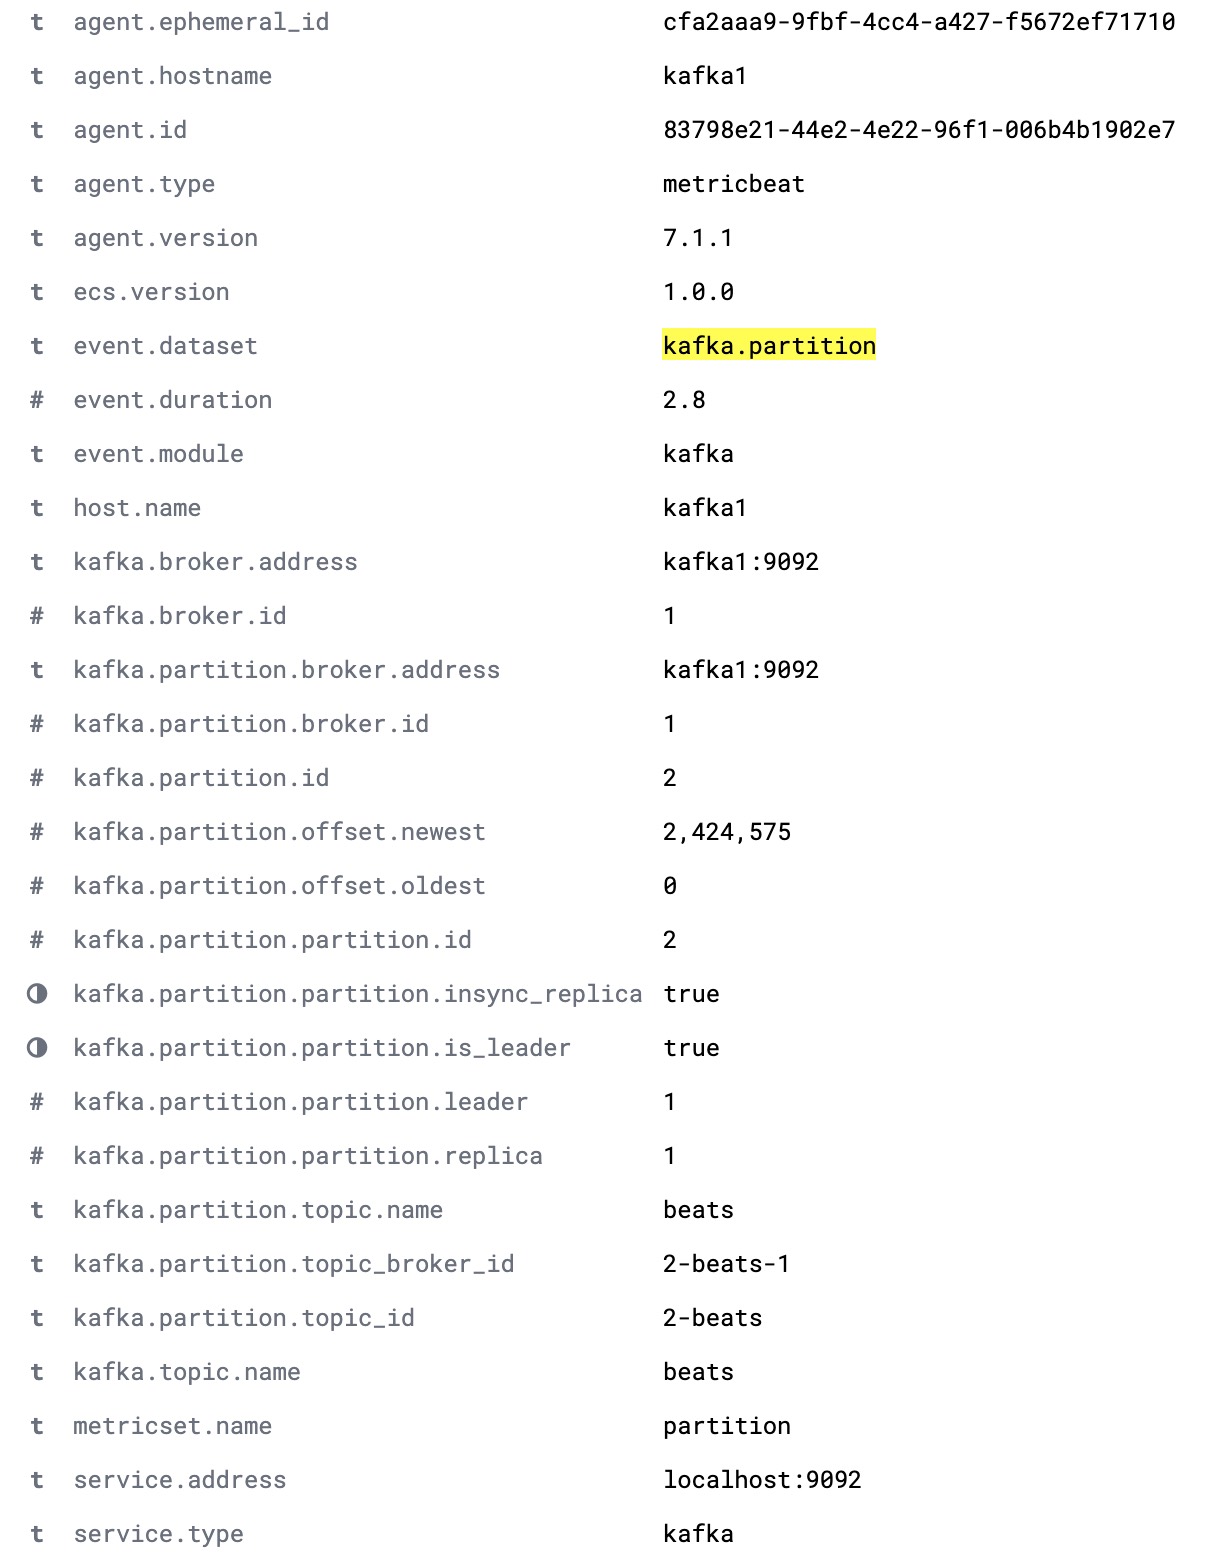
The kafka.partition dataset includes full details about the state of partitions within a cluster. This data can be used to:
- Build dashboards showing how partitions map to cluster nodes
- Alert on partitions without in-sync replicas
- Track partition assignment over time
- Visualise partition offset limits over time.
A complete kafka.partition document is shown below.
The kafka.consumergroup dataset captures the state of a single consumer. This data could be used to show which partitions a single consumer is reading from and the current offsets of that consumer.