Monitoring Kafka with Elastic Stack: Filebeat
|
Note: When using Elasticsearch 5.2 or later you can leverage Filebeat and Metricbeat modules to simplify the collection, parsing, and visualization of many common services, including Kafka logs and metrics. Check out Elastic Stack 6.5 release or later for Kafka 2.0 support. |
Kafka clusters provide a number of opportunities for monitoring. At the network level, you can monitor connections between Kafka nodes, Zookeeper, and clients. At the host level, you can monitor Kafka resource usage, such as CPU, memory and disk usage. And Kafka itself provides log files, an API to query offsets, and JMX support to monitor internal process metrics.
In this blog post, the first in a series that show you how to use Beats for monitoring a Kafka cluster, we’ll focus on collecting and parsing Kafka logs by using Filebeat and Elasticsearch Ingest Node. After indexing the Kafka logs into Elasticsearch, we’ll finish this post by building Kibana dashboards for visualizing the data.
This blog post is based on The Elastic Stack version 5.1.1. All configuration files, dashboards and sample log files can be found on github.
Cluster Setup
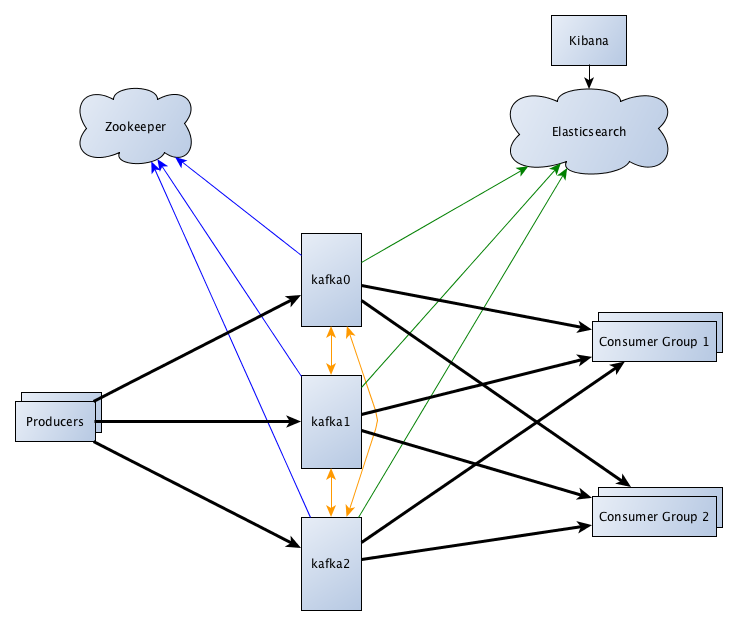
Our setup contains a Kafka cluster of 3 nodes named kafka0, kafka1, and kafka2. Each node runs Kafka version 0.10.1 and a set of Beats to monitor the node itself. The Beats will send all information collected to Elasticsearch. For visualization we will use Kibana.
Meanwhile producers and consumer groups are actively using the Kafka cluster.
Collecting Kafka Logs
We want to start by using Filebeat to collect the Kafka log files. Having installed Kafka to /opt/kafka, the log files will be written to /opt/kafka/logs. Additionally we’re going to collect some GC stats from /opt/kafka/logs/kafkaServer-gc.logs. With Filebeat just shipping log files as-is, we’ll use Elasticsearch Ingest Node to parse the log files before indexing.
Prepare Elasticsearch
Kafka logs by default contain the timestamp when the message was logged, the log level, the Java class responsible for the log message, the message, and an optional stacktrace. This information can be parsed using grok. We will start by configuring the kafka-logs ingest pipeline to parse the log messages, and extract the Java exception class and error messages:
$ curl -XPUT 'http://elasticsearch:9200/_ingest/pipeline/kafka-logs'  -d@kafka-logs.json
{"acknowledged" : true}
kafka-logs.json:
{
  "description": "Kafka Log Messages",
  "processors": [
    {
      "grok": {
        "field": "message",
        "trace_match": true,
        "patterns": [
          "(?m)%{TIMESTAMP_ISO8601:log-timestamp}. %{LOGLEVEL:level} +%{JAVALOGMESSAGE:message} \\(%{JAVACLASS:class}\\)$[ \\n]*(?'trace.full'.*)"
        ]
      }
    },
    {
      "grok": {
        "field": "message",
        "patterns": [
          "\\[%{DATA:component}][,:. ] +%{JAVALOGMESSAGE:message}"
        ],
        "on_failure": [
          {
            "set": {
              "field": "component",
              "value": "unknown"
            }
          }
        ]
      }
    },
    {
      "grok": {
        "field": "trace.full",
        "ignore_missing": true,
        "patterns": [
          "%{JAVACLASS:trace.class}:\\s*%{JAVALOGMESSAGE:trace.message}"
        ],
        "on_failure": [
          {
            "remove": {
              "field": "trace"
            }
          }
        ]
      }
    },
    {
      "rename": {
        "field": "@timestamp",
        "target_field": "beat.read_time"
      }
    },
    {
      "date": {
        "field": "log-timestamp",
        "target_field": "@timestamp",
        "formats": ["yyyy-MM-dd HH:mm:ss,SSS"]
      }
    },
    {"remove": {"field": "log-timestamp" }}
  ],
  "on_failure" : [{
    "set" : {
      "field" : "error.log",
      "value" : "{{ _ingest.on_failure_message }}"
    }
  }]
}
Next we want to set up a second ingest pipeline that extracts garbage collection stats like the amount of memory used before and after garbage collection and the pause times:
$ curl -XPUT 'http://elasticsearch:9200/_ingest/pipeline/kafka-gc-logs' -d@kafka-gc-logs.json
{"acknowledged" : true}
The pipeline uses Painless to convert some values and compute delta values on memory usage before and after garbage collection.
kafka-gc-logs.json:
{
  "description": "Kafka GC Logs",
  "processors": [
    {
      "grok": {
        "field": "message",
        "patterns": [
          "(?m)%{TIMESTAMP_ISO8601:log-timestamp}:.*GC pause.*, %{NUMBER:gc_pause:float}.*Eden: %{MEM:eden.before.used}\\(%{MEM:eden.before.total}\\)->%{MEM:eden.after.used}\\(%{MEM:eden.after.total}\\).*Survivors: %{MEM:survivors.before.used}->%{MEM:survivors.after.used}.*Heap: %{MEM:heap.before.used}\\(%{MEM:heap.before.total}\\)->%{MEM:heap.after.used}\\(%{MEM:heap.after.total}\\).*Times: user=%{NUMBER:time.user.sec:float}.*sys=%{NUMBER:time.sys.sec:float}.*real=%{NUMBER:time.real.sec:float}"
        ],
        "pattern_definitions": {
          "MEM": "%{NUMBER}%{MEM_UNIT}",
          "MEM_UNIT": "B|K|M|G"
        }
      }
    },
    {
      "script": {
        "lang": "painless",
        "inline": "def getBytes(def x) {def last = x.length() - 1; def sizes = ['B': 1, 'K': 1024, 'M': 1048576, 'G': 1073741824]; return (Float.parseFloat(x.substring(0, last)) * sizes[x.substring(last)]).longValue();} def toBytes(def c, def field) {c[field] = getBytes(c[field]);} def stToBytes(def c, def subs, def fields) {for (def s : subs) {for (def field : fields) {toBytes(c[s], field);}} return true;} for (def kv : params.fields.entrySet()) { if (ctx.containsKey(kv.getKey())) { stToBytes(ctx[kv.getKey()], ['before', 'after'], kv.getValue()) }}",
        "on_failure" : [
          {
            "set" : {
              "field" : "error.conv",
              "value" : "{{ _ingest.on_failure_message }}"
            }
          }
        ],
        "params": {
          "fields": {
            "eden": ["total", "used"],
            "survivors": ["used"],
            "heap": ["total", "used"]
          }
        }
      }
    },
    {
      "script": {
        "lang": "painless",
        "inline": "for (def kv : params.fields.entrySet()) { if (ctx.containsKey(kv.getKey())) { def d = ctx[kv.getKey()]; d.delta = new HashMap(); for (def k : kv.getValue()) {d.delta[k] = d.before[k] - d.after[k];}}}",
        "on_failure" : [
          {
            "set" : {
              "field" : "error.delta",
              "value" : "{{ _ingest.on_failure_message }}"
            }
          }
        ],
        "params": {
          "fields": {
            "eden": ["total", "used"],
            "heap": ["total", "used"],
            "survivors": ["used"]
          }
        }
      }
    },
    {
      "script": {
        "lang": "painless",
        "on_failure" : [
          {
            "set" : {
              "field" : "error.gc_pause",
              "value" : "{{ _ingest.on_failure_message }}"
            }
          }
        ],
        "inline": " if (ctx.containsKey('gc_pause')) { ctx.gc_pause_us = (long)(ctx.gc_pause * 1000000) }"
      }
    },
    {
      "rename": {
        "field": "@timestamp",
        "target_field": "beat.read_time"
      }
    },
    {
      "date": {
        "field": "log-timestamp",
        "target_field": "@timestamp",
        "formats": ["ISO8601"]
      }
    },
    {"remove": {"field": "message" }},
    {"remove": {"field": "log-timestamp" }},
    {"remove": {"field": "gc_pause" }}
  ],
  "on_failure" : [{
    "set" : {
      "field" : "error.pipeline",
      "value" : "{{ _ingest.on_failure_message }}"
    }
  }]
}
Because the ingest pipelines adds many new fields, we need to adapt the default Filebeat index template. The default index template is found in filebeat.template.json. We will copy the file to fb-kafka.template.json and update the "beats" properties to include the "beats.read_time" value:
"beat": {
  "properties": {
    "hostname": {
      "ignore_above": 1024,
      "type": "keyword"
    },
    "name": {
      "ignore_above": 1024,
      "type": "keyword"
    },
    "version": {
      "ignore_above": 1024,
      "type": "keyword"
    },
    "read_time": {
      "type": "date"
    }
  }
},
And include the new top-level fields:
"component": {
  "ignore_above": 1024,
  "type": "keyword"
},
"level": {
  "ignore_above": 1024,
  "type": "keyword"
},
"class": {
  "norms": false,
  "type": "text"
},
"trace": {
  "properties": {
    "class": {
      "norms": false,
      "type": "text"
    },
    "message": {
      "norms": false,
      "type": "text"
    },
    "full": {
      "norms": false,
      "type": "text"
    }
  }
},
"gc_pause_us": {"type": "long"},
"eden": {
  "properties": {
    "before": {
      "properties": {
        "total": {"type": "long"},
        "used": {"type": "long"}
      }
    },
    "delta": {
      "properties": {
        "total": {"type": "long"},
        "used": {"type": "long"}
      }
    },
    "after": {
      "properties": {
        "total": {"type": "long"},
        "used": {"type": "long"}
      }
    }
  }
},
"heap": {
  "properties": {
    "before": {
      "properties": {
        "total": {"type": "long"},
        "used": {"type": "long"}
      }
    },
    "delta": {
      "properties": {
        "total": {"type": "long"},
        "used": {"type": "long"}
      }
    },
    "after": {
      "properties": {
        "total": {"type": "long"},
        "used": {"type": "long"}
      }
    }
  }
},
"survivors": {
  "properties": {
    "before": {
      "properties": {
        "used": {"type": "long"}
      }
    },
    "delta": {
      "properties": {
        "used": {"type": "long"}
      }
    },
    "after": {
      "properties": {
        "used": {"type": "long"}
      }
    }
  }
},
We want to store all Kafka logs in the "kafkalogs-*" index. That is, we will have to change the template setting as well:
"template": "kafkalogs-*"
We’ve already prepared an index template, so we will install it right away:
$ curl -XPUT 'http://elasticsearch:9200/_template/kafkalogs' -d@fb-kafka.template.json
{"acknowledged" : true}
Install and Configure Filebeat
Now that Elasticsearch is ready to index Kafka logs, we will install and configure Filebeat next. Installation and configuration instructions can be found in the Getting Started Guide. Because we are running Kafka on Ubuntu, we will use the deb file to install Filebeat:
$ curl -L -O https://artifacts.elastic.co/downloads/beats/filebeat/filebeat-5.1.1-amd64.deb
$ sudo dpkg -i filebeat-5.1.1-amd64.deb
Having installed Filebeat, we will proceed by configuring the prospectors to tail the Kafka log files:
kafka.home: /opt/kafka
filebeat.prospectors:
- input_type: log
  # kafka log files prospector
  paths:
    - ${kafka.home}/logs/controller.log*
    - ${kafka.home}/logs/server.log*
    - ${kafka.home}/logs/state-change.log*
    - ${kafka.home}/logs/kafka-*.log*
  # match multiline events
  multiline.pattern: '^\['
  multiline.negate: true
  multiline.match: after
  # configure pipeline
  fields.pipeline: kafka-logs
Multiline support for capturing stacktraces is configured to combine all lines not beginning with ‘[‘ into one single document.
We also configured a custom field called fields.pipeline set to kafka-logs. This is the ingest node pipeline ID that we will use in the Elasticsearch output to select the pipeline.
In a similar vein, we will set up a prospector for the Kafka garbage collection logs:
- input_type: log
  # kafka gc log prospector
  paths:
    - ${kafka.home}/logs/kafkaServer-gc.log
  # match multiline events
  multiline.pattern: '^\s'
  multiline.negate: false
  multiline.match: after
  # include only 'GC pause' stats
  include_lines: ['GC pause']
  # configure pipeline
  fields.pipeline: kafka-gc-logs
Last but not least, we will configure the Elasticsearch output to index new documents into the kafkalogs daily index and use the prospector’s pipeline field to select the ingest node pipeline to use.
output.elasticsearch:
  # Array of hosts to connect to.
  hosts: ["elasticsearch:9200"]
  index: 'kafkalogs-%{+yyyy.MM.dd}'
  pipeline: '%{[fields.pipeline]}'
Finally we will restart Filebeat and enable the Filebeat service to start at system startup.
$ sudo systemctl restart filebeat.service
$ sudo systemctl enable filebeat.service
Using Kibana
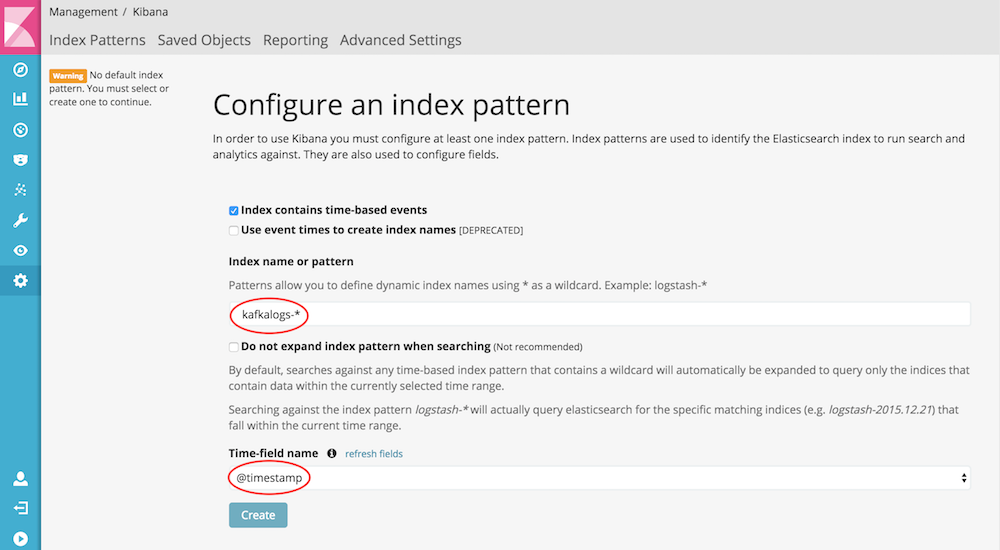
To use the data in Kibana, we'll configure an index pattern for kafkalogs-*. These configurations are at Management -> Index Pattern. If you’re starting up Kibana for the first time, you will be asked to configure an index pattern right away.
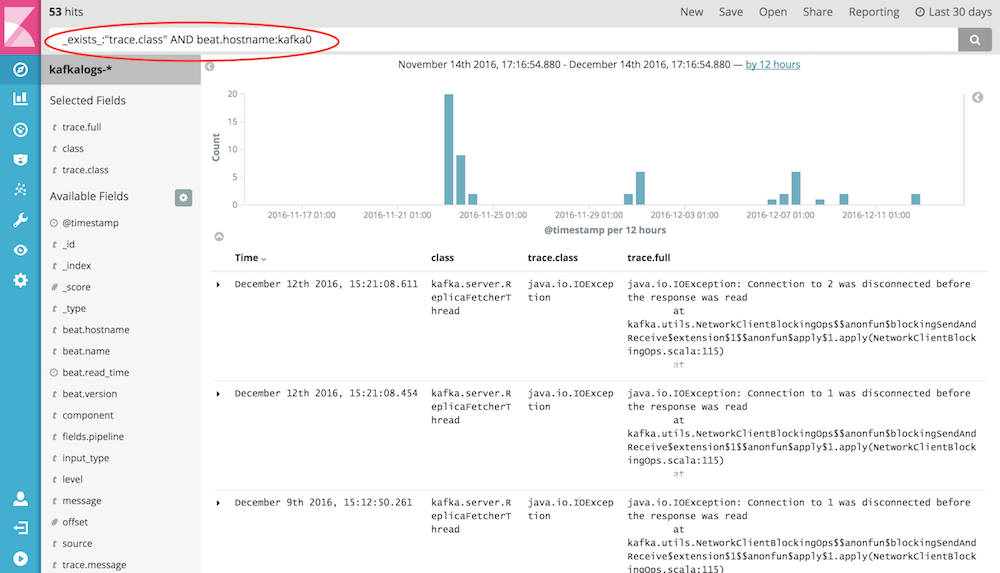
To explore the logs we’ve collected, we can use the Discover View. The search bar allows us to explore the logs by hostname, log message, or log level.
Kafka Logs Dashboard
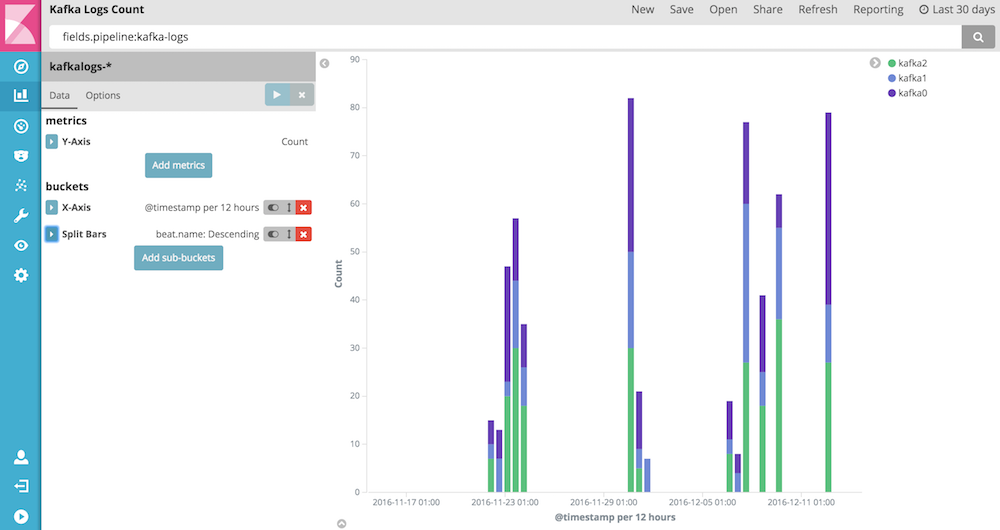
For building Dashboards we can save searches from the Discover View and build graphs by using the Visualize View. The first dashboard will be about the kafka logs. It displays a table of log messages with optional stack traces and bar charts counting the number of log entries and stack traces by top 5 Kafka nodes and top 5 Kafka components. By using the bar charts, we can easily see if logs for one or all Kafka nodes suddenly increased, indicating potential problems, or stayed more or less constant. The stack trace graphs can further indicate some more relevant errors being logged. By clicking on the bars, log message can be filtered by Kafka node or components.
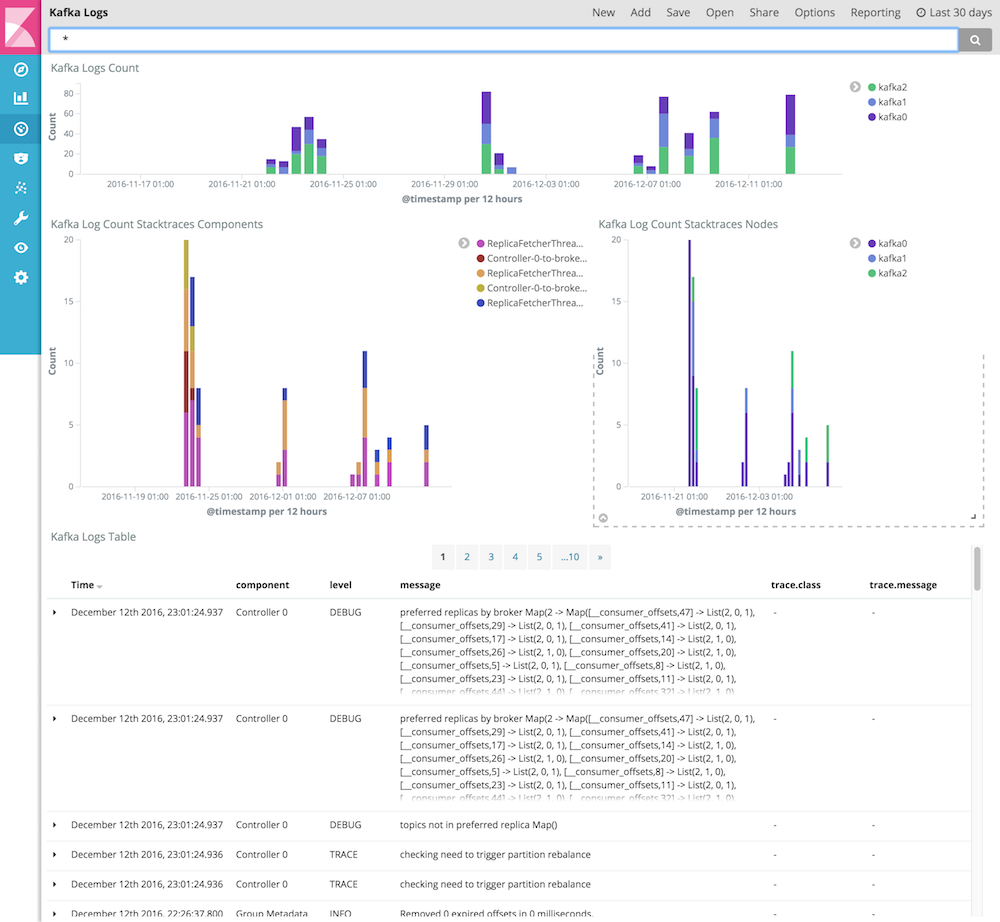
For building the table, in Discover we will filter for fields.pipeline:kafka-logs and select the fields component, level, message, trace.class, and trace.message by clicking the add button next to the labels on the left side.
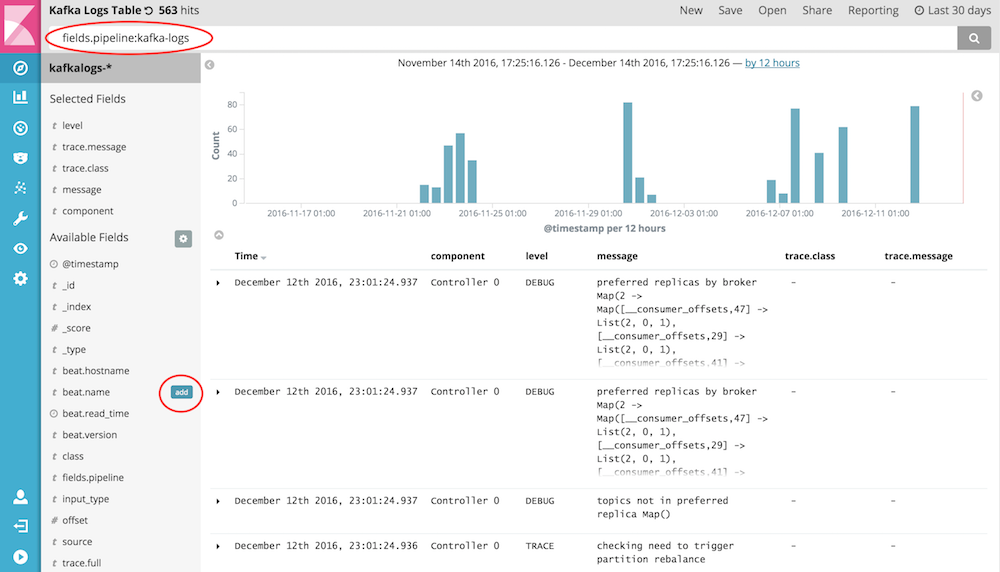
Save the search as "Kafka Logs Table" and add it to the dashboard.
In Visualize we create a new "Vertical bar chart" that counts the number of log messages. In the search bar, we use the filter fields.pipeline:kafka-logs to filter for messages from log files only.
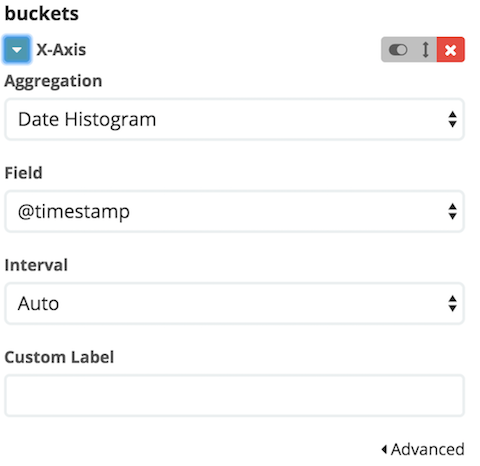
Next we configure the "Date Histogram" and split the graph by selecting "Split Bars".
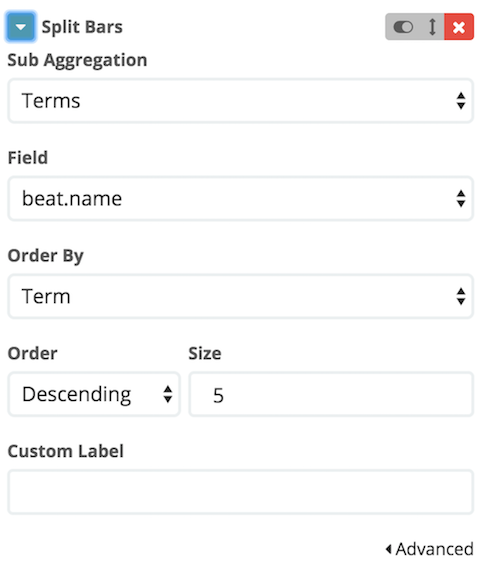
We use the "Terms" aggregation to split by 5 on beat.name, and we save the visualization as "Kafka Logs Count":
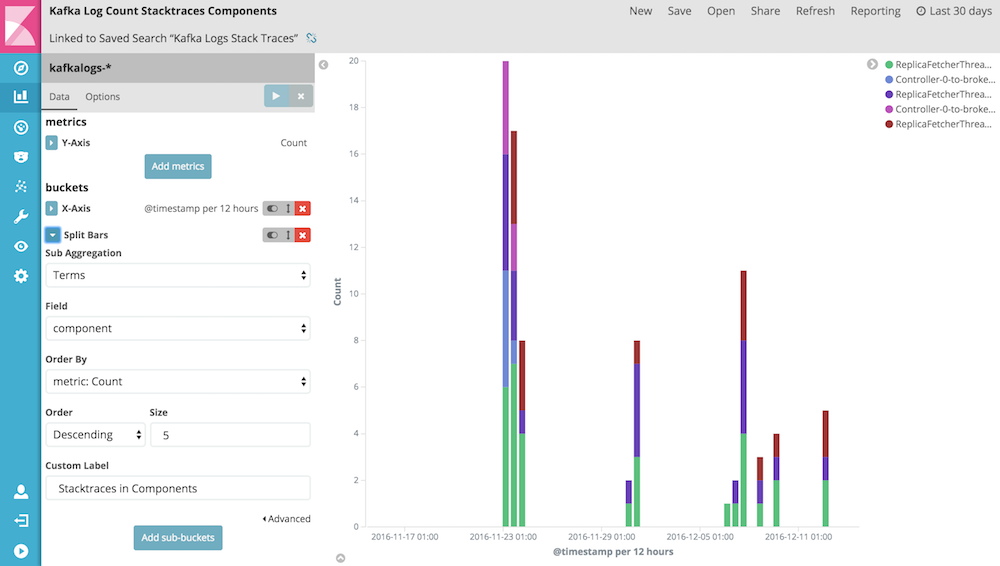
In a similar vein, we create the "Kafka Log Count Stacktraces Components" visualization to count the number of logs with Java exceptions per Kafka component:
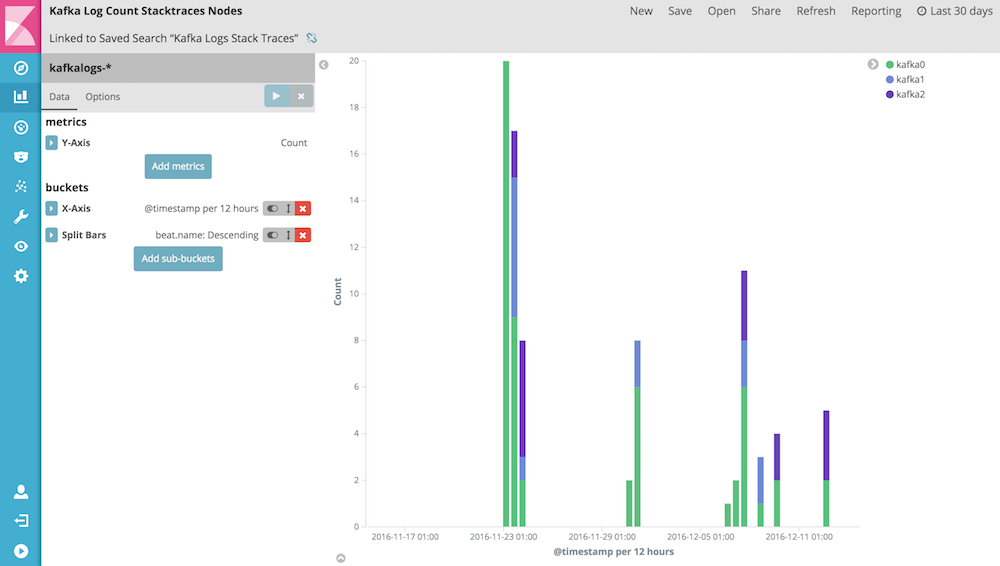
And we create the "Kafka Log Count Stacktraces Nodes" visualization to count the number of logs with Java exceptions per Kafka node:
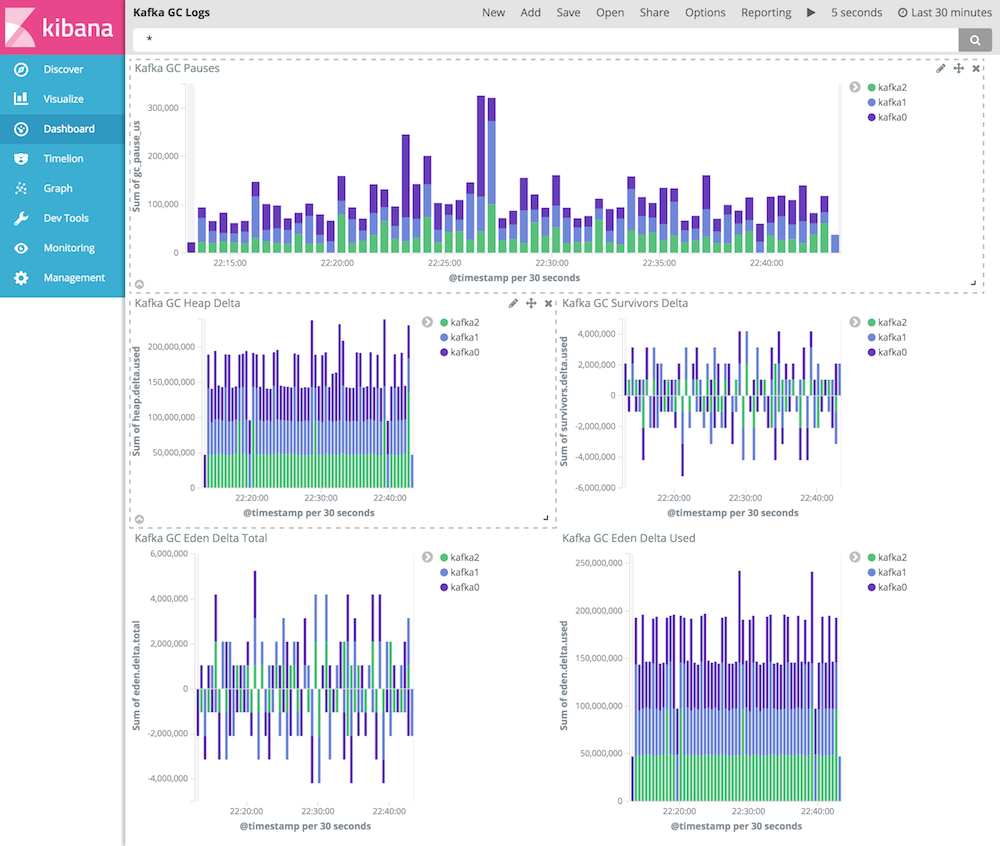
Kafka GC Logs Dashboard
Because we’ve also collected the Kafka GC logs, we can display some of the collected metrics. This dashboard aggregates the number of garbage collection cycles per Kafka node, summing the pauses introduced due to garbage collection and amount of memory being freed per cycle.
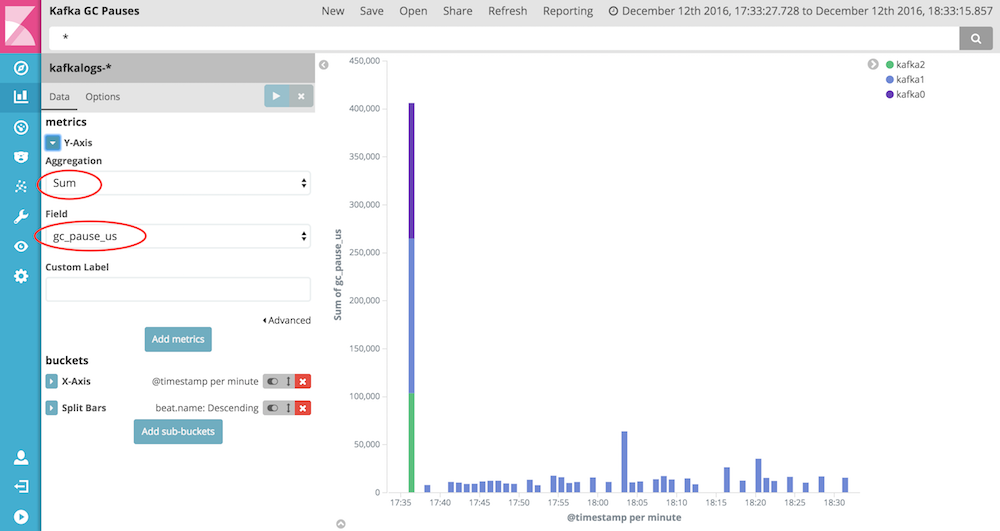
The graphs we build are similar to the graphs in the Kafka Logs Dashboard. But this time we will use the "Sum" aggregation on the Y-Axis.
Every graph shown in the dashboard aggregates another metric, like gc_pause_us, heap.delta.used, survivors.delta.used, eden.delta.total, and eden.delta.used. The delta values show the difference in memory usage before and after garbage collection. A positive value indicates memory being freed, and a negative value indicates more memory being used. For example a negative Survivors value would indicate more objects being moved from eden space to survivors space, than have been collected from survivor space itself.
Dashboard Exercises
The dashboards and visualisations shown here are just the beginning. For example try to extend the "Kafka Logs" dashboards to graph the log levels as well. Also having an overview of Errors and Warning can be helpful to navigate to a time window of an incident happening.
Extend the "Kafka GC Logs" Dashboard to display the Heap memory used after a garbage collection cycle. To do so, create a "Line Chart" computing the "Average" heap.after.used field and split the lines by beat.name to show the chart per Kafka node. This chart is great to visualize actual heap memory usage over time.
Next
In this first part of Kafka monitoring with Beats, we showed how to collect and parse Kafka log files by using Filebeat and Elasticsearch Ingest Node. Alternatively to using Ingest Node, all parsing and processing could have been handled by Logstash instead.
In the next installment we will continue with Metricbeat for collecting system metrics, as well as metrics directly from Kafka about partitions and consumer groups.