Blog
NVIDIA, Elastic, and other industry leaders are founding members of an innovative movement building tools to advance open innovation, shared progress, and trust in AI.
Top stories
Solutions
Search
.png)
Q&A: How Elastic and Anyshift are bringing AI-powered context to incident response
Through a new integration with Elastic, Anyshift’s AI agent, Annie, can read from a customer’s Elasticsearch deployment to search logs, surface error and warning spikes, and correlate log evidence with infrastructure change history. Read the blog.

Observability
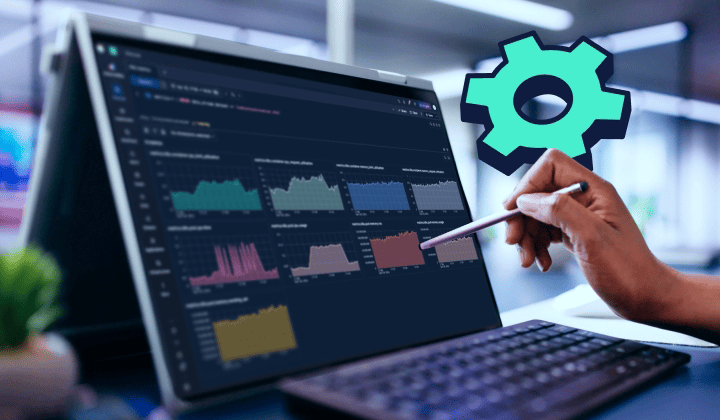
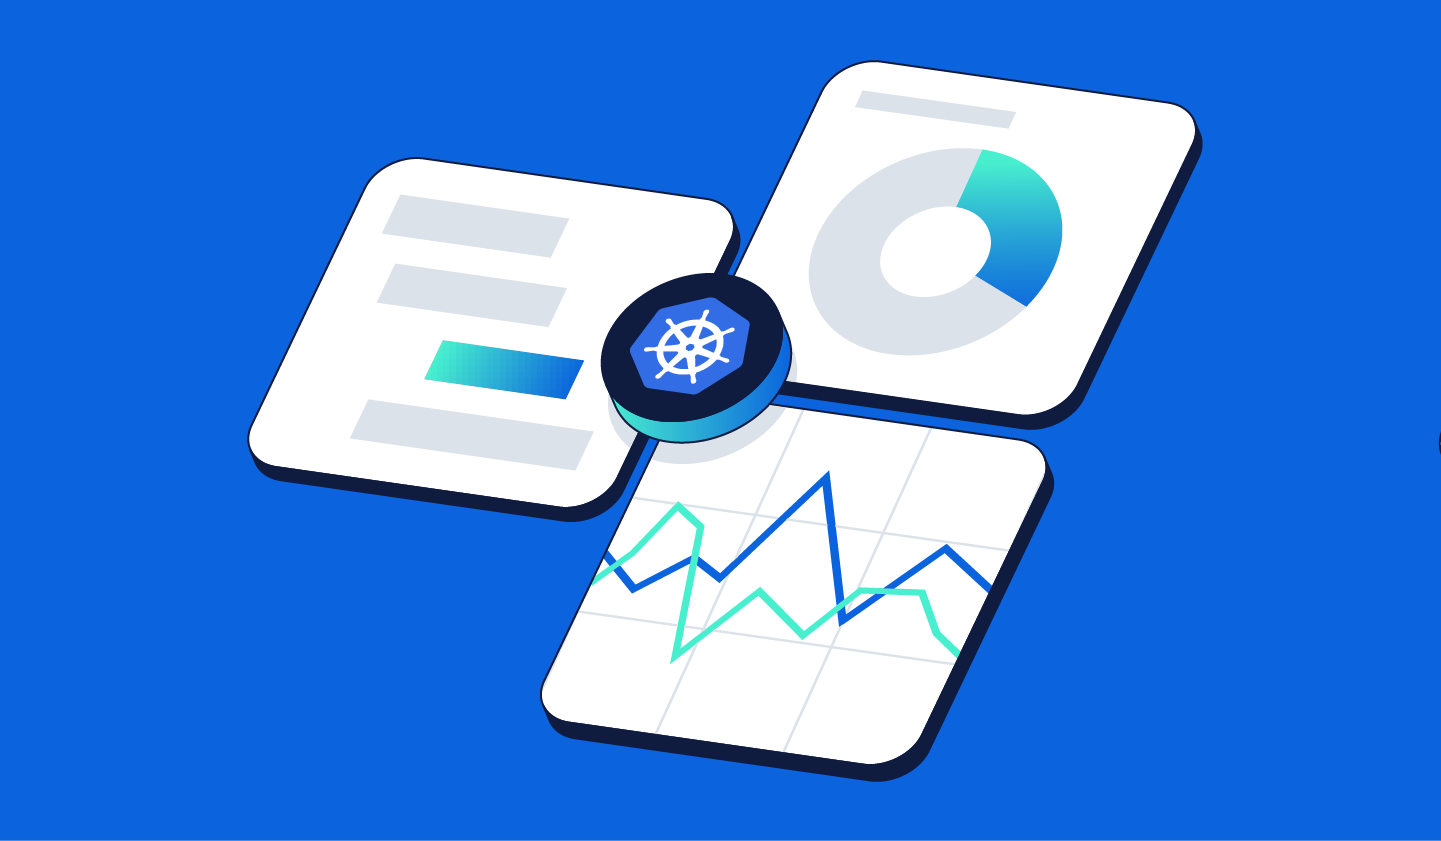
Elastic’s new metrics capabilities will dramatically improve uptime for public sector IT
The new columnar metrics engine in Elastic Observability enables public sector IT teams to combine logging, metrics, and traces in one platform. As a result, SREs can improve uptime while protecting taxpayer dollars in the process.
.png)
Elastic Stack + Cloud
.png)
How migrating to Elastic Security helped a digital safety software company cut incidents by 85% with UnderDefense
UnderDefense, an Elastic partner, migrated a two-person security team from a noisy legacy QRadar to Elastic Security on AWS, cutting incident volume 85%, reducing MTTR 61%, and delivering audit-ready retention with 25 purpose-built dashboards.


Elastic Security is now a native, embedded security layer for GDC air-gapped environments — bringing its agentic SecOps platform to government, defense, finance, and telecom teams running workloads disconnected from the public internet.
Elastic has achieved the AWS AI Security Distinction, awarded to partners with tech depth and real customer outcomes in AI and security. Elastic Security includes an AI agent, Elastic Workflows, LLM security detections, and agentic SOC capabilities.

Elastic was named a Leader in the Gartner® Magic Quadrant™ for Observability Platforms. In our opinion, Elastic Observability helps teams investigate faster with agentic AI with full context and reduces costs with efficient metrics and logs storage.
_(1).png)
Customers

_(1).png)
Elastic sponsored UNIHACK 2026, where over 50 teams used Elasticsearch and vector databases to move beyond basic LLMs into professional AI workflows. Projects used hybrid search and geospatial data to deliver scalable solutions for complex problems.
.png)
.png)
.png)
.png)