Introducing the Elasticsearch vector tile search API

 Share on Twitter
Share on Twitter

 Share on LinkedIn
Share on LinkedIn

 Share on Facebook
Share on Facebook

 Share by Email
Share by Email

 Print this page
Print
Elasticsearch 7.15 introduces a new endpoint that generates vector tiles from geospatial data stored in Elasticsearch. This provides a new and much more efficient way to render geospatial data.
Building on developments over several years, Elasticsearch provides users with a mature technology to filter and aggregate geospatial data. Common to the geospatial use case, visualizing high volumes of geospatial data is still a challenging problem, particularly for applications that use map technologies on the front end. Before 7.15, the main pain points were:
- Retrieving full geometries from Elasticsearch documents was inefficient, as maps don't generally need the full resolution of all geo shapes
- GeoJSON is not the best technology to render high volumes of complex geospatial data
To address these pain points, Elasticsearch made improvements to map tiling via the implementation of vector tiles and the new vector tile search API.
Map tiling is a strategy to render data on a map by constraining how the data is displayed using a fixed grid. The grid provides a fixed number of scales, and for each scale, a fixed number of tiles can be displayed. Geometries are scale dependent and therefore can be simplified depending on the current tile scale, lowering the amount of data that needs to be transferred between server and client.
Vector tiles are becoming a new trend and most likely the future of map publishing. They can represent a lossy, aggregated view of the data that can easily be rendered by map applications. Vector tiles are divided into layers, and each layer can have one or more features. A feature contains a geometry and zero or more key value pairs. The information is then encoded using Google protobuffers and an aggressive delta encoding, a more efficient file format than GeoJSON, to further compress geometry information.
In this blog post, we will introduce the vector tile search API, explain how to use the API in Elastic Maps, and cover how to use the API to build a tile map service (TMS) and a custom app.
The Elasticsearch vector tile search API
In order to use the new vector tile search API, we need to have an index with at least one geospatial field, which can be either a geo_point or geo_shape with doc values enabled. Then you can generate a vector tile by calling the following API:
POST {index}/_mvt/{geo_field}/{z}/{x}/{y}
Where z/x/y is the requested tile. Because the most common projection used in maps is the spherical mercator, the current implementation uses the slippy map as a grid of reference and follows the slippy map tile names. This call generates an Elasticsearch query that filters the index in order to fetch only the documents that intersect the requested tile and serialize the result into a vector tile.
The API allows defining both query parameters and request body parameters in order to control the information that is encoded in the vector tile, in a very similar fashion to standard Elasticsearch queries. For example, you can add a query on the request body in order to filter the documents that should be included in the vector tile.
The result of this API is a vector tile that can contain up to three layers. This is how each layer is constructed.
Hits layer
The hits layer is constructed from the hits array of the query result. Each entry on the hits array is added on the layer as a feature. The geometry of the feature will be the geometry on the geo field used in the API call.
Geometries are simplified to the scale of the tile and transformed into the vector tiles representation, which can significantly reduce the size of a geometry. Moreover, this simplification and transformation is done at the data node which can reduce the amount of information transfer between nodes on the cluster and to the map client. If a geometry is too small for the scale of the tile, it will not be added to the layer.
The information on the layer is controlled by the following parameters:
- size parameter: Equivalent to the size parameter of a regular query, it controls the maximum number of features that will be added to the layer. The upper limit is the same as a regular query, 10 thousand documents, and if it is set to 0, then this layer will not be created.
- fields parameter: Equivalent to the fields API, it allows adding other document fields to the vector tile feature. By default, the _id and_index fields are added to each feature.
- sort parameter: Equivalent to the sort parameter of a query, it sorts the result of the underlying query. By default this API sorts the results using the length of the diagonal of the bounding box geometry in order to always add the biggest geometries to the layer. As a tip, one easy way to speed up the generation of this layer is by indexing the sort parameter.
Aggregation layer
The aggregation layer is constructed from the output of a geotile aggregation. Each bucket result of the aggregation is added to the layer as a feature. The geometry of the feature can be configured as well as the contents of the layer using the following parameters:
- grid_type parameter: Defines the type of geometry added to the feature. It supports the following types:
- point: The geometry is a point at the center of the bucket.
- grid: The geometry is the polygon enclosing the area covered by the bucket.
- centroid: The geometry is a point at the centroid of the data. If the centroid is situated outside of the current bucket, the point is located to the closest point to the centroid inside the bucket.
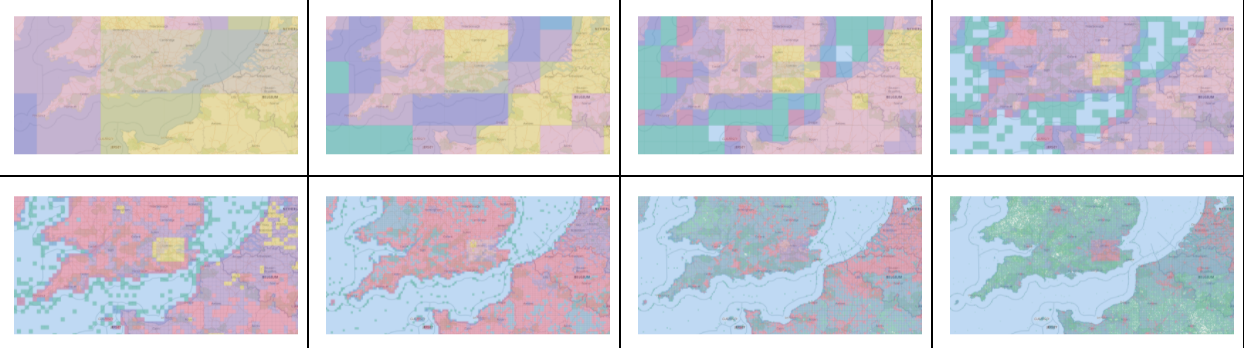
- grid_precision parameter: Controls the precision of the aggregation. It supports values between 0 and 8. If the value is set to 0, then the layer is not created. For value 1 the tile contains a grid of 2x2, for value 2 of 4x4, for value 3 of 16x6 and so on until value 8 that contains a grid of 256x256.
- aggs parameter: Controls adding aggregated metrics to each feature. By default each feature contains the number of documents that intersect it and in addition metric aggregations can be added to compute metrics based on other attributes of the document.
Metadata layer
The metadata layer is always constructed. It contains just one feature with all the information about how the query was executed — for example, the time it took to run the query or the number of shards searched. The geometry of the feature is a polygon that by default is the boundary of the tile. If the exact_bounds parameter is set to true, then the polygon boundary is adjusted to the data inside of the tile, similar to running a geo_bounding_box aggregation.
In addition, if metrics aggregations are used in the query, statistical information of the metrics are added to the feature — for example, the minimum and maximum value for each metric. This allows clients to implement dynamically styling on the different metrics.
Using the vector tile search API in Elastic Maps
Elastic Maps will support Elasticsearch vector tiles, starting in the 8.0 release.
There are two ways where you can select to use vector tiles.
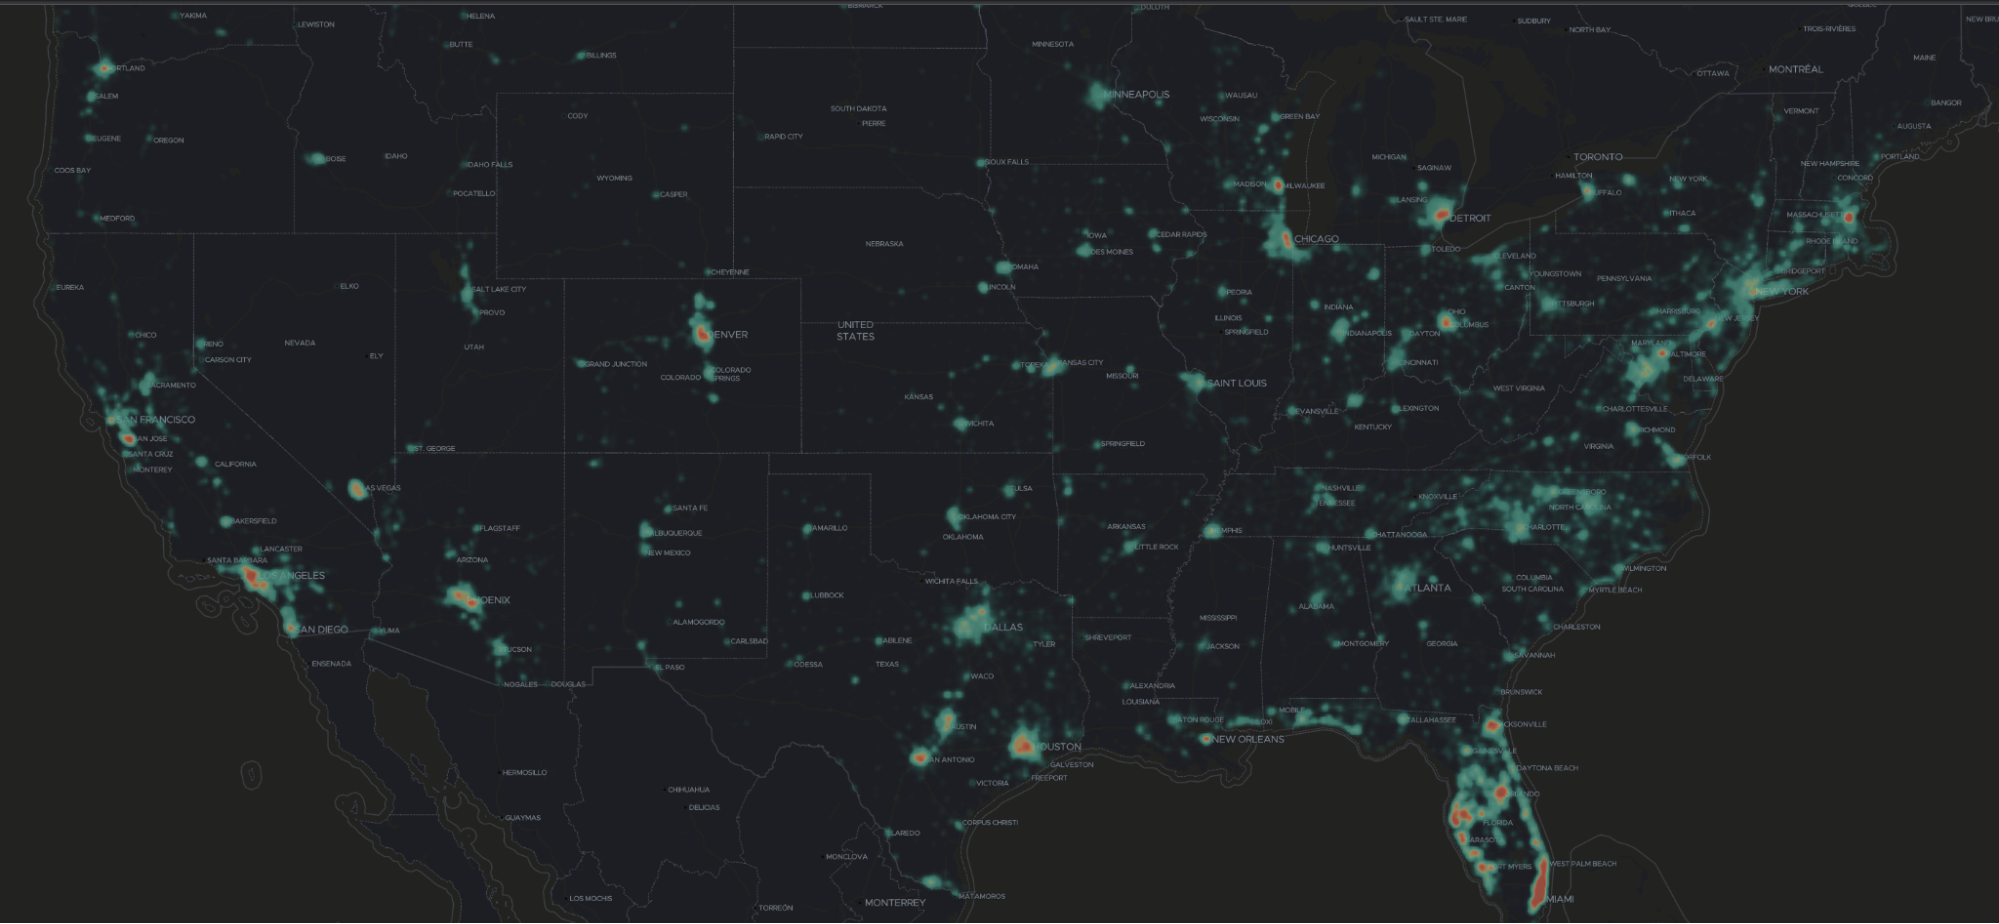
- To map individual documents: Select the “Use vector tiles” in the scaling options.
- To show clusters and grid at high resolution: Select the highest setting in the grid resolution options.

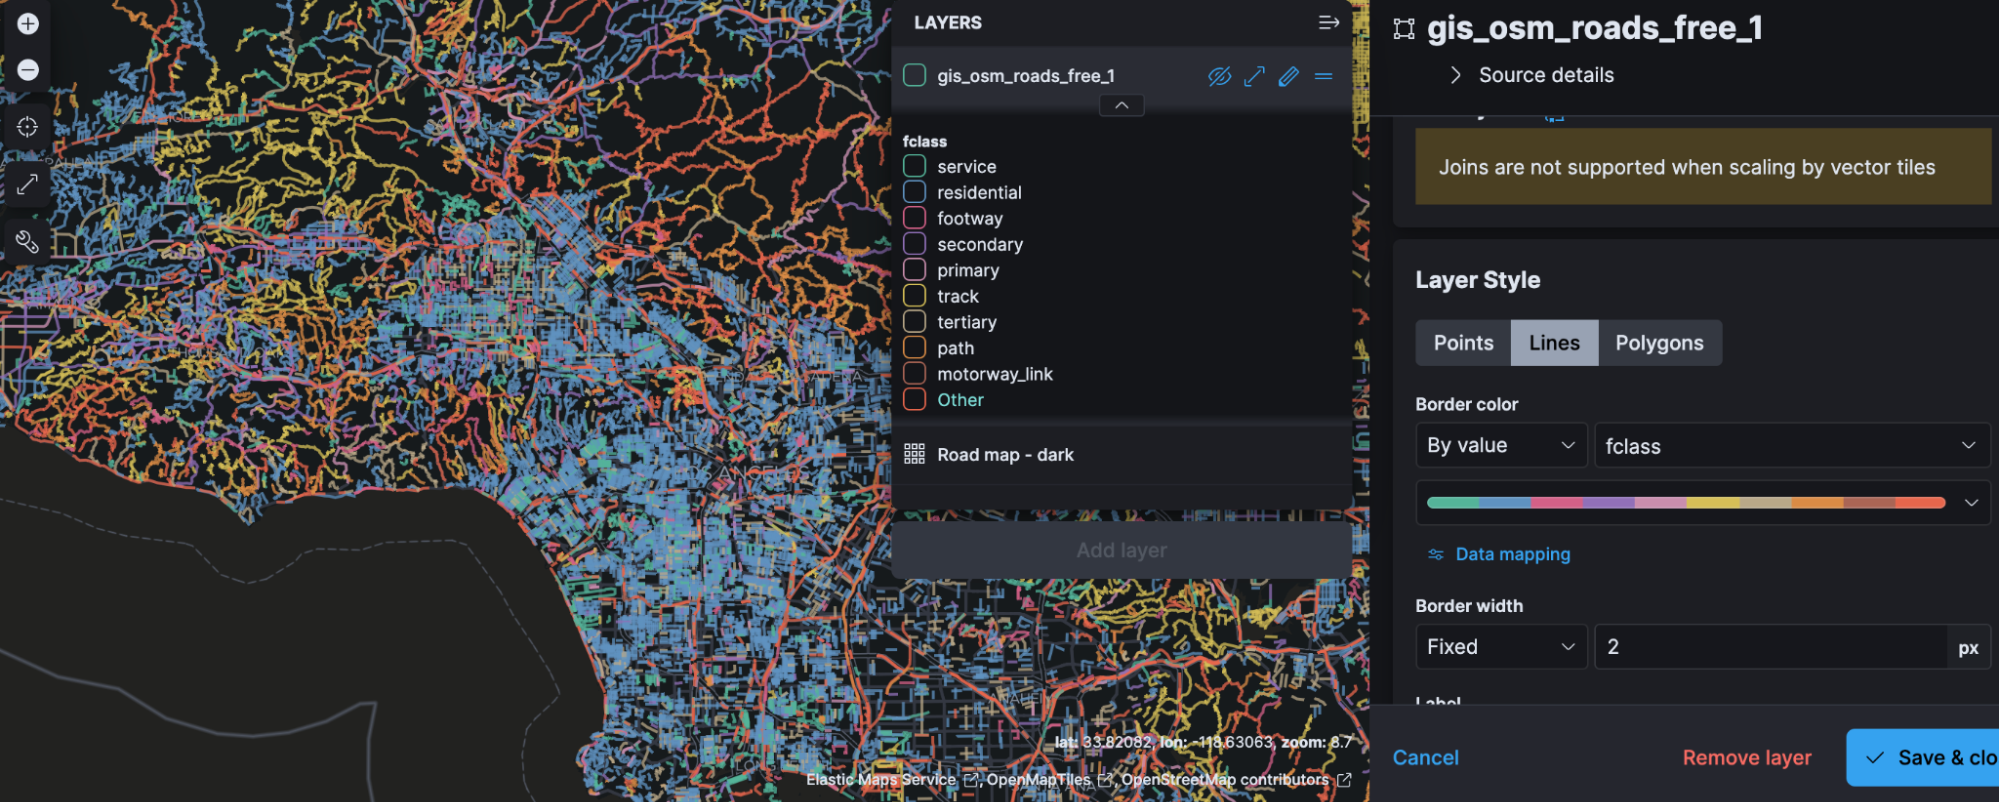
Styling or filtering vector tile layers works just like any other layer.
For example:
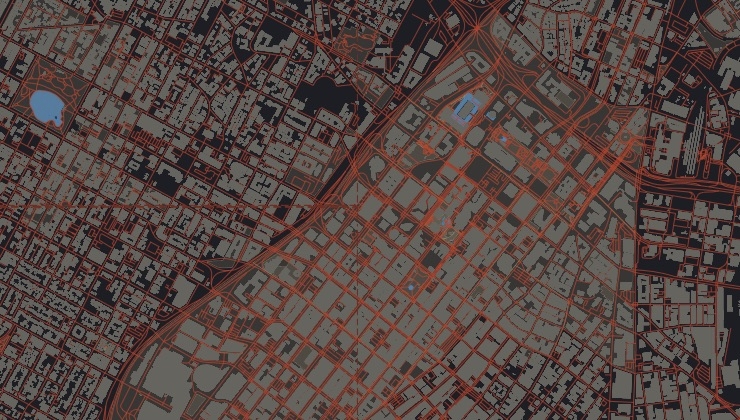
- Color roads by numerical value maxspeed:
.png)
- Color the roads by category fclass:
Using the vector tile search API in third-party apps
Because mvt is a standardized data format, it is now much easier to expose your Elasticsearch geo data within your enterprise or to the entire world.
Web-development libraries like OpenLayers, Mapbox, or MapLibre all support the mvt format. Desktop clients like QGIS or ArcGIS Pro do as well. The Android and iOS developer libraries for Mapbox, MapLibre, or ArcGIS all support the mvt format too.
Generally, these technologies require the tiles to be served up by either a TMS or WMTS webserver. At its core, TMS or WMTS are standards to deliver a tile with an http request.
The url-format — excluding any contents in the body — from the Elasticsearch vector tiles search API is a technically valid TMS. However, in production scenarios, you should never have clients connect directly to Elasticsearch. You should always insert a custom TMS or WMTS middle-ware in between Elasticsearch and the client, especially if Elasticsearch will be serving tiles to a web or mobile application.
- Elasticsearch should always be deployed with security enabled to safeguard the cluster. In practice, this means your clusters will not allow any anonymous usage. Most TMS servers allow for unrestricted read-access.(1)
- For web apps, the TMS/WMTS server generally needs to be CORS-enabled. For example, the application is hosted on `app.mycompany.com`, whereas the tiles are being served from `maps.mycompany.com`. The `maps.mycompany.com` server will need to allow CORS-requests from the `app.mycompany.com` domain.
- TMS or WMTS does not support request-body params in their GET-contracts, only query-string parameters in the URL are allowed. The middle-ware needs to perform some mapping from the outward facing TMS-url structure to a request compatible with the Elasticsearch vector tile search API. Use this mapping to curate how and what data is exposed in the TMS service layer. For example, not all parameters in the Elasticsearch vector tile search API will be relevant to your custom apps; maybe you only want to expose your data as clusters through the TMS, and not as individual documents.
- Since tiles from a TMS are addressable by a simple URL, it is straightforward to apply a caching layer on top of it. This caching layer can be implemented in many ways, such as with tools specifically designed for WMS/TMS sources (MapProxy), or by explicitly adding content-expiration headers in the middle-ware, or with a more general purpose reverse-proxy (Varnish).
This is what a typical solution architecture would look like:
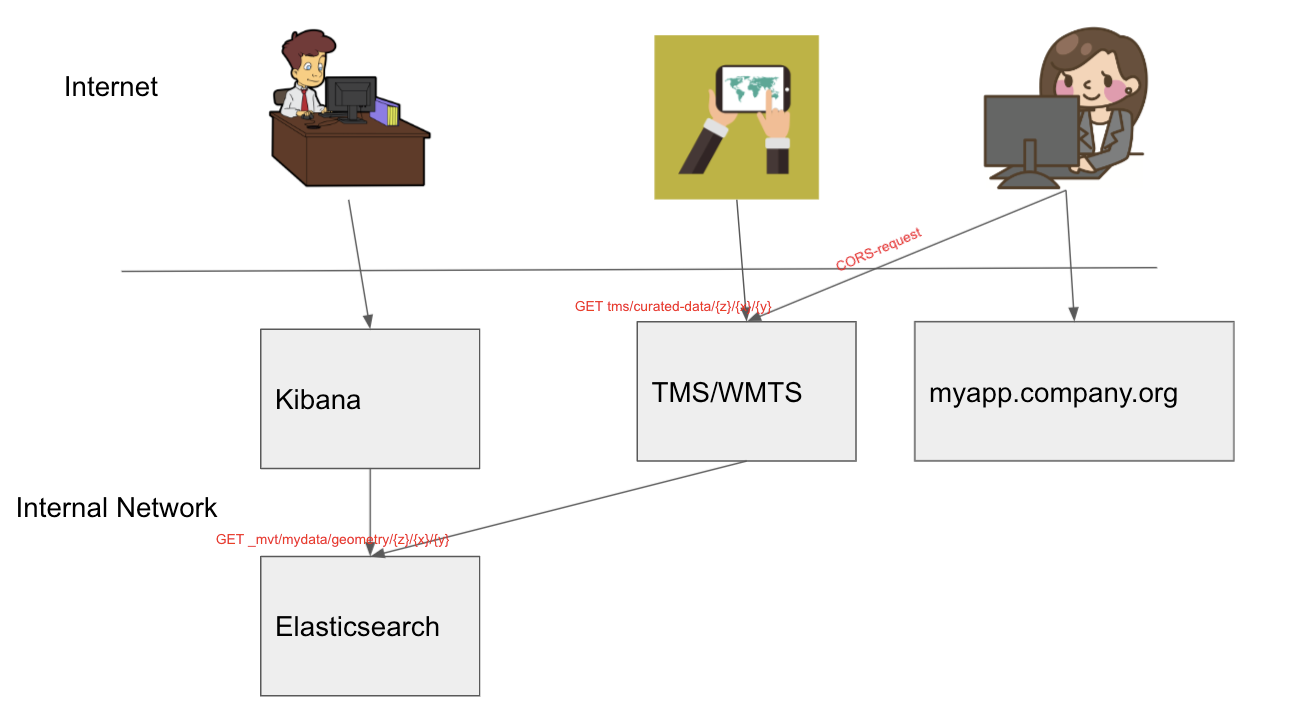
The key point here is that the TMS server acts as a middle-ware between the end-user running the client app (a webapp, a mobile app), and is CORS enabled. Elasticsearch is not exposed to the end user.
Building a TMS and web app using the vector tiles search API
Let’s go through an example of how to build a TMS to serve tiles for your apps. We are using NodeJS to create the server. For the full sample code, and instructions to build and run the application, see https://github.com/thomasneirynck/mvt_sample/.
The app we are building allows users to type in an index and geometry field and see the data as a layer on screen. The TMS will be designed for this use-case.
Step 1: Defining the TMS API
We want the TMS to allow:
- End user to specify the index name (index={indexName})
- End user to specify the geometry field name (geometry={fieldName})
- End user to specify whether data should be aggregated or not (renderMethod=[`hits`|`aggs]`)
A example of valid URL for the TMS would be:
http://localhost/tile?index=parcels&geometry=geometry&renderMethod=hits&x=0&y=0&z=0
Note that we are adding the x, y, and z parameters as well. These will be plugged in by the mapping framework based on the extent of the map.
Step 2: Build the TMS-server
Our server will handle requests to the `/tile` path.
- Set the CORS-headers
Here we are allowing cross-domain access to our TMS from any host (*-wildcard). In a production environment, set this to the domain hosting the web-app.
// Set CORS headers
   response.setHeader('Access-Control-Allow-Origin', '*');
   response.setHeader('Access-Control-Request-Method', '*');
   response.setHeader('Access-Control-Allow-Methods', 'OPTIONS, GET');
response.setHeader('Access-Control-Allow-Headers', '*');- Map the query-params to the relevant params of the Elasticsearch vector tile search API
Based on renderMethod, we are either going to ask for a hit-count of size 10000 (when `renderMethod=hits`), or for the highest grid-precision of 8 (when `renderMethod=aggs`).
          const tile = await client.searchMvt({
               index: params.index,
               field: params.geometry,
               zoom: parseInt(params.z),
               x: parseInt(params.x),
               y: parseInt(params.y),
               exact_bounds: true,
               extent: 4096,
               grid_precision: params.renderMethod === 'aggs' ? 8 : 0, // only create grid when necessary
               grid_type: 'grid',
               size: params.renderMethod === 'hits' ? 10000 : 0,// only populate the hits layer when necessary
               track_total_hits: false,
               body: {}
});- return the tile with the correct HTTP-headers
We return the tile with the correct mime-type of `application/x-protobuf`, flagging it as binary data with `content-disposition: inline`.
We want the user to always have the last available data, so we disallow caching by setting the `max-age: 0` in the `Cache-control` header.
           // set response header
           response.writeHead(200, {
               'content-disposition': 'inline',
               'content-length': tile ? `${tile.body.length}` : `0`,
               'Content-Type': 'application/x-protobuf',
               'Cache-Control': `public, max-age=0`,
               'Last-Modified': `${new Date().toUTCString()}`
});Step 3: Test the TMS service in Elastic Maps
Now we have the TMS running, we can integrate into any mapping library supporting the TMS-specification. We can even use Elastic Maps to test out this custom TMS-service. Select the “Vector tiles” layer, which supports any third-party TMS returning tiles in the mvt format.
All we need to do is plug in the URL-template and specify the layer name that contains the data inside the tile. Elasticsearch vector tiles contain three different layers: `hits`, `aggs`, and `meta`.
A valid template would be:
http://localhost/tile?index=parcels&geometry=geometry&renderMethod=hits&x={x}&y={y}&z={z}
Notice how we have templated variables for the tile coordinates using {x}, {y},{z} placeholders. The actual tile-coordinate will be plugged in based on the extent of the map on screen, updating while users are panning and zooming.
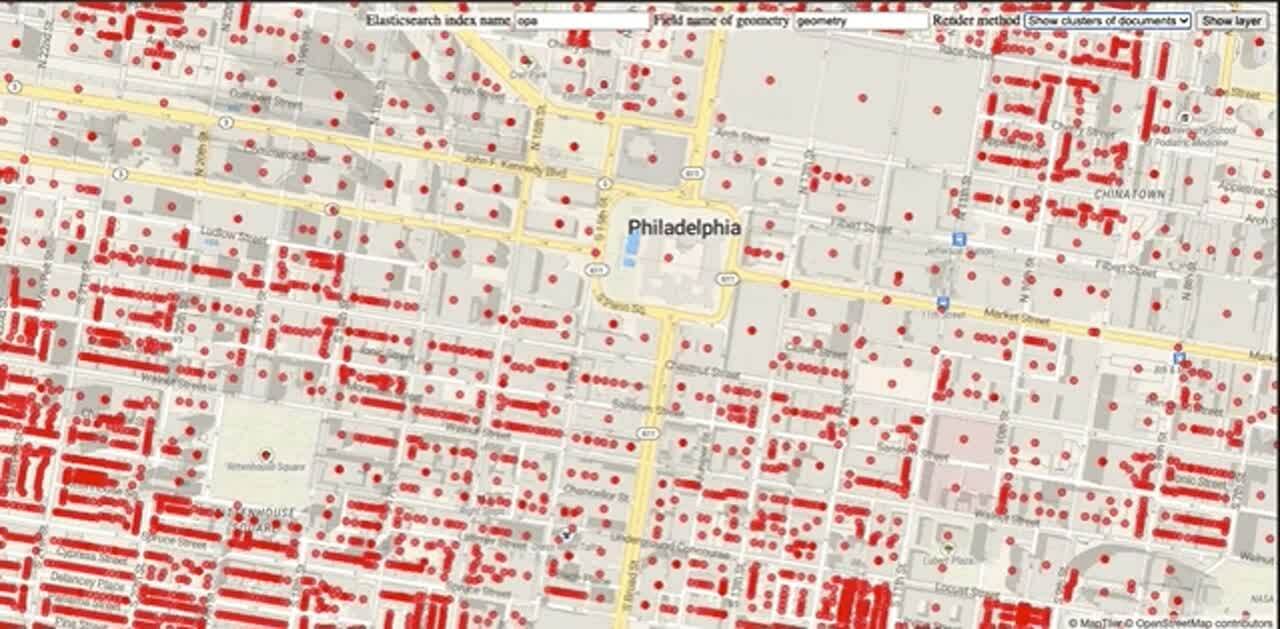
Step 4: Build a web application using the TMS service
Having verified our TMS service is running correctly, we can now build a web app taking advantage of it. We will be using MapLibre as the core mapping library.
On the web page, we allow users to configure from which index the layer should be loaded, adding a form for users to specify the index and field name.
We also add a dropdown allowing users to select whether they would like to cluster the data (`renderMethod=aggs`), or whether they would like to pull the individual documents (`renderMethod=hits`).

<div id="form">
   <label for="index">Elasticsearch index name</label>
   <input type="text" id="index"/>
   <label for="geometry_field">Field name of geometry</label>
   <input type="text" id="geometry_field"/>
   <label for="renderMethod">Render method</label>
   <select id="renderMethod">
       <option value="aggs">Show clusters of documents</option>
       <option value="hits">Show individual documents</option>
   </select>
   <input type="button" id="show_data" value="Show layer" onclick="showLayer()"/>
</div>When the user clicks the “Show layer” button, we make sure we construct the URL correctly to our TMS-service, and add it as a source to MapLibre.
map.addSource(sourceName, {
           'type': 'vector',
           'tiles': [
               `http://localhost/tile?index=${indexName}&geometry=${geometryFieldName}&renderMethod=${renderMethod}&x={x}&y={y}&z={z}`
           ],
           'minzoom': 0,
           'maxzoom': 24
});Since we want our app to handle points, lines, and polygons transparently, we ensure MapLibre will style each as necessary (e.g., lines should not have a fill-style). We do that by applying the style filtered by geometry-type.
       const fillColor = 'rgb(255,0,0)';
       const fillOpacity = 0.5;
       const strokeColor = 'rgb(255,0,0)';
       const strokeOpacity = 1;
       const strokeWidth = 1;

       map.addLayer(
           {
               'id': outlineStyle,
               'type': 'line',
               'source': sourceName,
               'source-layer': renderMethod,
               'paint': {
                   'line-opacity': strokeOpacity,
                   'line-color': strokeColor,
                   'line-width': 1
               }
           }
       );

       map.setFilter(outlineStyle, [
           'any',
           ['==', ['geometry-type'], 'Polygon'],
           ['==', ['geometry-type'], 'MultiPolygon'],
           ['==', ['geometry-type'], 'LineString'],
           ['==', ['geometry-type'], 'MultiLineString'],
       ]);

       map.addLayer(
           {
               'id': fillStyle,
               'type': 'fill',
               'source': sourceName,
               'source-layer': renderMethod,
               'paint': {
                   'fill-opacity': fillOpacity,
                   'fill-color': fillColor,
               }
           }
       );


       map.setFilter(fillStyle, [
           'any',
           ['==', ['geometry-type'], 'Polygon'],
           ['==', ['geometry-type'], 'MultiPolygon'],
       ]);

       map.addLayer(
           {
               'id': circleStyle,
               'type': 'circle',
               'source': sourceName,
               'source-layer': renderMethod,
               'paint': {
                   'circle-radius': 4,
                   'circle-color': fillColor,
                   'circle-opacity': fillOpacity,
                   'circle-stroke-color': strokeColor,
                   'circle-stroke-opacity': strokeOpacity,
                   'circle-stroke-width': strokeWidth,
               }
           }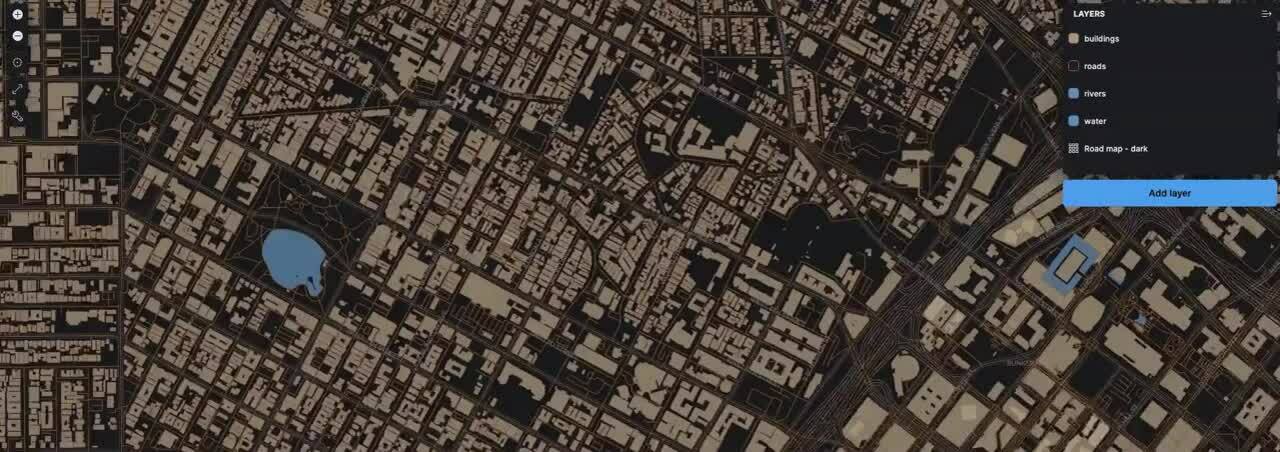
);We can now use this custom app to see the geo-contents of Elasticsearch indices on our map.
Looking ahead
Elastic Maps will expand its use of vector tiles. We will be enabling the vector tile options as the default scaling method, as well as using it as the core format for heatmaps.
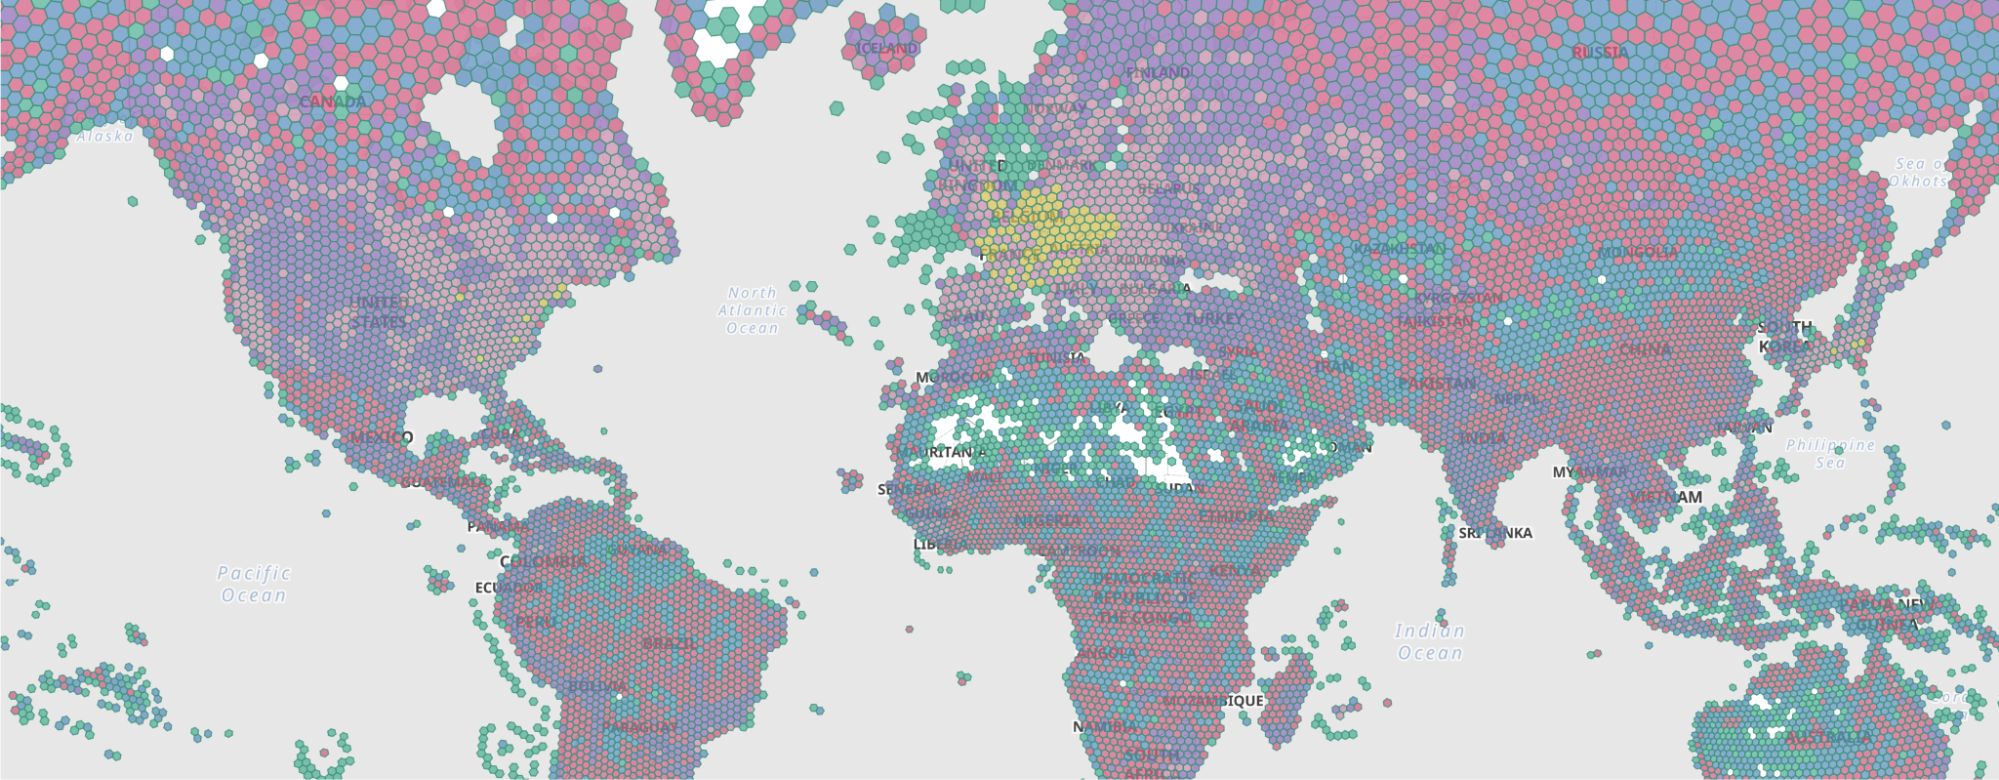
Currently, the vector tile API only offers the possibility to cluster data using a square grid. We are working on enabling other types of clustering, for example using hexagonal grids.
Try it out
Try these demos on your own by signing up for a free trial of Elastic Cloud or download the self-managed version of the Elastic Stack for free. If you have additional questions about getting started, head on over to the Elasticsearch or the Elastic Maps forums or check out the Elasticsearch and Elastic Maps documentation guides.
Footnotes
- Some TMS/WMTS will come with their own security layer, often token-based. The token-based access to the tiles might drive monetization of the service as well. However, implementing this is entirely use-case driven.
Share
- Share on Twitter
Share on Twitter
- Share on LinkedIn
Share on LinkedIn
- Share on Facebook
Share on Facebook
- Share by Email
Share by Email
- Print this page
Print