How to use Elastic Maps to make public datasets observable


 Share on Twitter
Share on Twitter

 Share on LinkedIn
Share on LinkedIn

 Share on Facebook
Share on Facebook

 Share by Email
Share by Email

 Print this page
Print
There’s a growing trend among many countries to publish their data (for example, the number and location of bicycles that have been stolen in Berlin) as open datasets that are available to the public. These curated datasets are an excellent resource for developers looking to create a demo set for their applications.
In this post, we’ll take the example of Berlin’s bicycle theft database to walk through how you can use Elastic Maps to make visual dashboards and maps of publicly available data as demos in your applications.
The dataset
First grab yourself a copy of the CSV from Fahrraddiebstahl in Berlin | Offene Daten Berlin. This is irregularly updated. In this blog, I won’t cover how to retrieve this document regularly and send it to Elasticsearch. If you want to do something like that, I would advise looking at Elastic Agent and a custom input integration.
In our case, we are going to upload it through the UI. Let’s take a first quick look at the CSVs headers.
ANGELEGT_AM, TATZEIT_ANFANG_DATUM, TATZEIT_ANFANG_STUNDE, TATZEIT_ENDE_DATUM, TATZEIT_ENDE_STUNDE, LOR, SCHADENSHOEHE, VERSUCH, ART_DES_FAHRRADS, DELIKT, ERFASSUNGSGRUND
The headers are in German. Here’s a quick translation: reported_at, crime.started.date, crime.started.hour, crime.ended.date, crime.ended.hour, LOR, bicycle.value, try, bicycle.type, crime.type, crime.description
Most of the headers are self-explanatory, but there is one that needs an explanation: LOR. LOR stands for Lebensweltliche Orientierte Räume. To start, I wouldn’t know how to translate it. In general, they are smaller and bigger than ordinary districts, and they take other information into account, like the count of parks, hospitals, and schools. A LOR identifies as a single number 07100103, and this number can be looked up and translated to a region. Berlin publishes its geodata: https://daten.odis-berlin.de/. There is a change in the LOR descriptions from the end of 2020 to the start of 2021. Luckily for us, they provide this as GEOJSON.
Importing all the data
Kibana has an integrated upload function, which makes this super easy! Go to machine learning in Kibana, and select the File underneath Data Visualizer on the left side. It works nearly perfect for our use case. We need to alter the mapping of the LOR. Click next, select the advanced tab, change long to keyword, and remove the convert from the ingest pipeline.
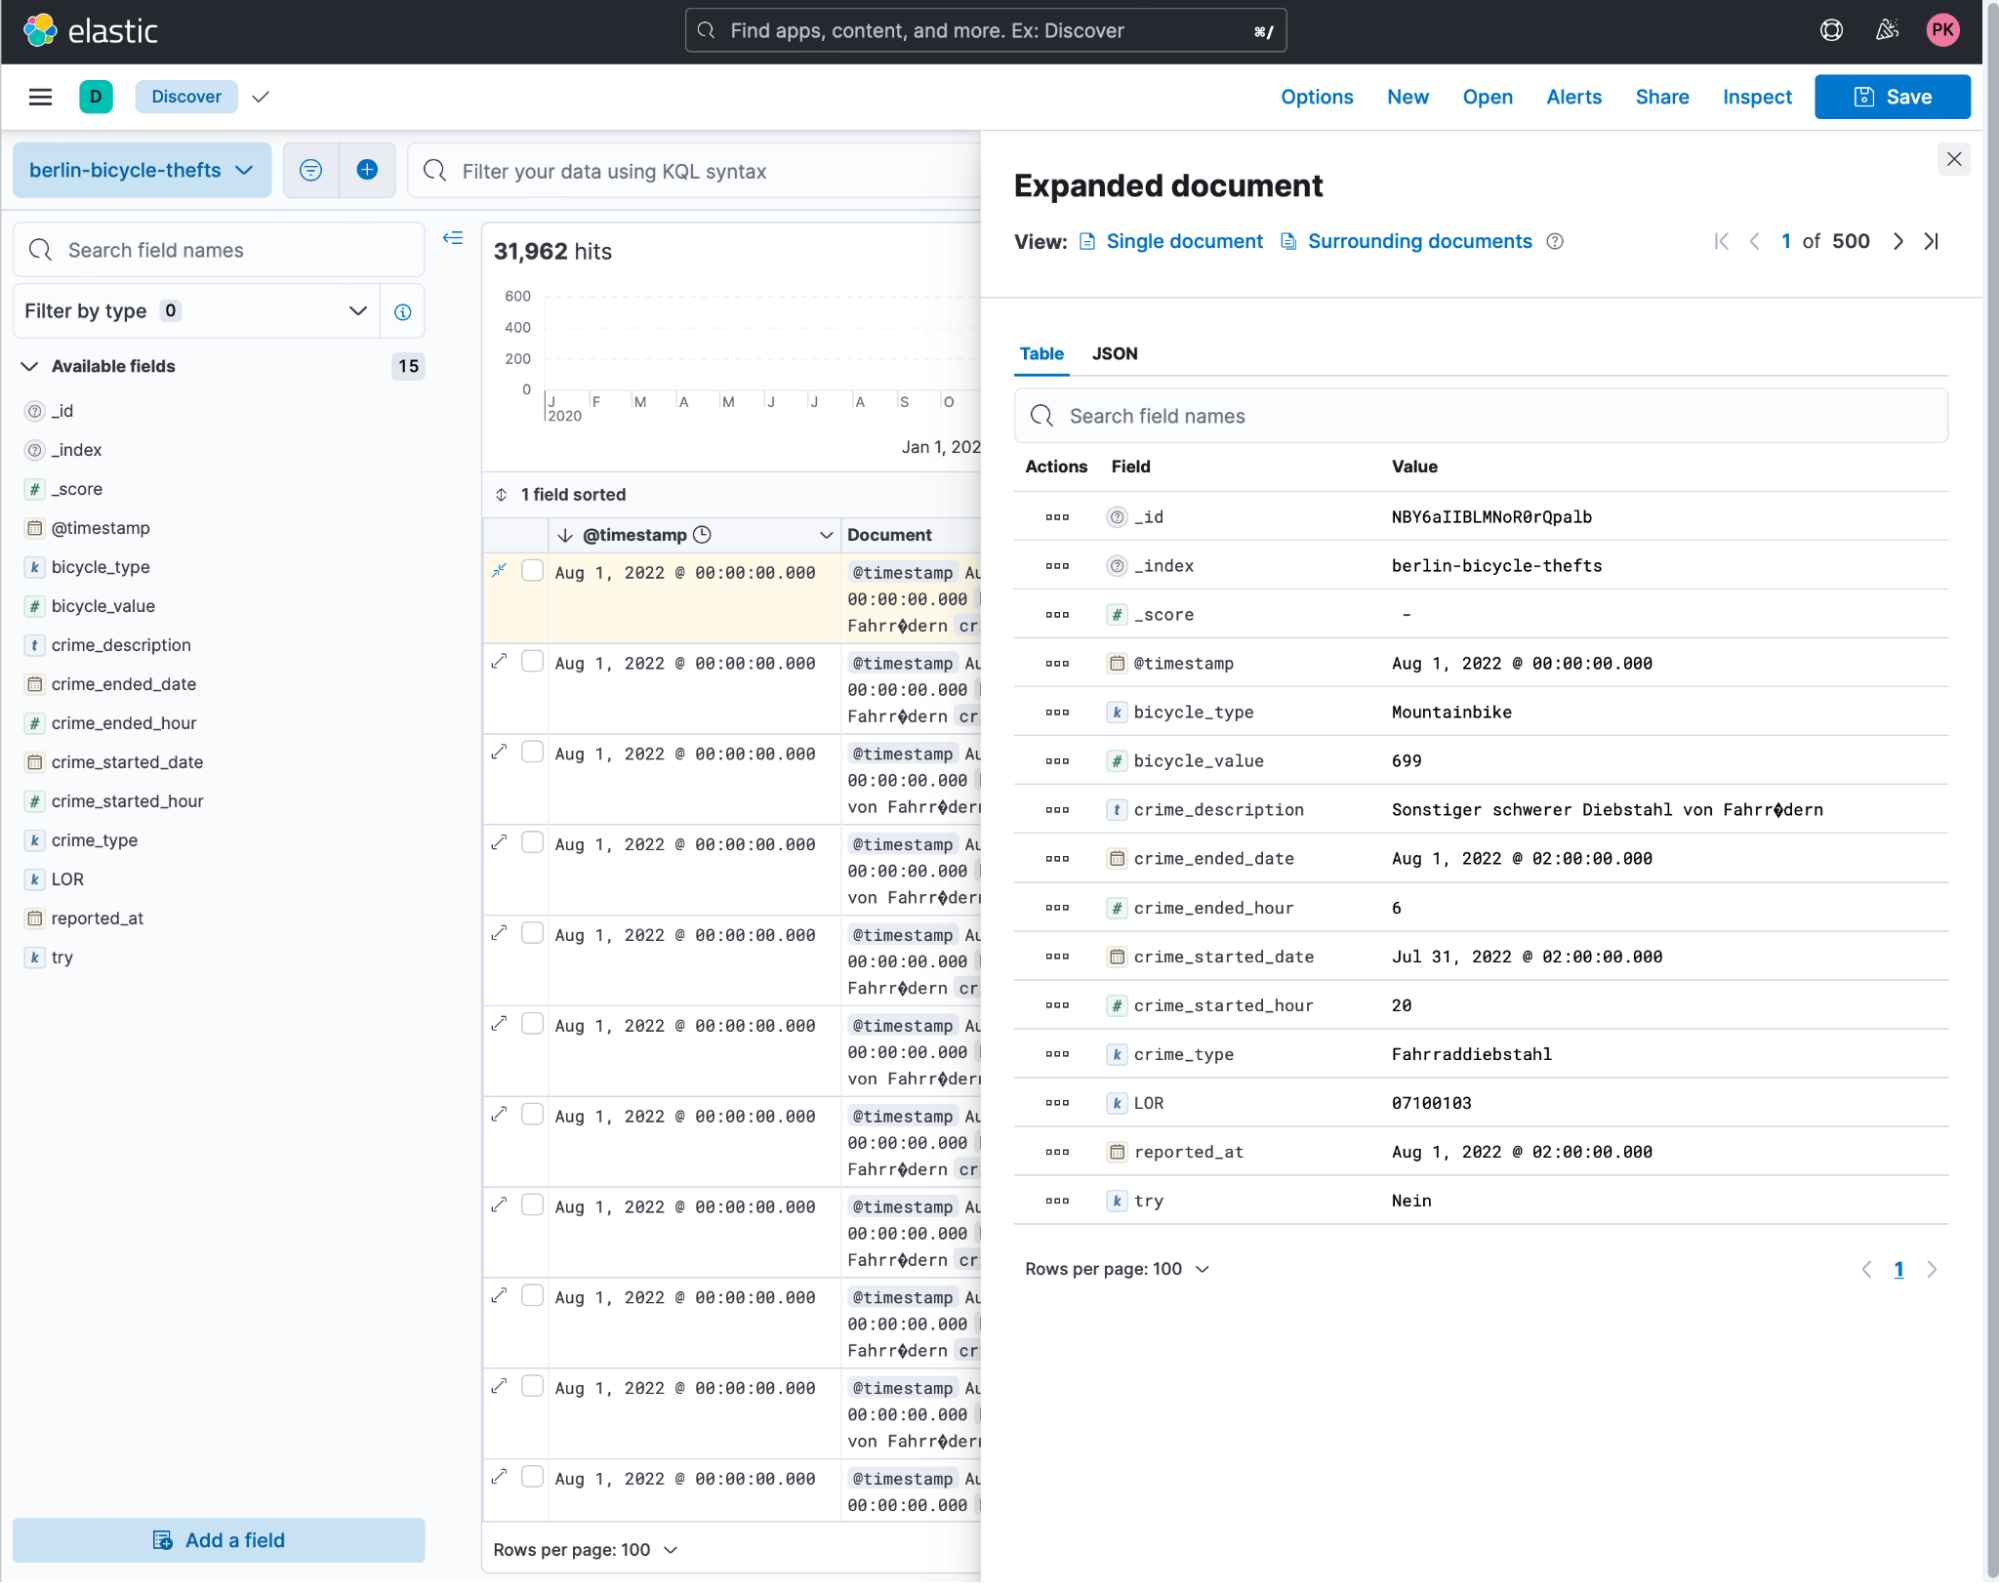
Give it a good name like berlin-bicycle-thefts and click on the upload button. The next step is to go to discover and take a look at the data provided. Looking at an example document, we see the same data as the CSV. Our timestamp is the reported_at date.
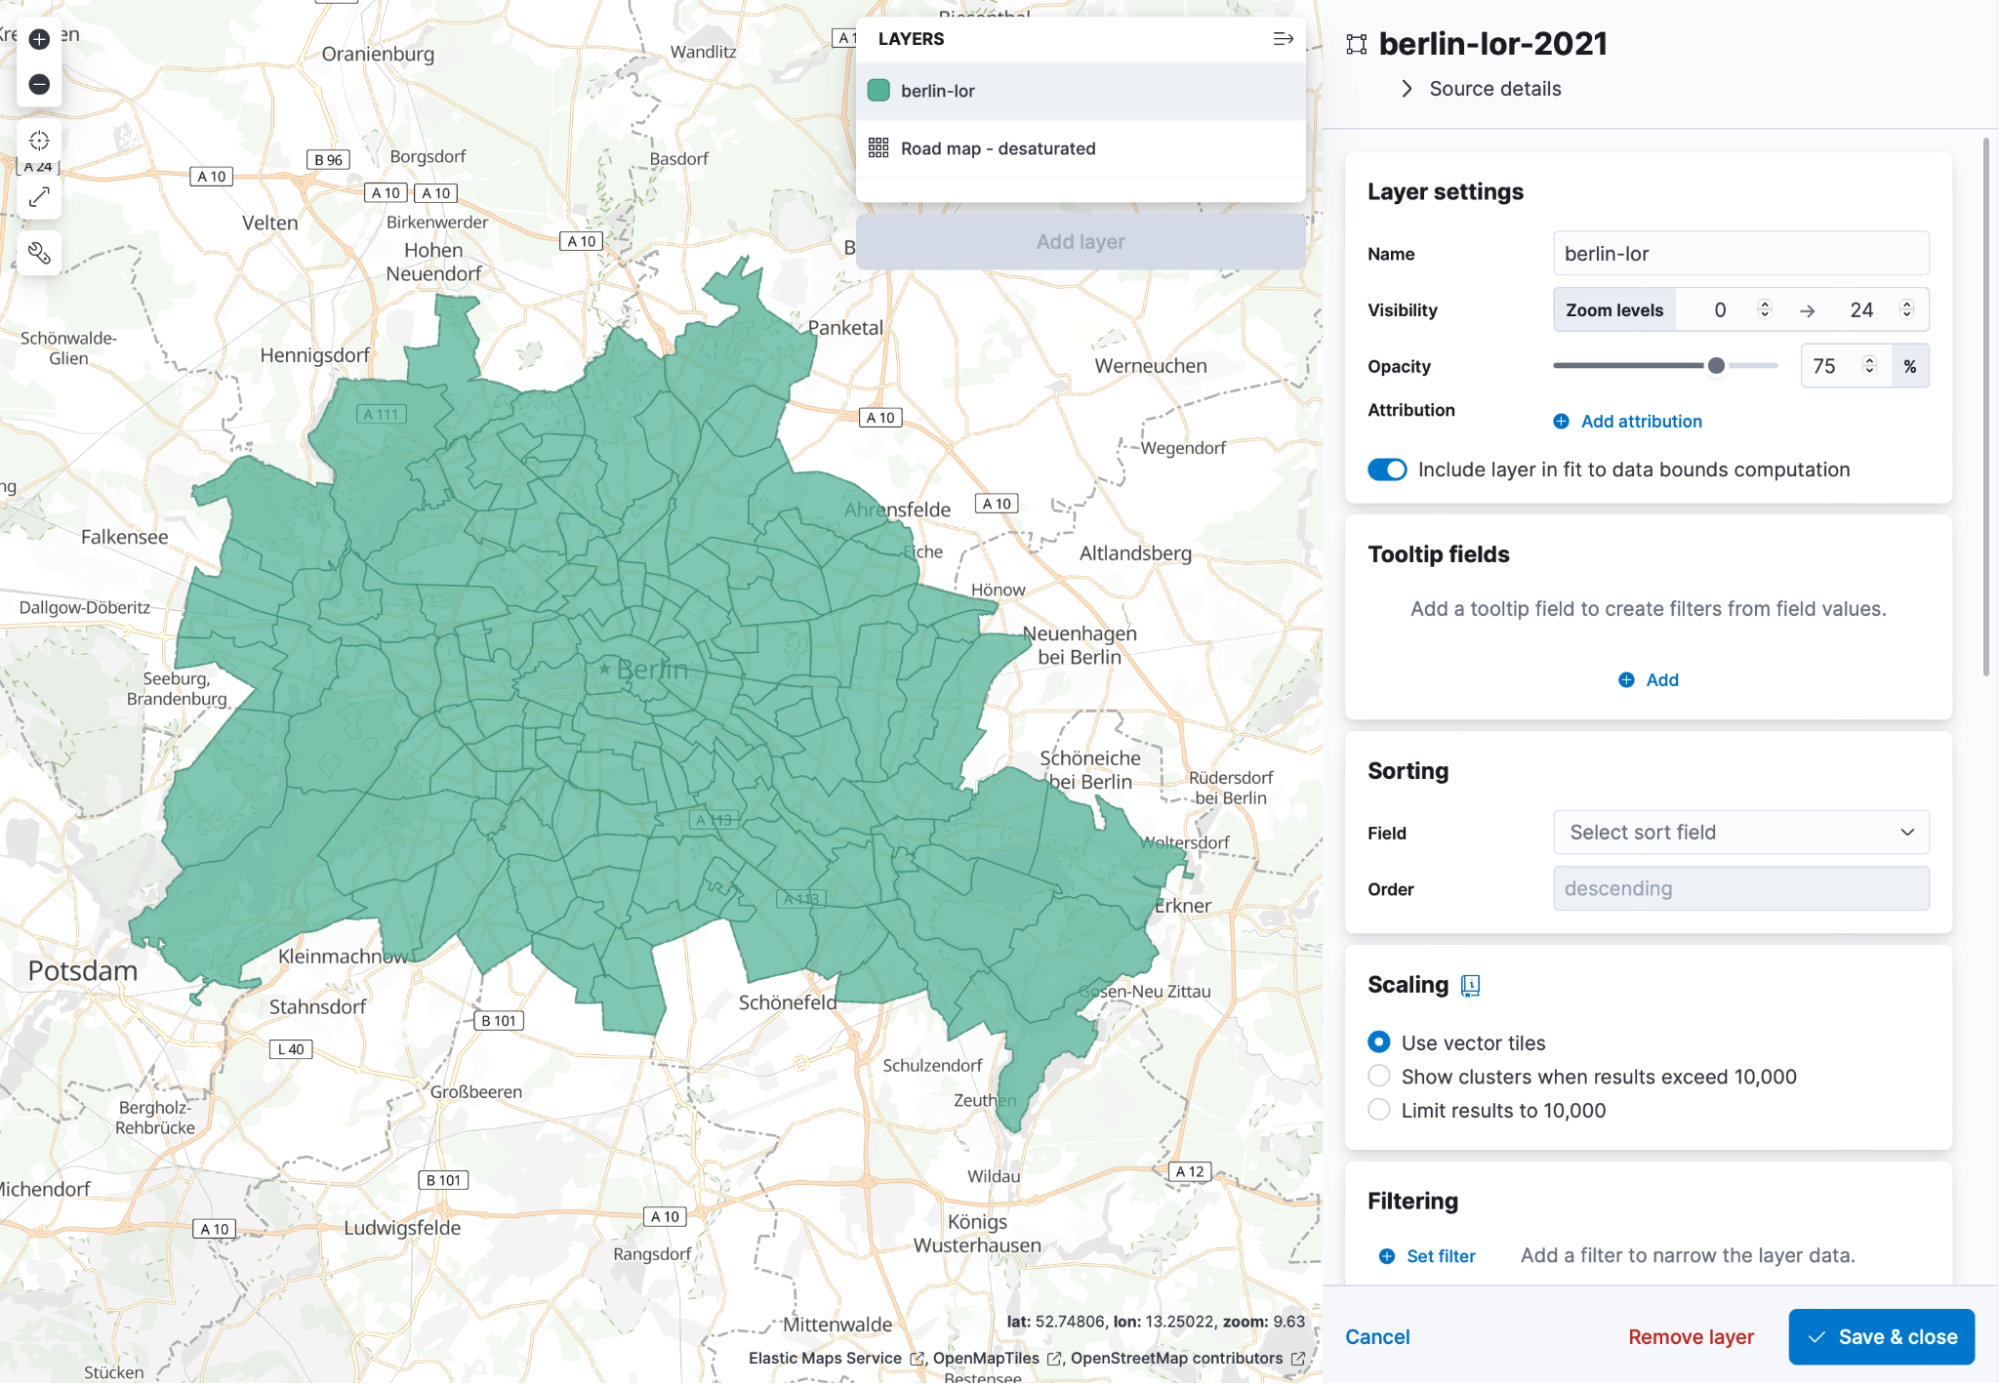
Now we are all set and can go to Elastic Maps and visualise the number of thefts in each LOR. Thanks to the upload button in Elastic Maps, we can do that super easily too! Head over to Maps inside Kibana and click on the Add Layer then Upload File and use the 2020 file. The index and dataview will be called as the file was named. In my case, this is berlin-lor-2021. Name the layer berlin-lor, or whatever you are comfortable with. It should look like this:
Next to the layer berlin-lor there is a little button available that is called Fit to data.
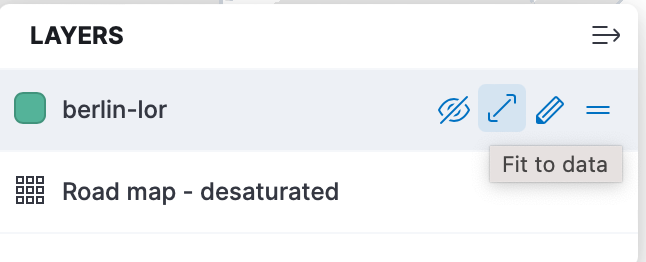
Click it, and it will zoom the map to the location of the data. In the end, you should see something like this.
So now everything is plotted, and we have our bicycle thefts in another index. Scroll a bit down on the right hand side and you should see a join option. Select the BZR_ID, select your index with the bicycle data, and select lor. Now we can change the metric to SUM of bicycle_value. Scroll a bit to the top and under tooltip, add the BZR_NAME. Now we have a map that shows which region has the highest theft value.
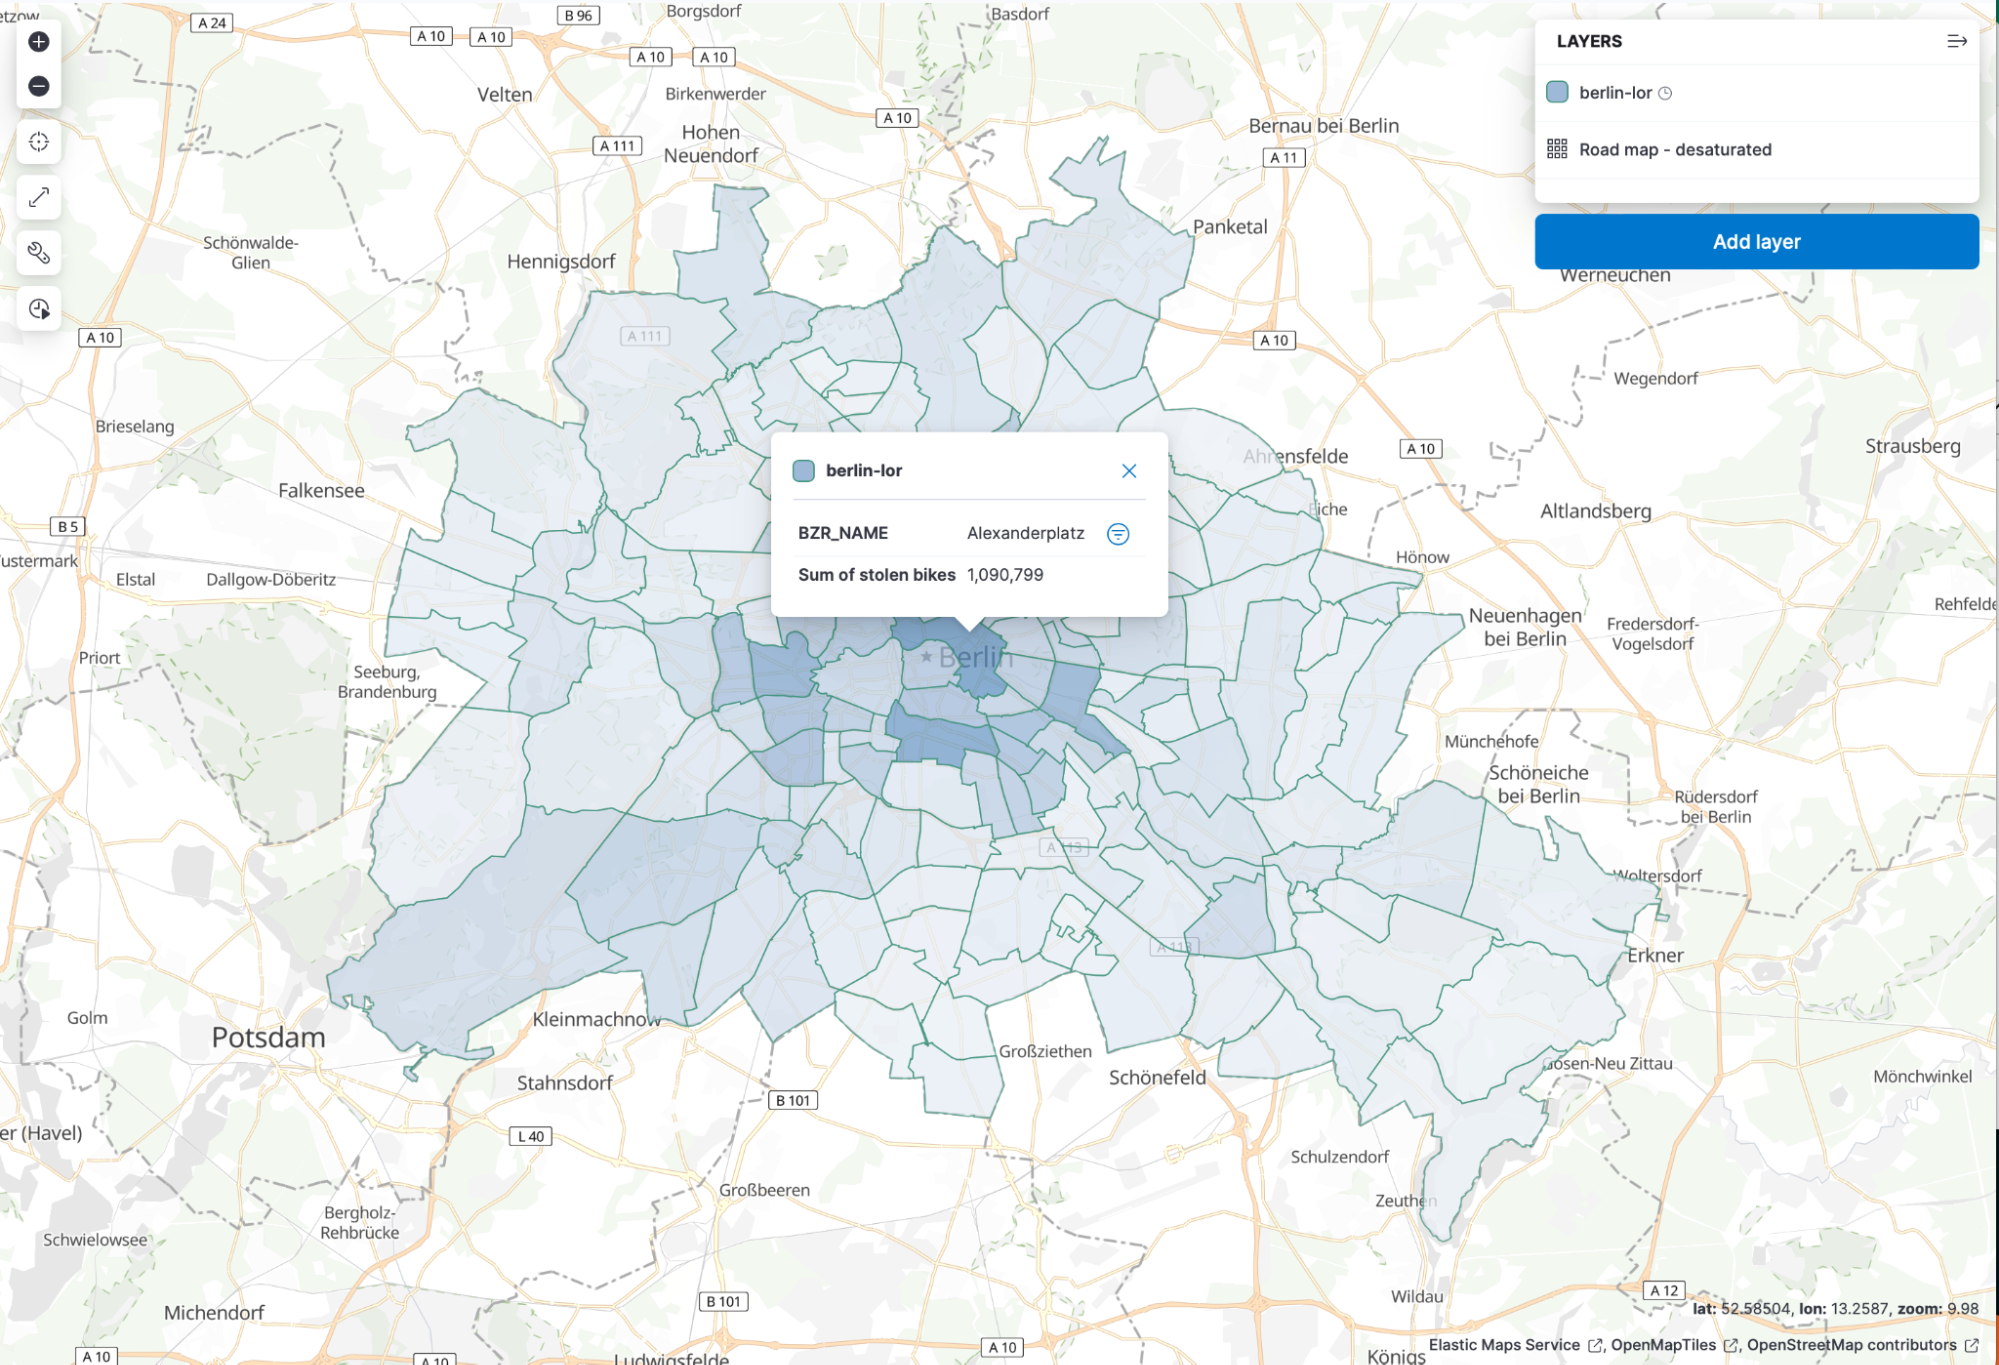
Thanks to vector maps, everything is blazingly fast. Go ahead and save the map.
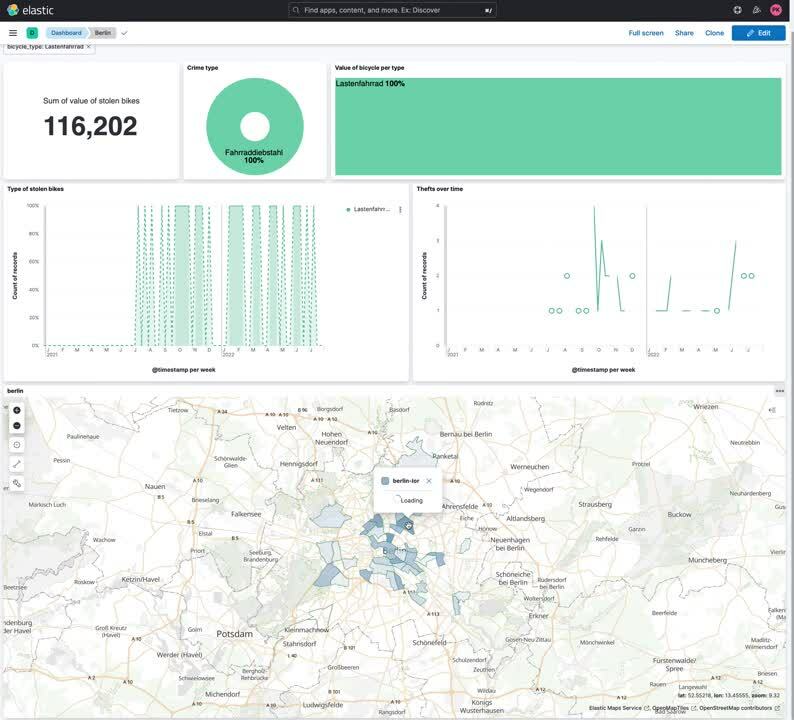
Keep on playing with the data a bit, and you can create a visually stunning dashboard that includes a map that dynamically changes based on our filters. Want to find out where most Lastenräder (Cargobikes) are stolen? Filter for it!
Summary
It is super easy to get started with publicly available datasets in Elastic. If you want to try it out yourself, go ahead and spin up a 14-day trial of Elastic in our Elastic Cloud!
Share
- Share on Twitter
Share on Twitter
- Share on LinkedIn
Share on LinkedIn
- Share on Facebook
Share on Facebook
- Share by Email
Share by Email
- Print this page
Print