How to monitor NVIDIA GPU metrics with Elastic Observability
Graphical processing units, or GPUs, aren’t just for PC gaming. Today, GPUs are used to train neural networks, simulate computational fluid dynamics, mine Bitcoin, and process workloads in data centers. And they are at the heart of most high-performance computing systems, making the monitoring of GPU performance in today's data centers just as important as monitoring CPU performance.
With that in mind, let's take a look at how to use Elastic Observability together with NVIDIA’s GPU monitoring tools to observe and optimize GPU performance.
Dependencies
To get NVIDIA GPU metrics up and running, we will need to build NVIDIA GPU monitoring tools from source code (Go). And, yes, we’ll need an NVIDIA GPU. AMD and other GPU types use different Linux drivers and monitoring tools, so we’ll have to cover them in a separate post.
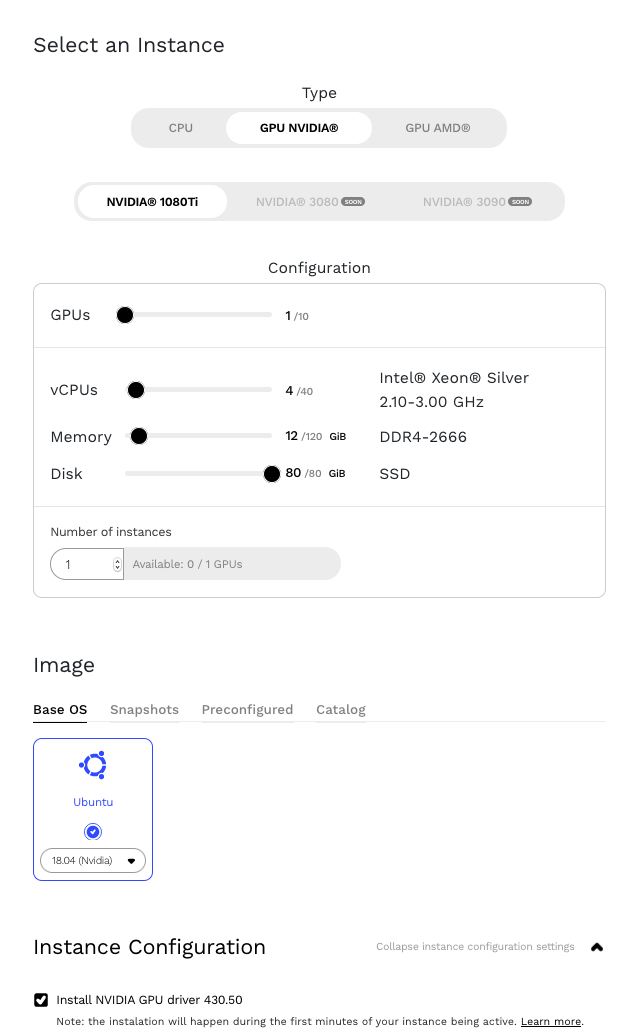
NVIDIA GPUs are available from many cloud providers like Google Cloud and Amazon Web Services (AWS). For this post, we are using an instance running on Genesis Cloud.
Let’s start by installing the NVIDIA Datacenter Manager per the installation section of NVIDIA’s DCGM Getting Started Guide for Ubuntu 18.04. Note: While following the guide, pay special attention replacing the <architecture> parameter with our own. We can find our architecture using the uname command.
uname -a

The response tells us that X86_64 is our architecture. So step 1 in the Getting Started Guide would be:
echo "deb http://developer.download.nvidia.com/compute/cuda/repos/$distribution/x86_64 /" | sudo tee /etc/apt/sources.list.d/cuda.list
There is also a typo in step 2. Remove the trailing > from $distribution.
sudo apt-key adv --fetch-keys https://developer.download.nvidia.com/compute/cuda/repos/$distribution/x86_64/7fa2af80.pub
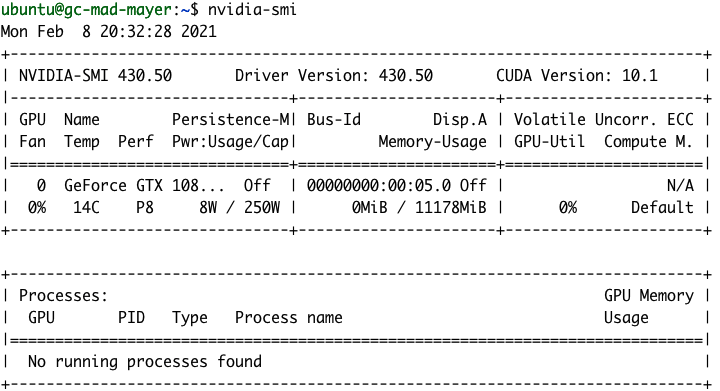
After installation, we should be able to see our GPU details by running the nvidia-smi command.
NVIDIA gpu-monitoring-tools
To build NVIDIA’s gpu-monitoring-tools, we’ll need to install Golang. So let’s take care of that now.
cd /tmp
wget https://golang.org/dl/go1.15.7.linux-amd64.tar.gz
sudo mv go1.15.7.linux-amd64.tar.gz /usr/local/
cd /usr/local/
sudo tar -zxf go1.15.7.linux-amd64.tar.gz
sudo rm go1.15.7.linux-amd64.tar.gz
OK, it’s time to finish up the NVIDIA setup by installing NVIDIA’s gpu-monitoring-tools from GitHub.
cd /tmp
git clone https://github.com/NVIDIA/gpu-monitoring-tools.git
cd gpu-monitoring-tools/
sudo env "PATH=$PATH:/usr/local/go/bin" make install
Metricbeat
We are now ready to install Metricbeat. Have a quick check on elastic.co for the latest version of Metricbeat and adjust the version number in the commands below.
cd /tmp
wget https://artifacts.elastic.co/downloads/beats/metricbeat/metricbeat-7.10.2-amd64.deb
sudo dpkg -i metricbeat-7.10.2-amd64.deb                  # 7.10.2 is the version number
Elastic Cloud
Okay, let's get the Elastic Stack up and running. We will need a home for our new GPU monitoring data. For this, we will create a new deployment on Elastic Cloud. If you’re not an existing Elastic Cloud customer, you can sign up for a free 14-day trial. Alternatively, you can set up your own deployment locally.
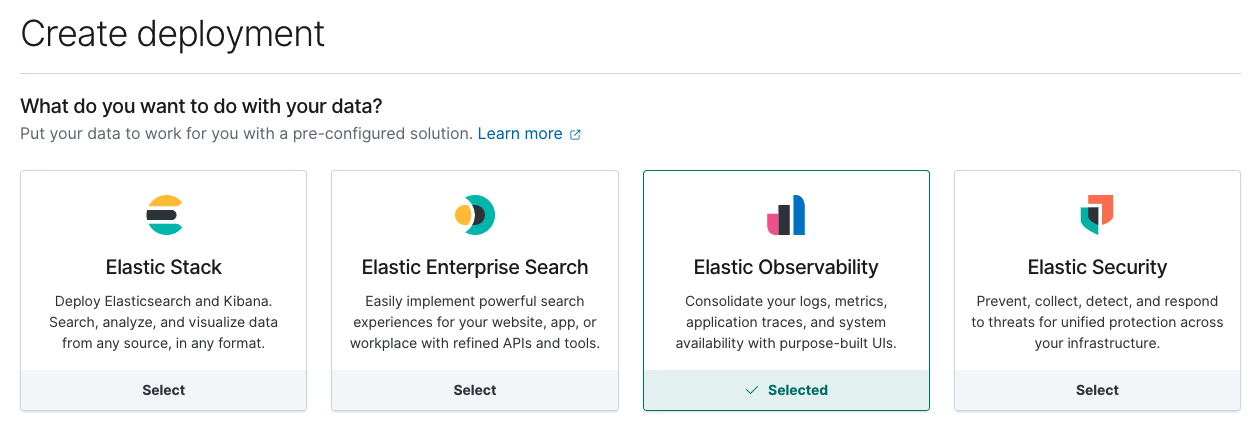
Next, create a new Elastic Observability deployment on Elastic Cloud.
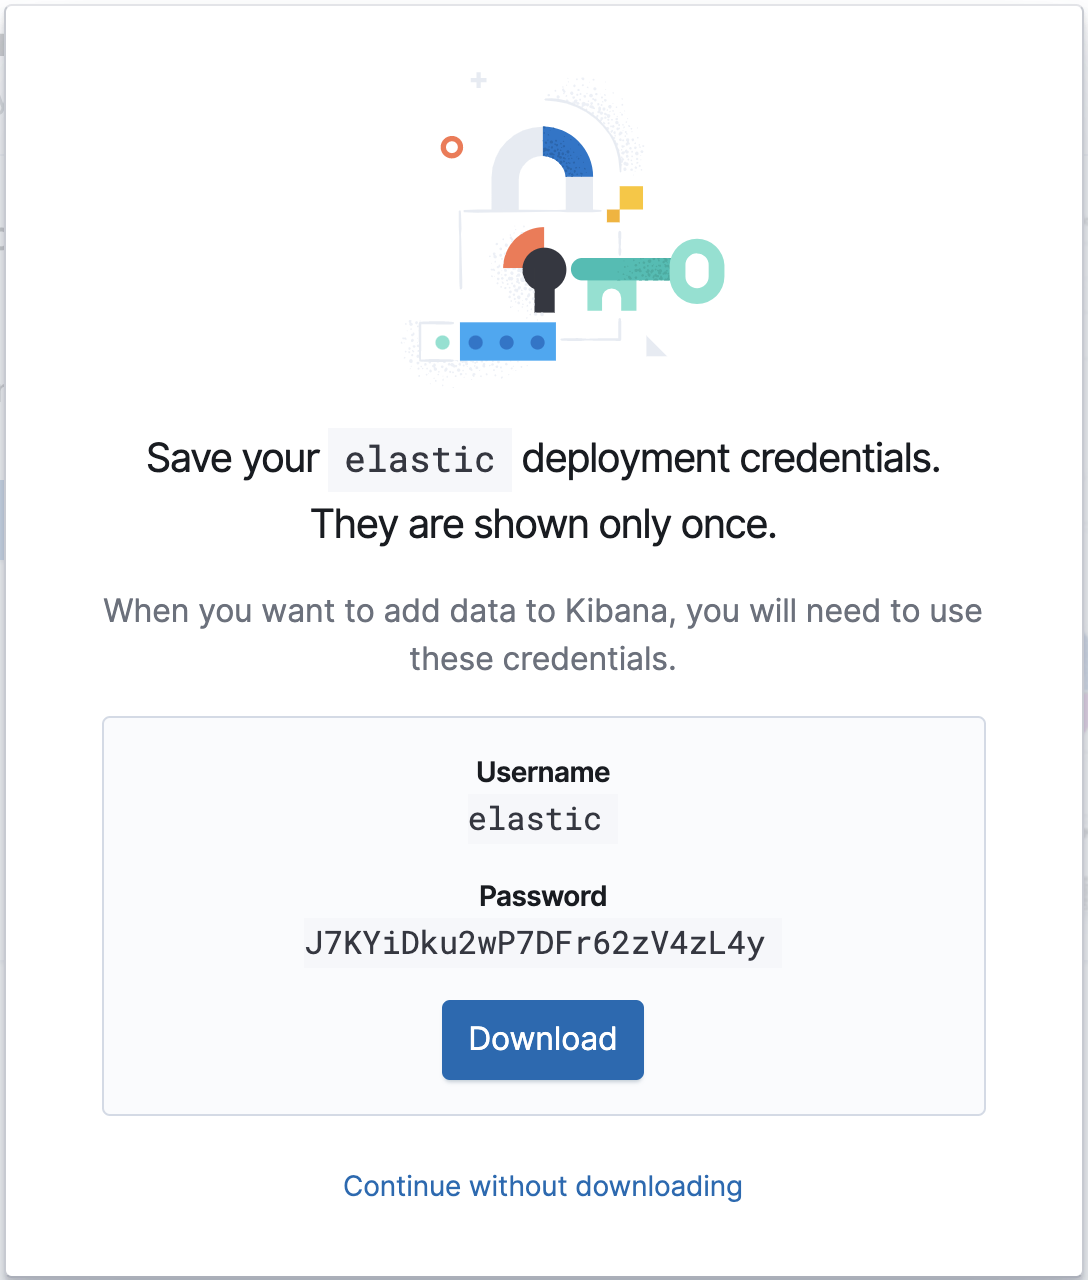
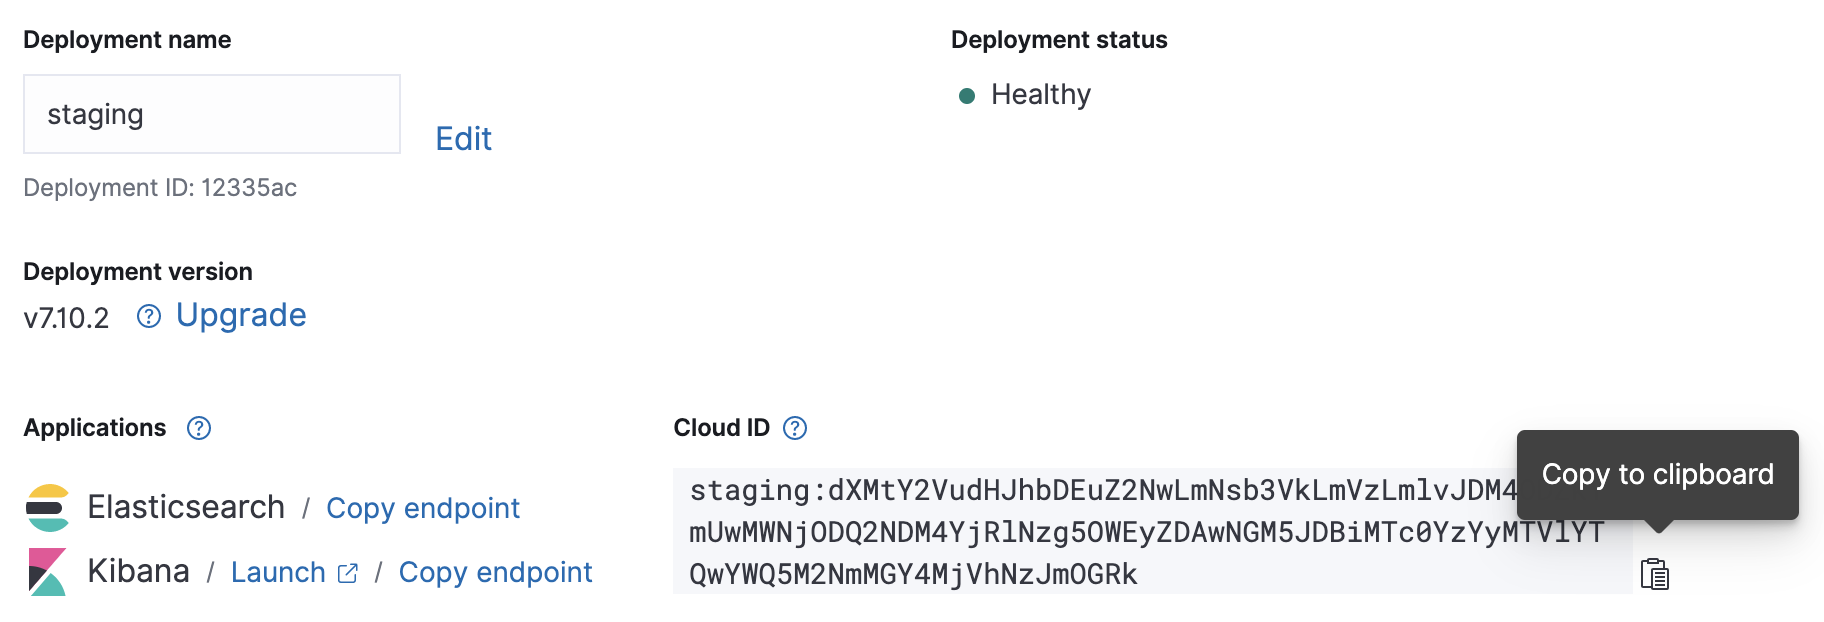
Once your cloud deployment is up and running, note its Cloud ID and authentication credentials — we’ll need them for our upcoming Metricbeat configuration.
Configuration
Metricbeat’s configuration file is located in /etc/metricbeat/metricbeat.yml. Open it in your favorite editor and edit the cloud.id and cloud.auth parameters to match your deployment.
Example Metricbeat configuration changes using the above screenshots:
cloud.id: "staging:dXMtY2VudHJhbDEuZ2NwLmNsb3VkLmVzLmlvJDM4ODZkYmUwMWNjODQ2NDM4YjRlNzg5OWEyZDAwNGM5JDBiMTc0YzYyMTVlYTQwYWQ5M2NmMGY4MjVhNzJmOGRk"
cloud.auth: "elastic:J7KYiDku2wP7DFr62zV4zL4y"
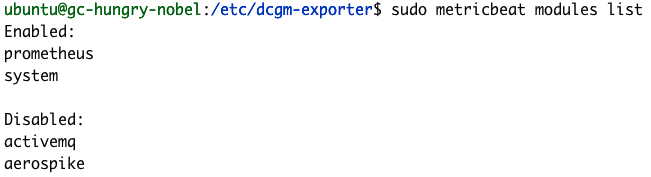
Metricbeat's input configuration is modular. The NVIDIA gpu-monitoring-tools publishes the GPU metrics via Prometheus, so let’s go ahead and enable the Prometheus Metricbeat module now.
sudo metricbeat modules enable prometheus
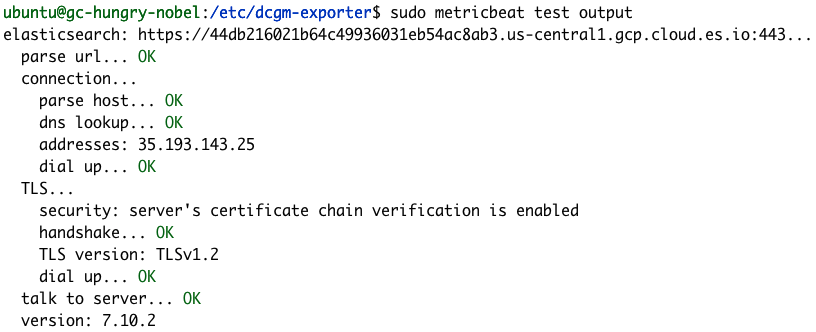
We can confirm our Metricbeat configuration is successful using the Metricbeat test and modules commands.
sudo metricbeat test config

sudo metricbeat test output
sudo metricbeat modules list
If your configuration tests aren’t successful like the examples above, check out our Metricbeat troubleshooting guide.
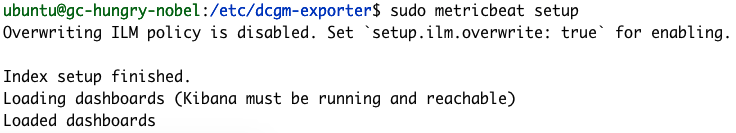
We finish up the Metricbeat configuration by running its setup command, which will load some default dashboards and set up index mappings. The setup command normally takes a few minutes to finish.
sudo metricbeat setup
Exporting metrics
It is time to start exporting metrics. Let’s start NVIDIA’s dcgm-exporter.
dcgm-exporter --address localhost:9090
# Output
INFO[0000] Starting dcgm-exporter
INFO[0000] DCGM successfully initialized!
INFO[0000] Not collecting DCP metrics: Error getting supported metrics: This request is serviced by a module of DCGM that is not currently loaded
INFO[0000] Pipeline starting
INFO[0000] Starting webserver
Note: You can ignore the DCP warning
The configuration of dcgm-exporter metrics is defined in the file /etc/dcgm-exporter/default-counters.csv, in which 38 different metrics are defined by default. For the complete list of possible values, we can check the DCGM Library API Reference Guide.
In another console, we’ll start Metricbeat.
sudo metricbeat -e
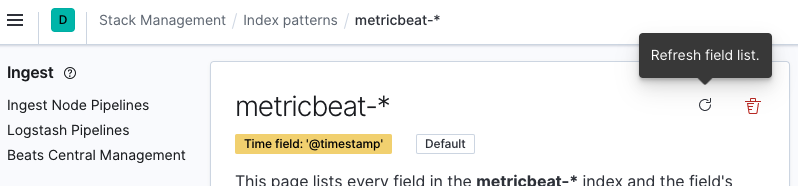
Now you can head over to the Kibana instance and refresh the ‘metricbeat-*’ index pattern. We can do that by navigating to Stack Management > Kibana> Index Patterns and selecting the metricbeat-* index pattern from the list. Then click Refresh field list.
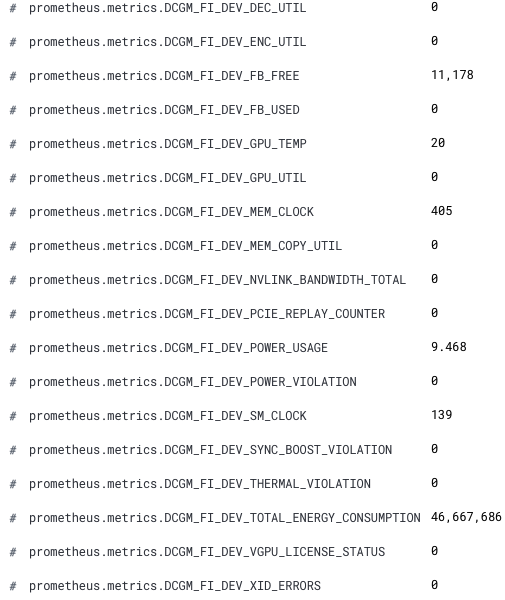
Now our new GPU metrics are available in Kibana. The new field names are prefixed by prometheus.metrics.DCGM_. Here is a snippet showing the new fields from Discover.
Congratulations! We are now ready to analyze our GPU metrics in Elastic Observability.
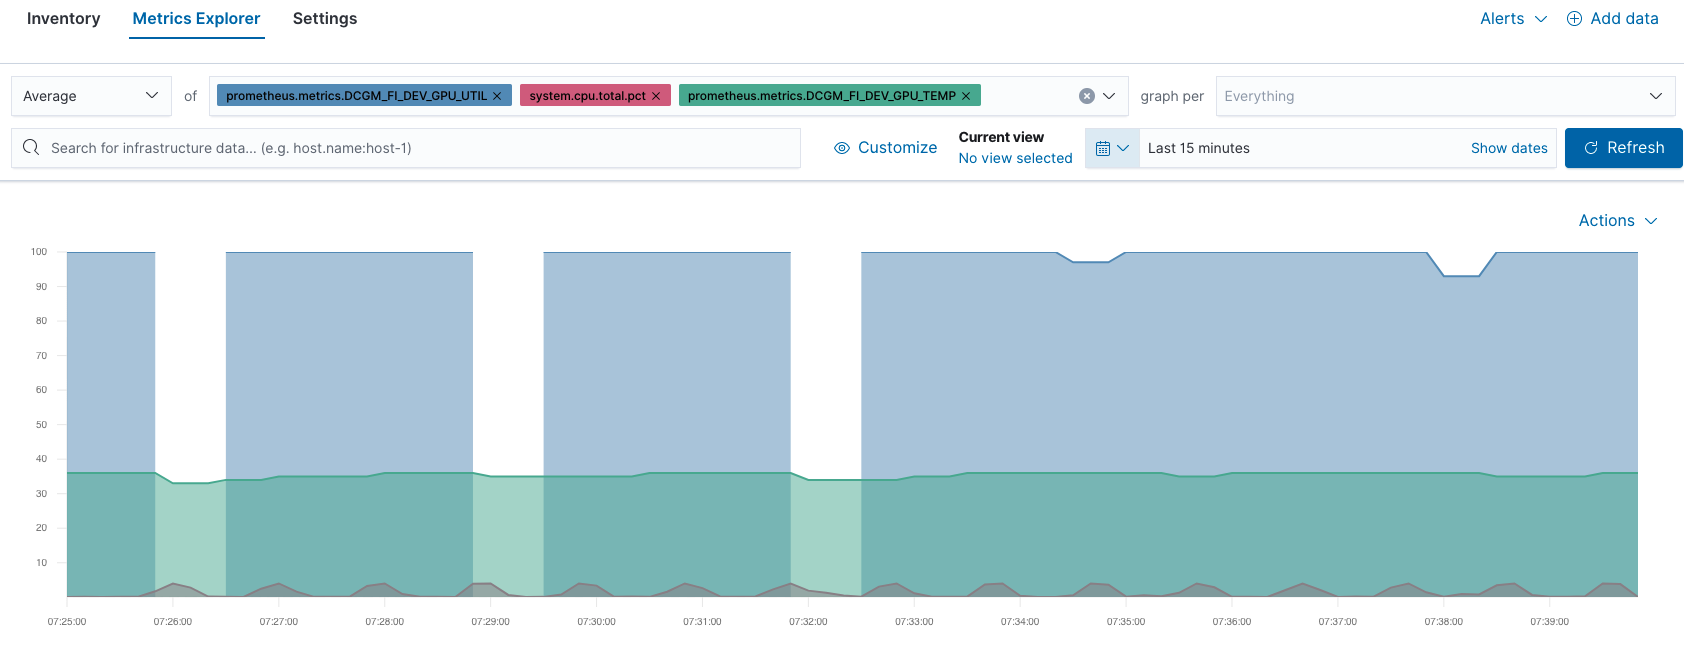
For example, you can compare GPU and CPU performance in Metrics Explorer:
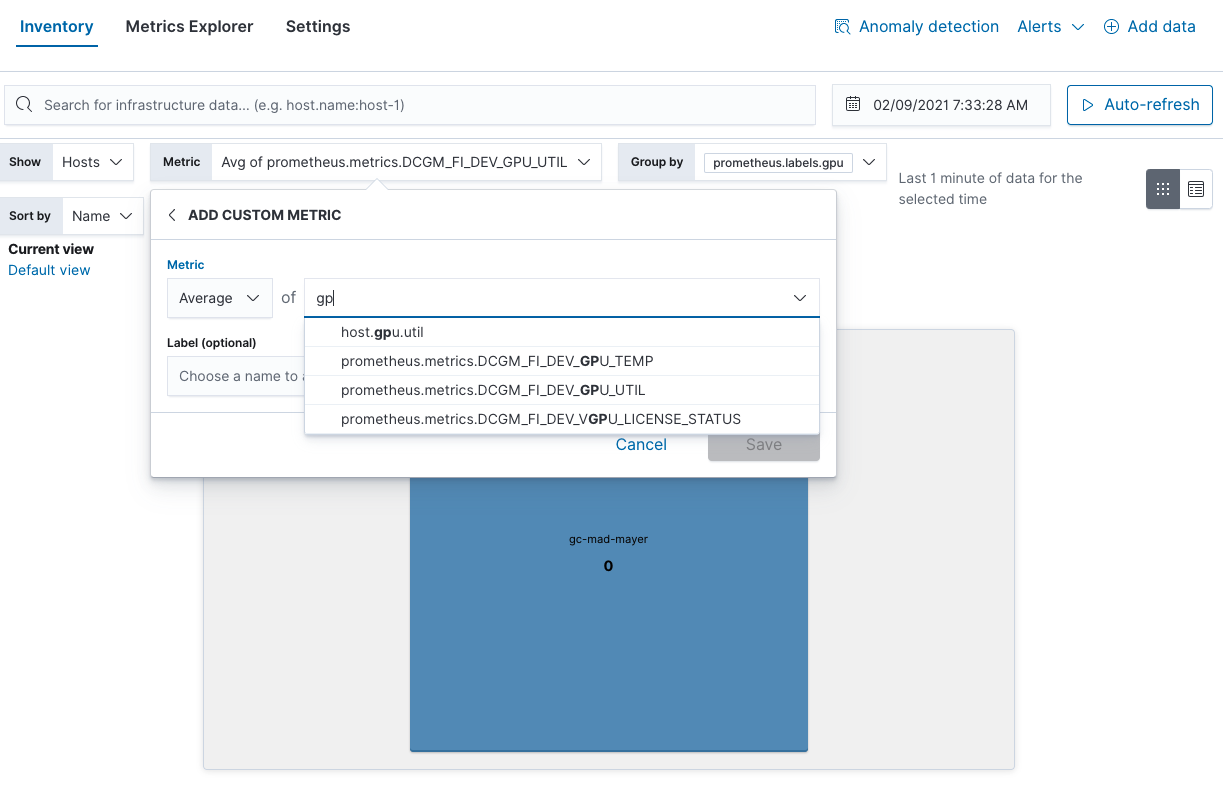
You can also find GPU utilization hotspots in the Inventory view:
GPU monitoring considerations
We hope you found this post useful. Those are just a few monitoring options, but Elastic Observability lets you tackle all of your goals. Here are a few other examples of good GPU things to monitor per NVIDIA:
- GPU temperature: Check for hot spots
- GPU power usage: Higher than expected power usage => possible HW issues
- Current clock speeds: Lower than expected => power capping or HW problems
And if you ever need to simulate GPU load, you can use the dcgmproftester10 command.
dcgmproftester10 --no-dcgm-validation -t 1004 -d 30
You can take your monitoring further by using Elastic alerting to automate NVIDIA’s recommendations. Then take it to the next level by finding anomalies in your GPU infrastructure with machine learning. If you’re not an existing Elastic Cloud customer and would like to try out the steps in this blog, you can sign up for a free 14-day trial.