How KeyBank used the Elastic Stack to build an enterprise monitoring solution
This post is a recap of a community talk given at Elastic{ON} Tour Chicago in 2019. Interested in seeing more talks like this? Check out the conference archive or find out when the Elastic{ON} Tour is coming to a city near you.
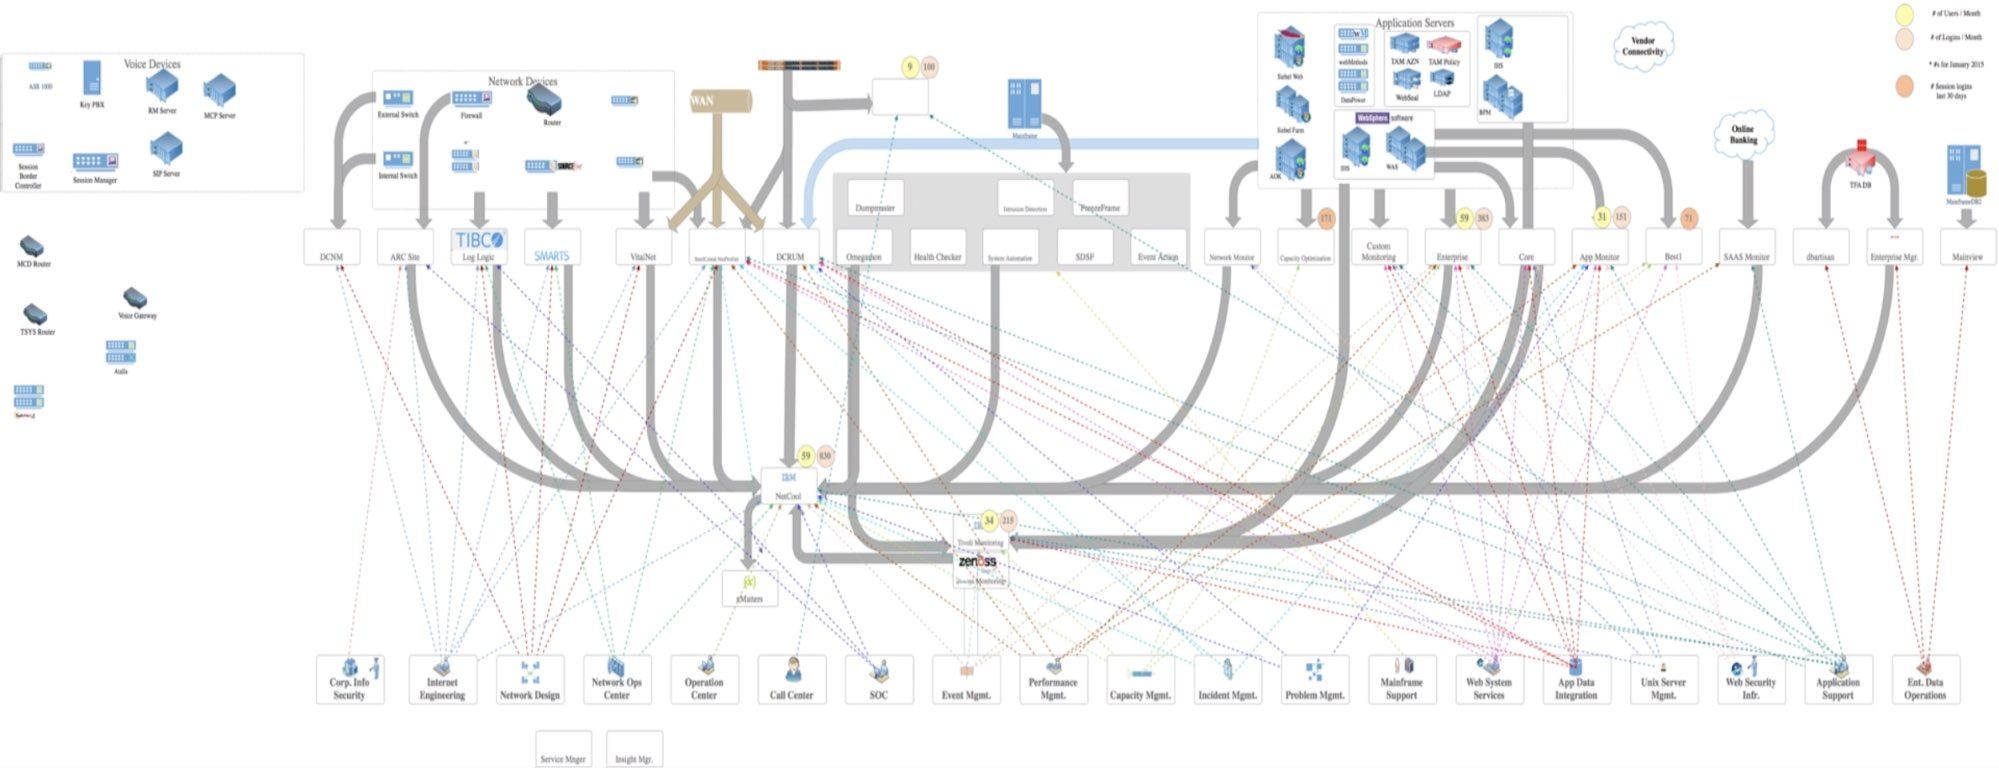
KeyBank is one of the largest banks in the United States. And as the bank has grown, so has their end-to-end monitoring system. With more than 1,100 branches and 1,400 ATMs stretching across 15 states, KeyBank’s infrastructure had evolved into a “Noah’s Ark of design,” says Mick Miller, Senior Product Manager, Cloud Native at KeyBank. In other words, they had two of everything, resulting in 21 different data islands. "We found that our mean time to resolution was really slow, but our mean time to blame was very fast."
Digging up the roots
With so many systems, and no way to easily correlate data across silos, the team had no visibility into the root cause of problems. Branches were reporting poor workstation performance and their mobile banking app ratings were dropping, but without correlated observability data, their hands were tied. On top of that, their logging and metrics systems started running out of storage capacity — halting all new monitoring — and the cost to upgrade the license of their previous provider was too steep to even consider.
As the team started to create a huge backlog of monitoring requests, sapping the time they needed to develop a new system, an even more critical problem arose: performance-based customer loss. For example, when some customers went in to open accounts, the system would crash repeatedly, creating long lags and poor user experience. And when potential customers can’t easily open an account, they’ll find another bank.
Bolstering observability with Elasticsearch
With their systems no longer providing the logs and metrics that were needed in order to investigate non-security related issues, KeyBank turned to the Elastic Stack. Using the Elasticsearch dev cluster they'd set up, they deployed Winlogbeat and Metricbeat to thousands of workstations across their branch network and started indexing log and metric data. A couple of days later, they had a wealth of insight and identified three root causes: consistently high disk I/O, low available memory, and a completely saturated network.
As more KeyBank employees saw response time data visualized within Kibana, the sense of urgency mounted. The team needed to begin a massive refresh effort across their entire system, and management gave the green light to deploy the first production cluster. The influx of observability data gave them the visibility they needed, but they ran into another issue: The stream was flooding their dev environment. They realized they needed to plan for growth.
"The bad news is: It's really impossible to precisely predict your workload. The good news, though, is we learned along the way that we had to change. And so we designed the architecture of our system to make sure that we were able to — without having downtime — reconfigure our systems." — Mick Miller, KeyBank
Surgical scaling
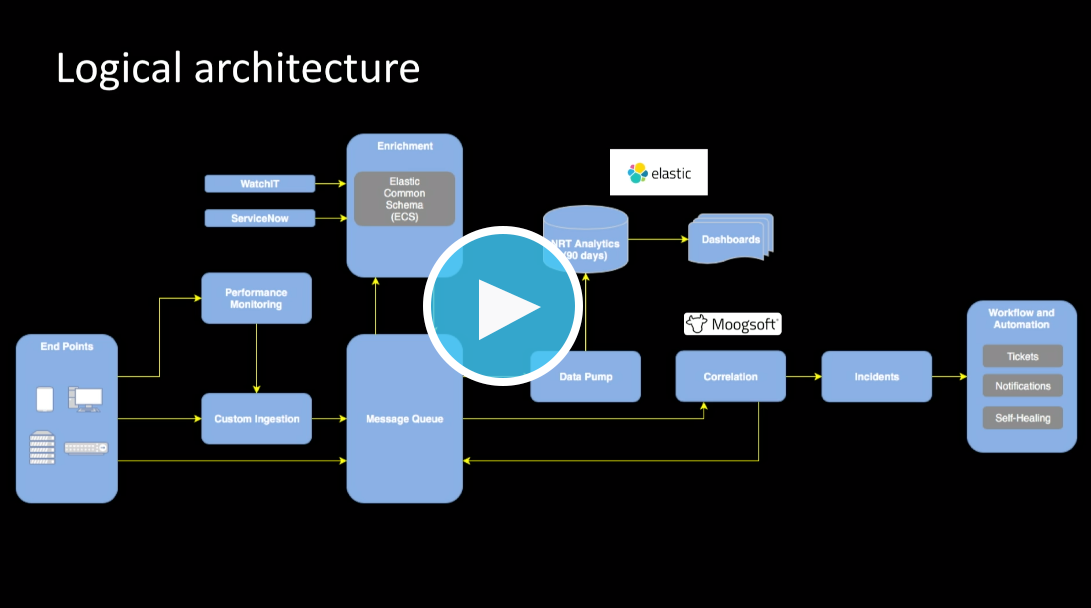
As their monitoring needs grow, KeyBank is evolving the Elasticsearch monitoring system using an iterative approach to scale their end-to-end system. After some fine-tuning, their architecture now follows a few core principles that allows them to be “surgical” about the changes they make so they don’t affect the entire system. Each of the logical tiers must be:
- Independently scalable
- Highly available
- Fault tolerant
Fortunately, these are areas where Elasticsearch — and its horizontal architecture — shines. KeyBank’s end-to-end ingestion to indexed performance is now under half a second, so if they don’t meet that SLA, all they have to do is scale out. "There are all these unexpected benefits to having all the data in one place, and we feel Elasticsearch is a great solution for that,” says Miller.
Learn more about how (and when) to scale your Elasticsearch system by watching How KeyBank Used Elastic to Build an Enterprise Monitoring Solution from Elastic{ON} Tour Chicago 2019. You’ll also hear about how they implemented automation and balanced virtualization against physical computing resources — and saved over $5 million.