How to deploy and manage Elastic on Microsoft Azure


Share on Twitter


Share on LinkedIn


Share on Facebook


Share by email


Print
Elastic® users can find, deploy, and manage Elasticsearch® from within the Azure portal. This integration provides a simplified onboarding experience, all with the Azure portal and tooling you already know, so you can easily deploy Elastic without having to sign up for an external service or configure billing information.
In this blog post, you’ll learn how to create and manage Elasticsearch on Azure, as well as how to automate the ingestion of Azure logs and metrics into Elastic.
Getting started with Azure
First, log in to the Azure portal. We’ll walk through the steps required to create an Elasticsearch resource on Azure. Behind the scenes, this process will provision a marketplace subscription with Elastic Cloud.
1. Ensure your Azure account is configured with Owner access on the subscription in which you want to deploy Elasticsearch. You can read more about Azure subscriptions in the Microsoft Azure documentation.
2. Search for Elasticsearchfrom the Azure search bar. Alternatively, you can access the integration from this marketplace listing.
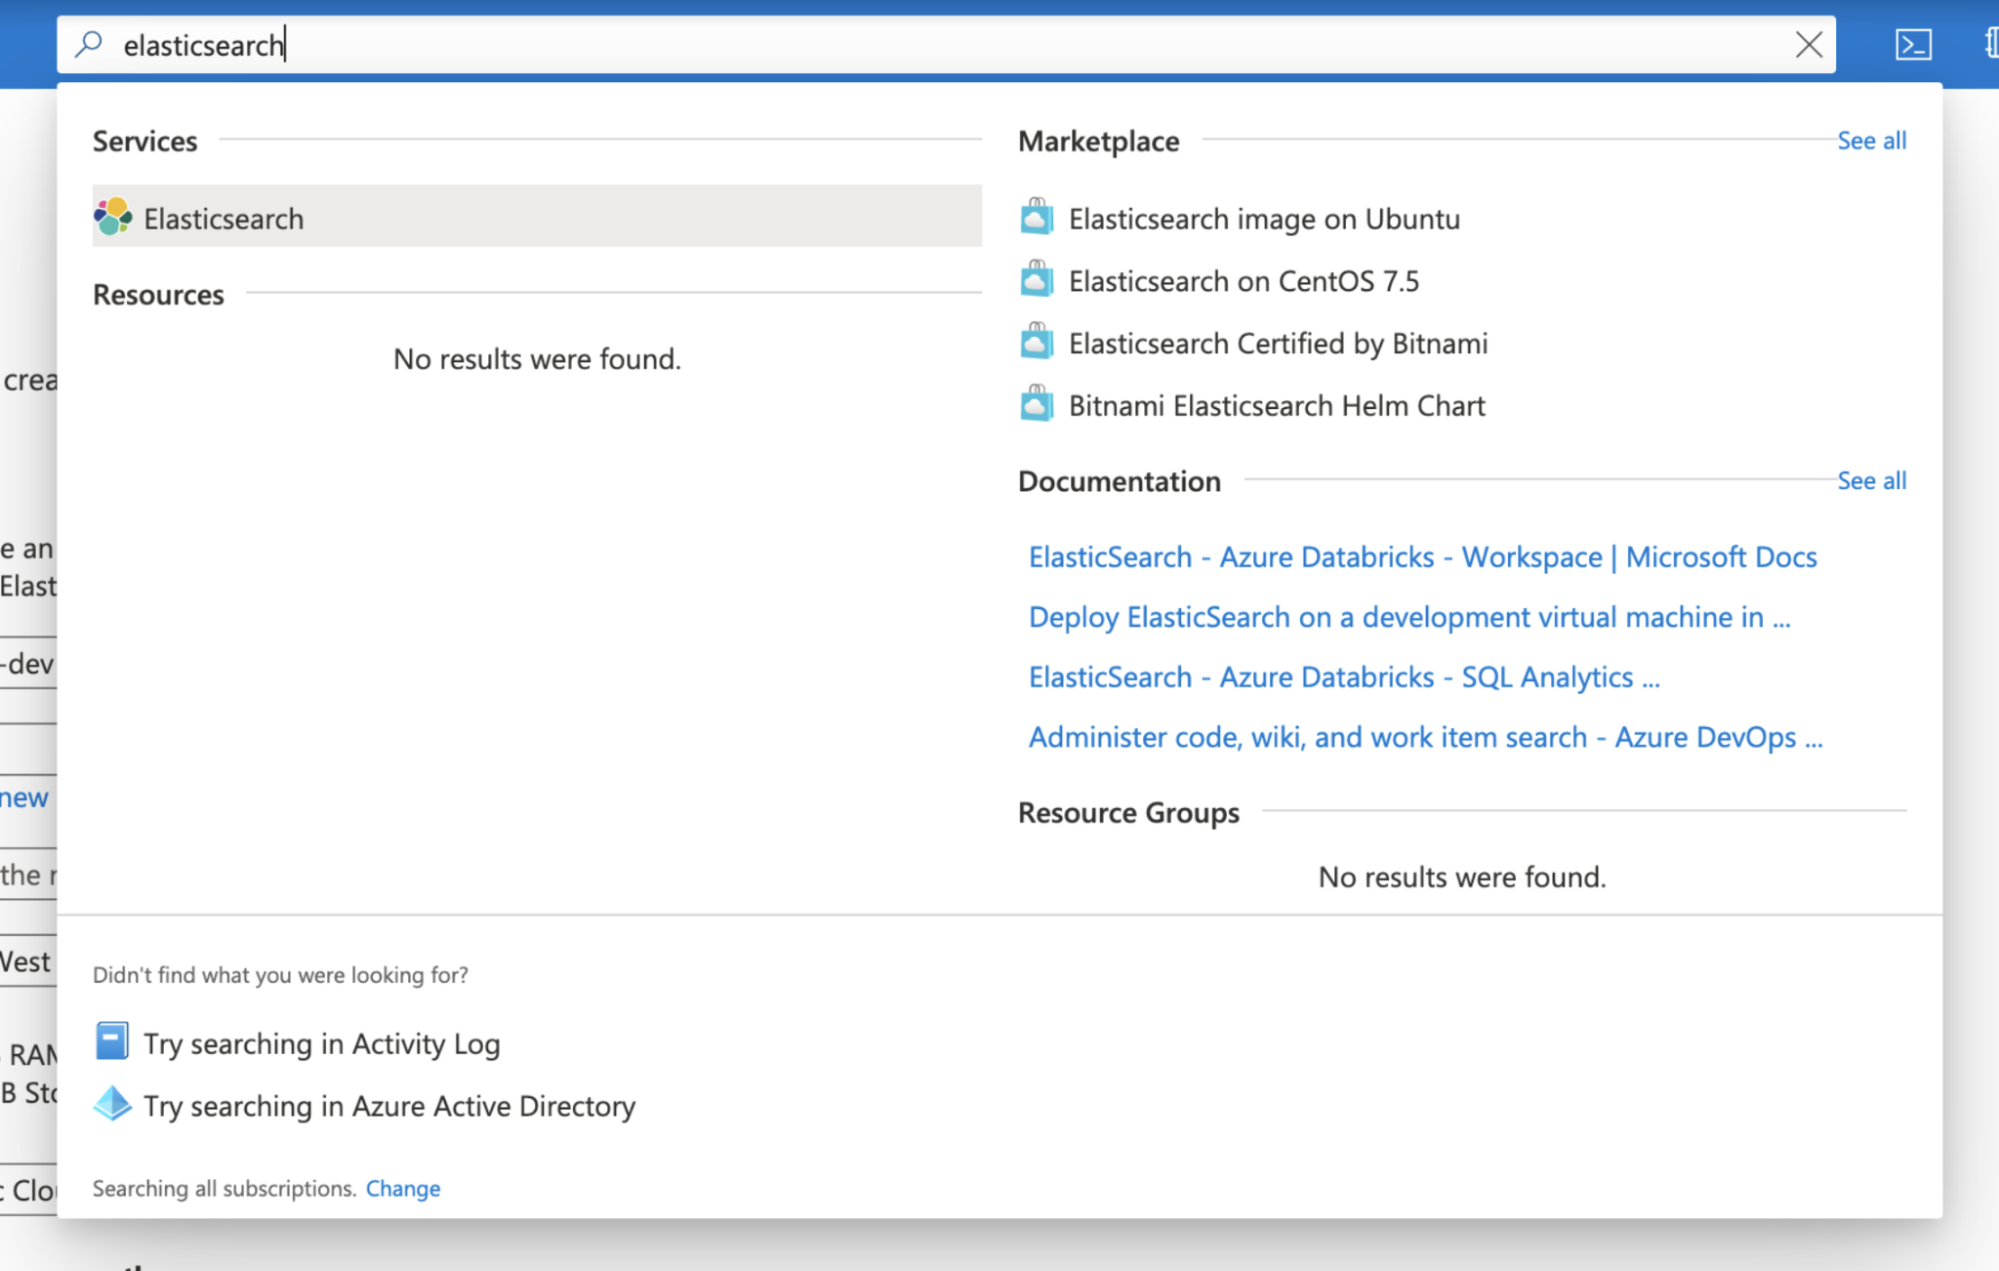
3. Click on Add to begin creating an Elasticsearch resource.
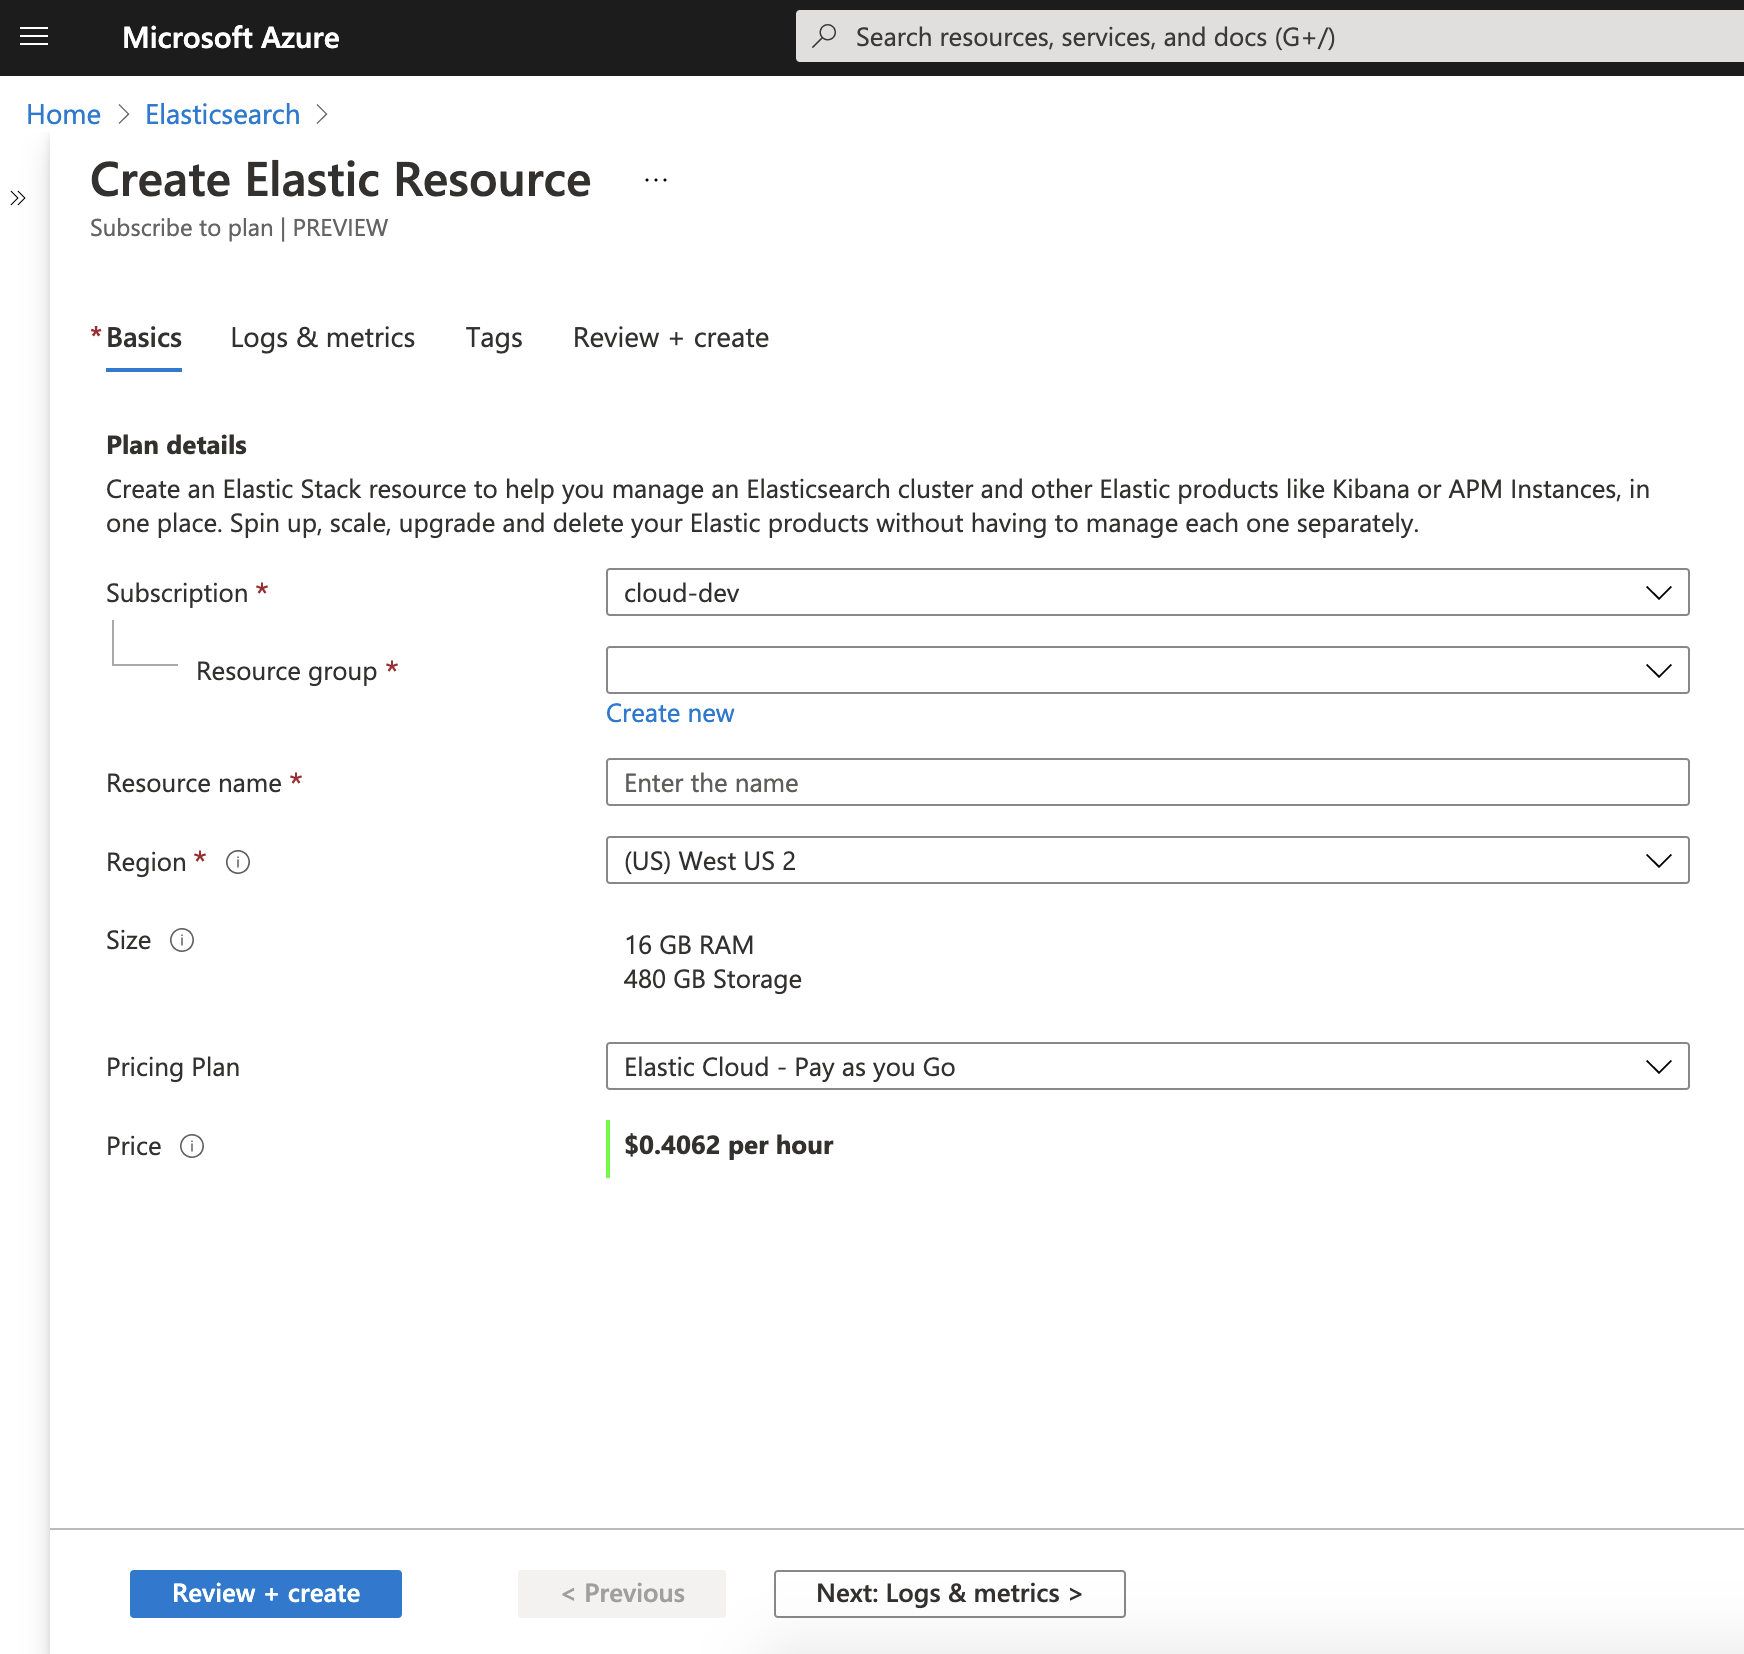
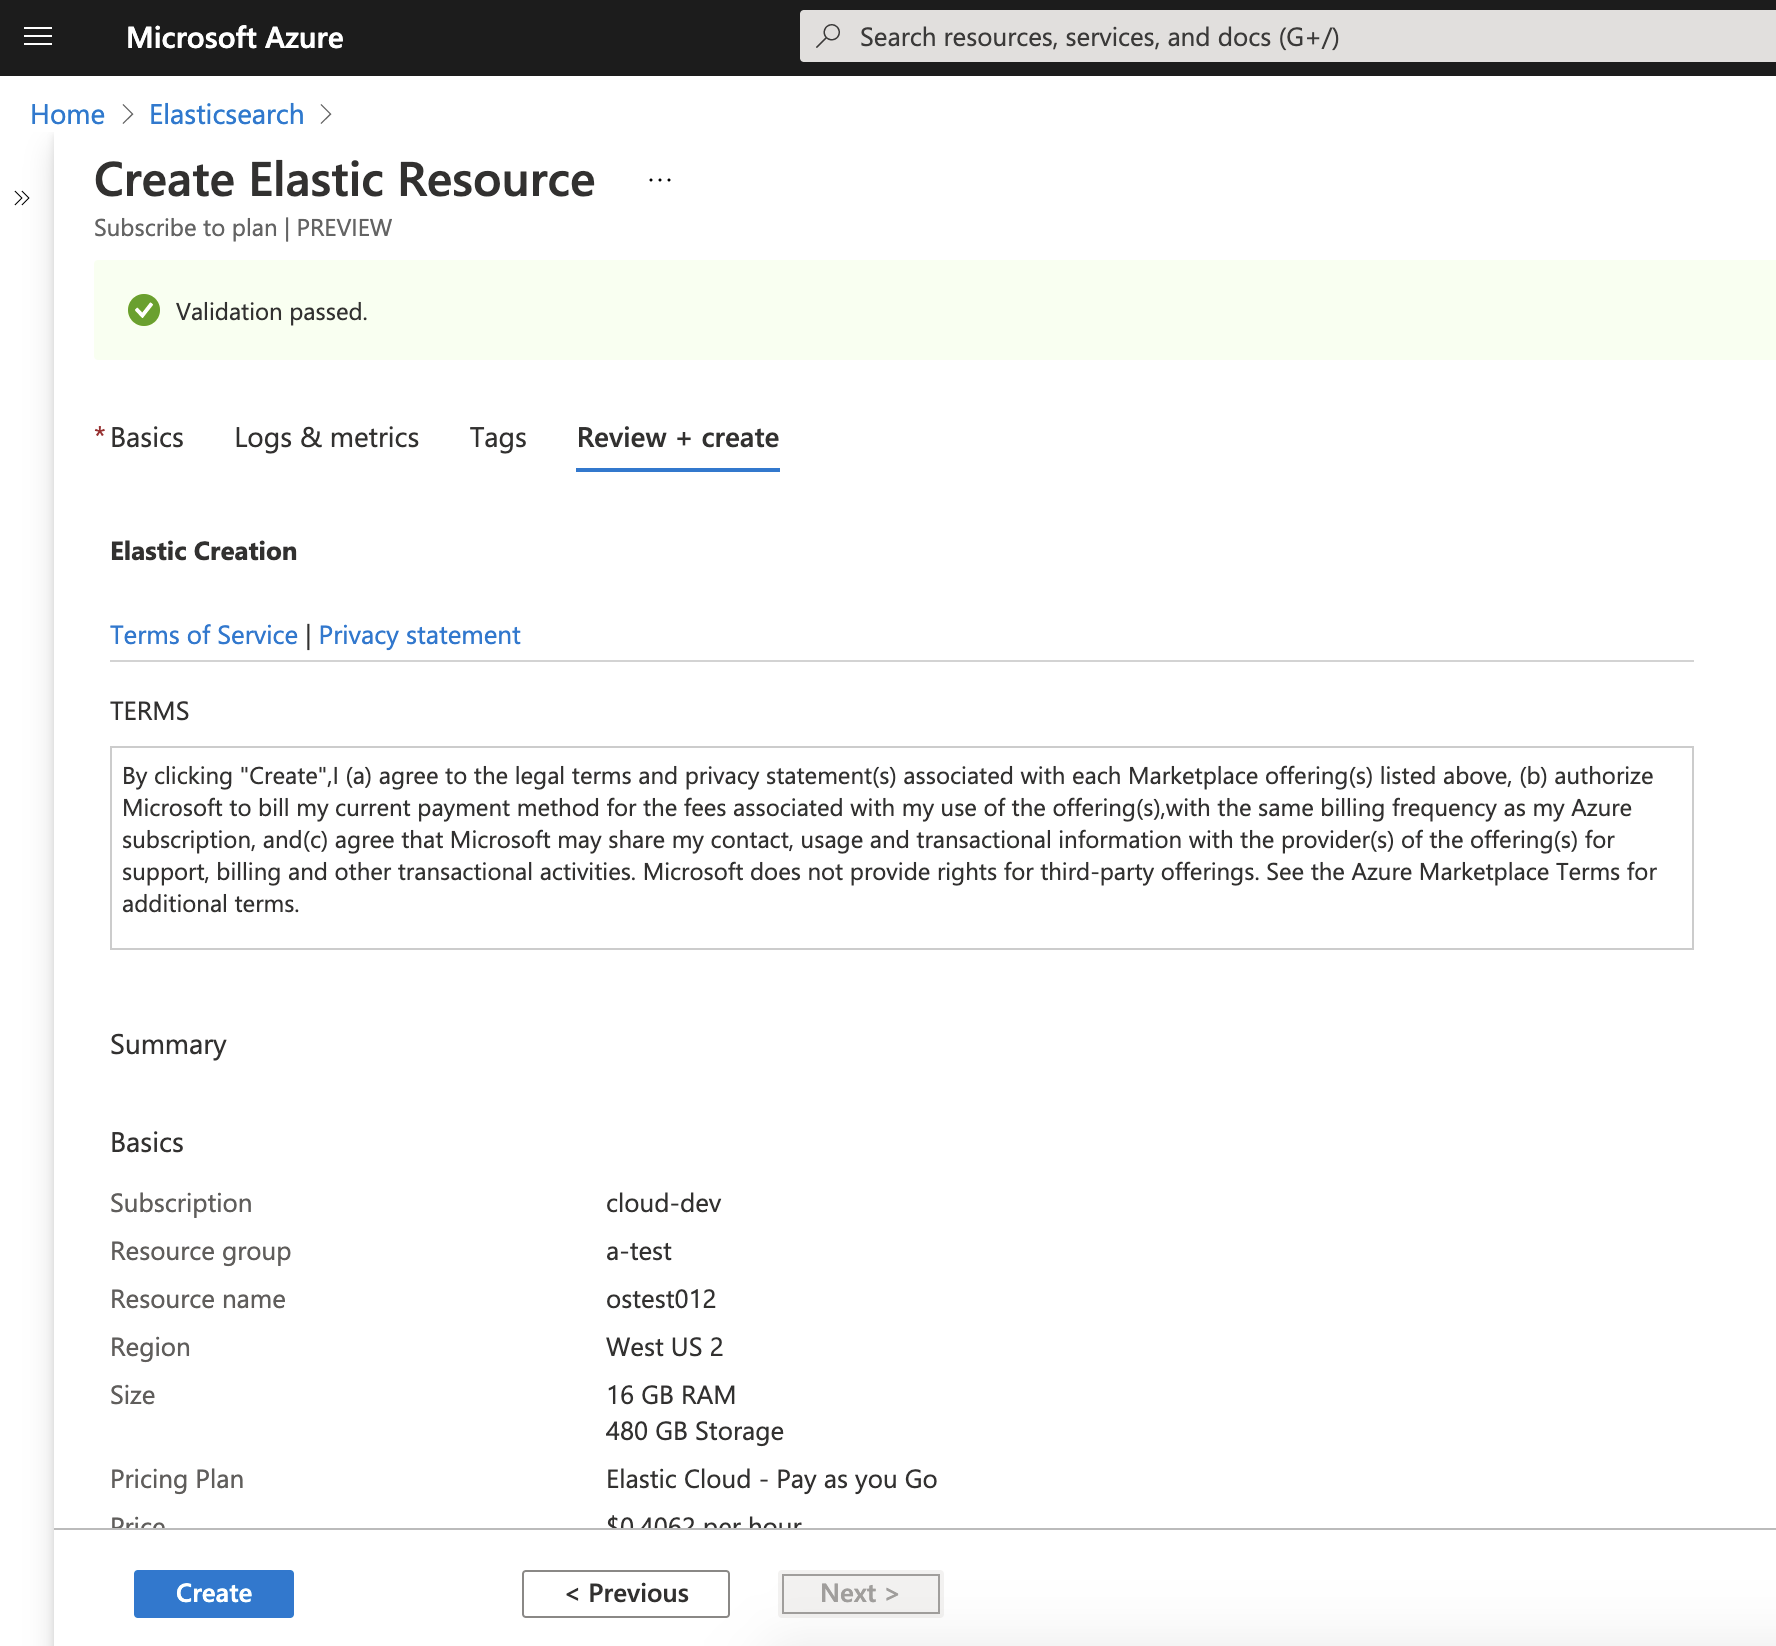
4. Enter the required resource details:
- Subscription: The Azure subscription that this marketplace purchase will reside under
- Resource group: A resource group is associated with the Elasticsearch resource
- Resource name: The name of the Elasticsearch resource
- Region: The region where Elasticsearch will be deployed (Additional Azure regions will be added over time. Check out our documentation to learn more.)
- Version: The Elastic Stack version; defaults to the latest available version
- Size: The size of the Elasticsearch resource (The default cluster size is 480GB of storage and 16GB of RAM. You can modify the size of the cluster after your resource has been created.)
- Pricing plan: Elasticsearch employs pay-as-you-go pricing
- Price: The approximate price, which is based on the region and deployment size (editable after the resource has been created) (For a full price listing, see the Elastic Cloud pricing calculator.)
5. Configure logs and metrics. These flags enable automatic ingestion of Azure subscription activity logs and resource logs into your Elasticsearch cluster.

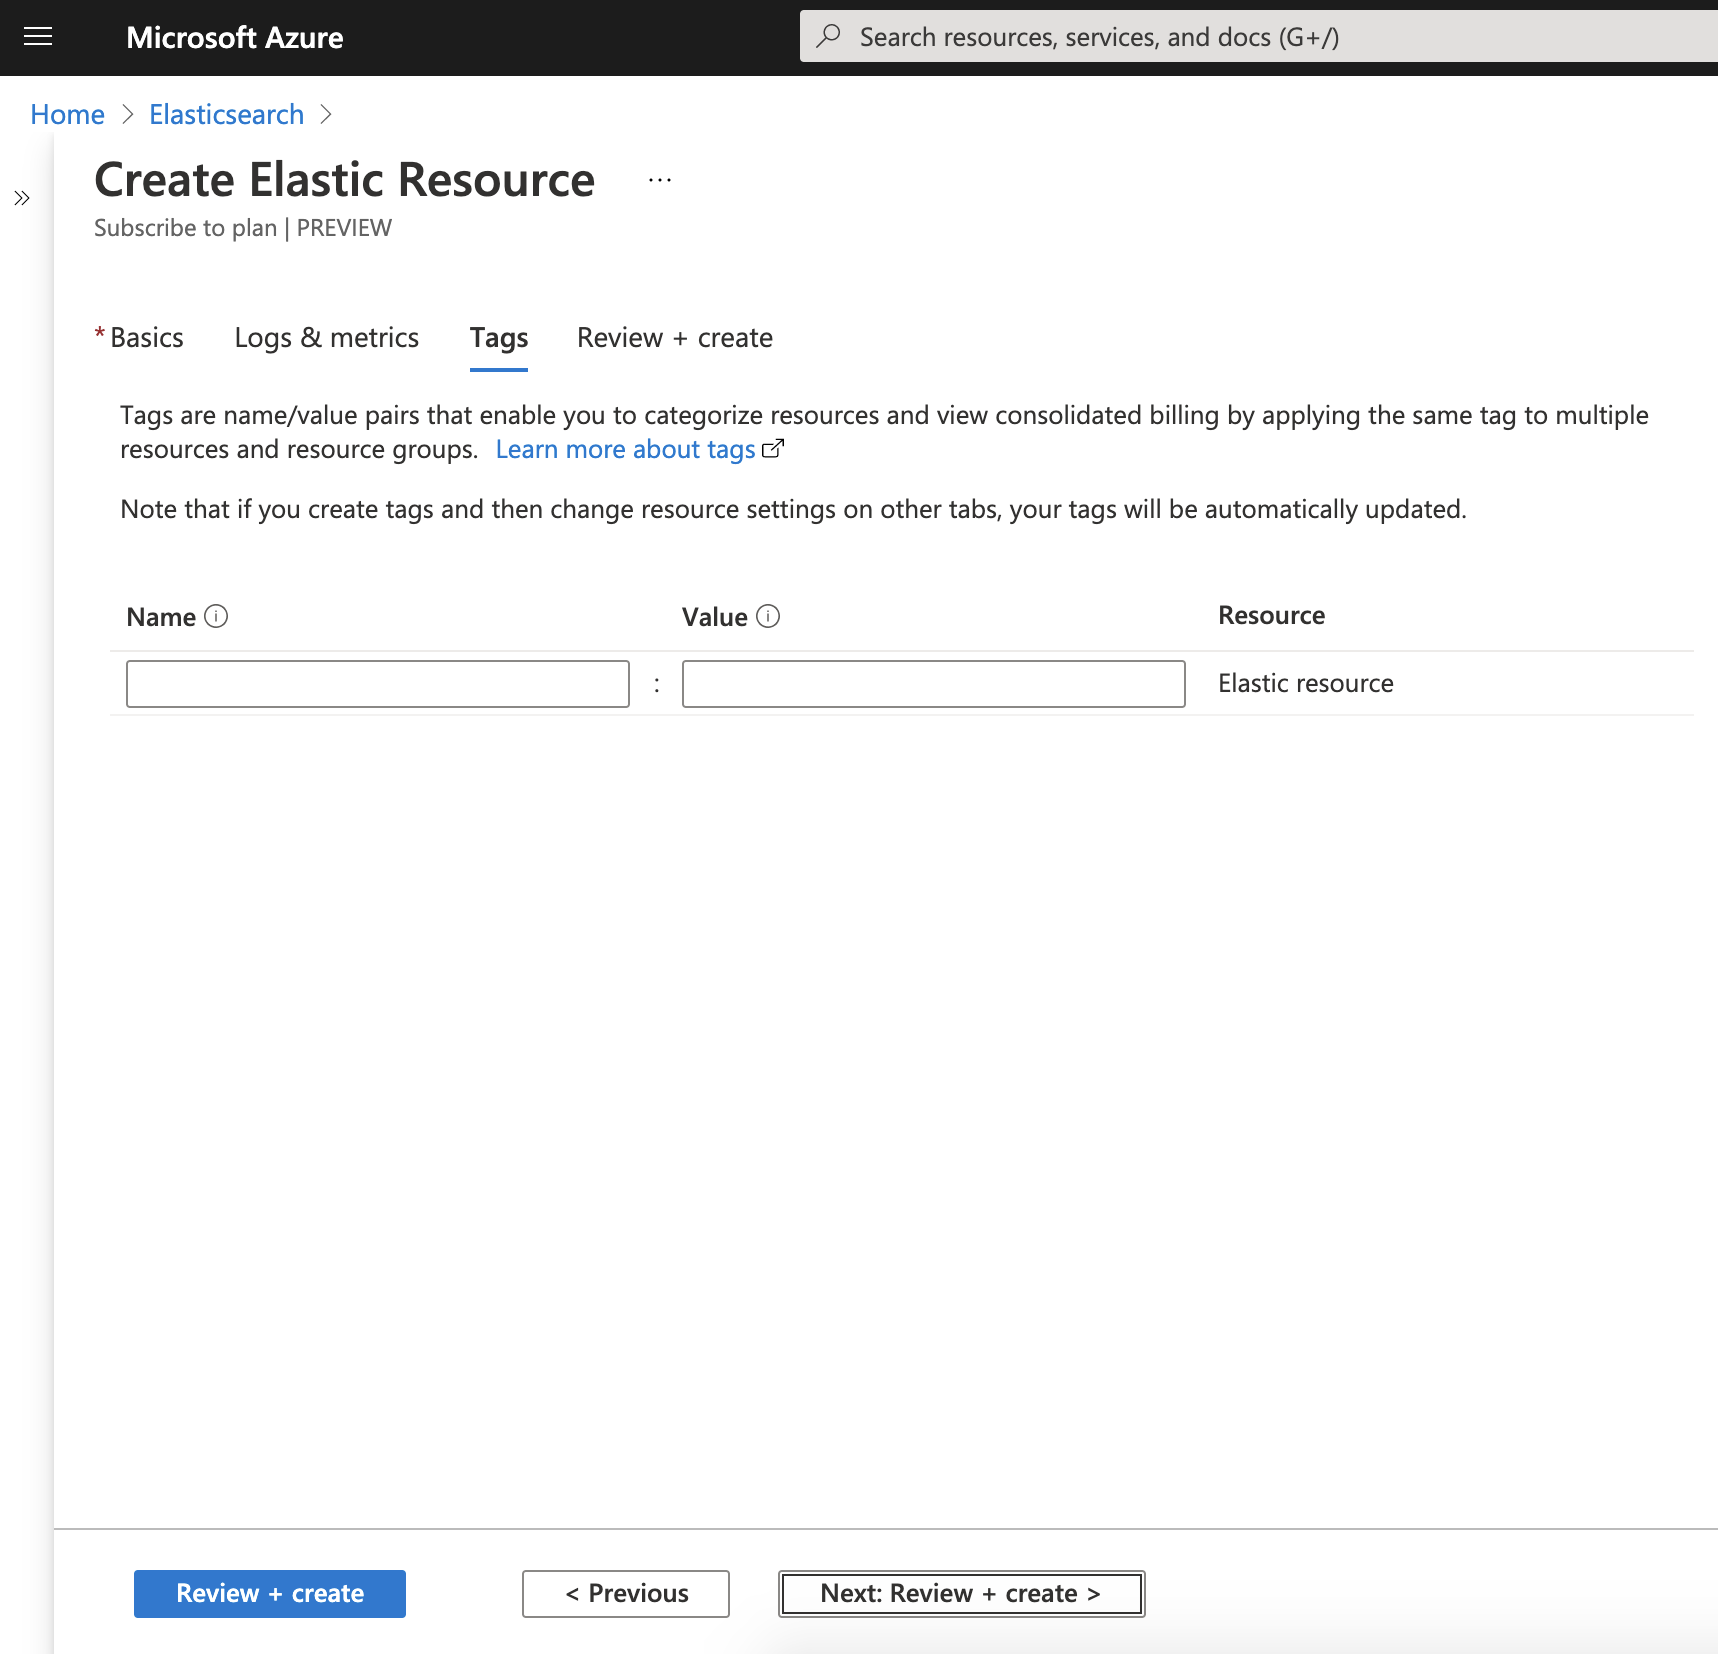
6. Specify resource tags — similar to any other Azure resource.
7. Review your information and select Review + create. This will deploy Elasticsearch.
Congratulations, you successfully deployed Elasticsearch from the Azure portal! Give it a few minutes and you will see the Elasticsearch resource overview page in the portal. You may also notice an Elastic subscription in your Azure account. Elasticsearch resources will also show up on your consolidated Azure bill.
Managing Elasticsearch in Azure
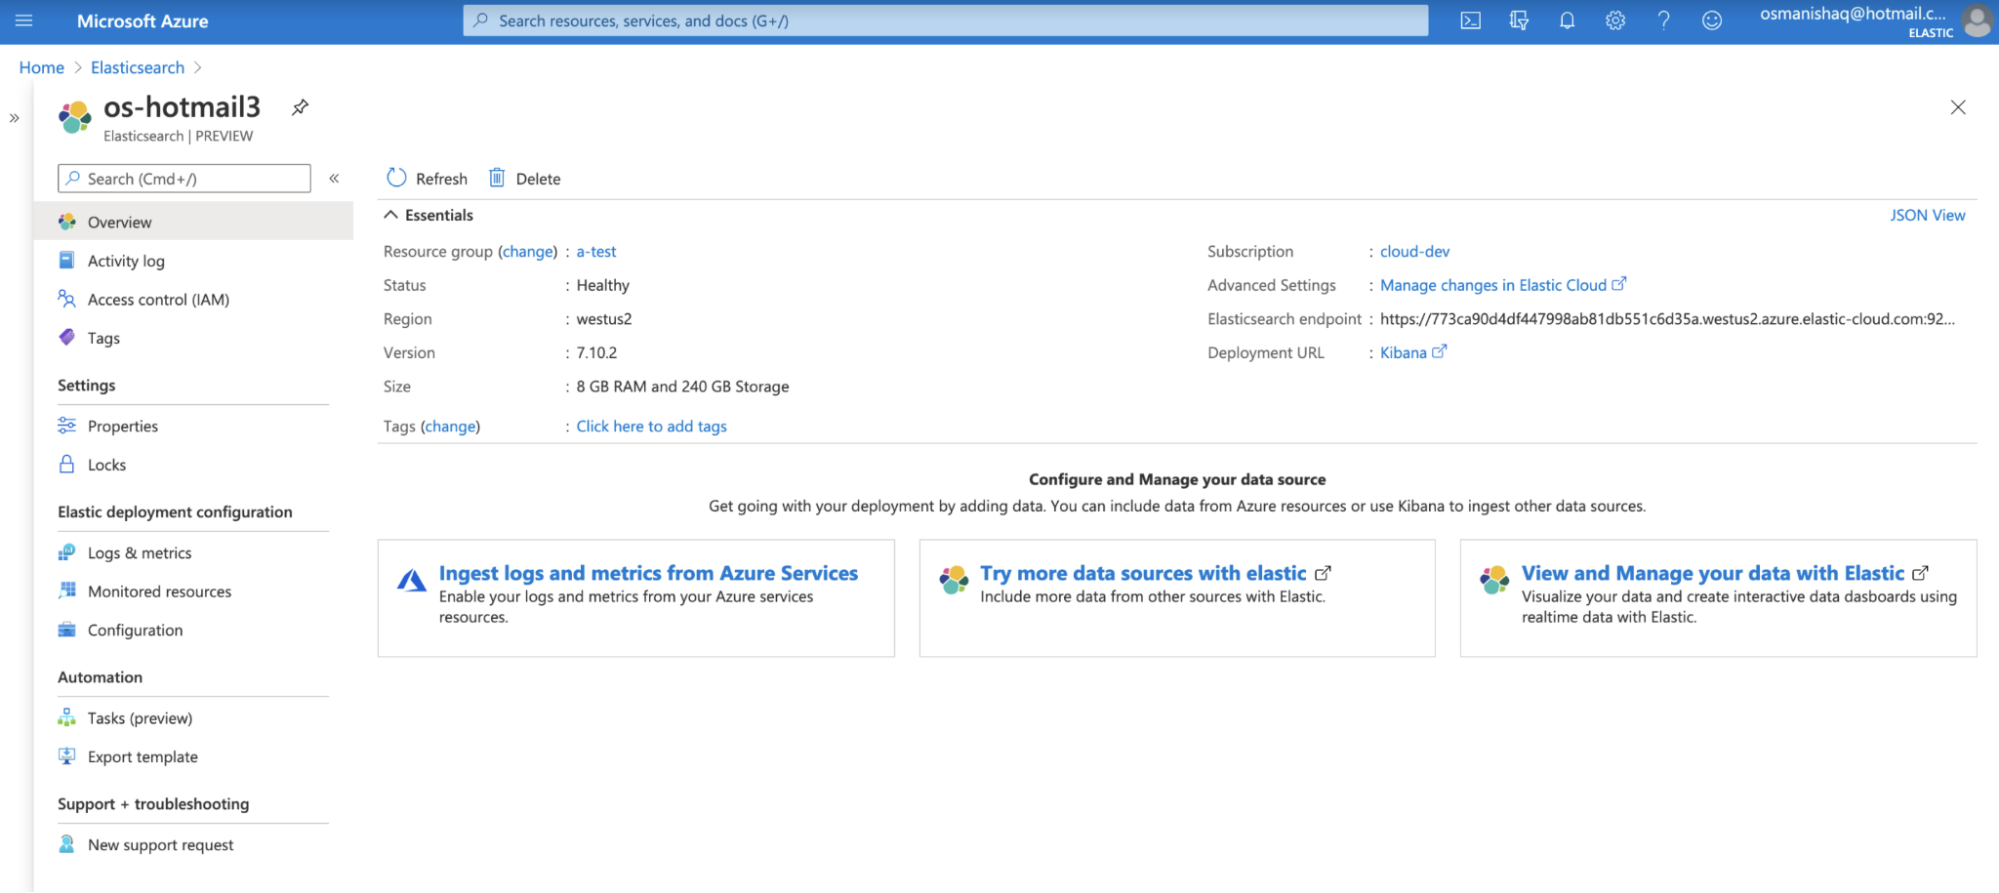
Now that your Elasticsearch resource has been provisioned, let’s take a closer look at the Elasticsearch resource overview page. You’re already familiar with fields we’ve covered above, but this page also displays a few other notable details:
- Status: The status of the Elasticsearch resource — if your cluster is running smoothly, you will see Healthy
- Version: The Elasticsearch version that is deployed (By default, Azure deploys the latest version available. If you are looking to deploy an older version, see Advanced settings just below.)
- Advanced settings: A link to the Elastic Cloud console that allows you to make additional changes to your resource if you require it — the actions you can take in the Elastic Cloud console include:
- Re-size the cluster
- Enable autoscaling
- Upgrade to a newer version of Elasticsearch
- Set up a traffic filter to secure connectivity
- Elasticsearch endpoint: The endpoint to the Elasticsearch API
- Deployment URL: The Kibana® link that will help you get started with Elastic
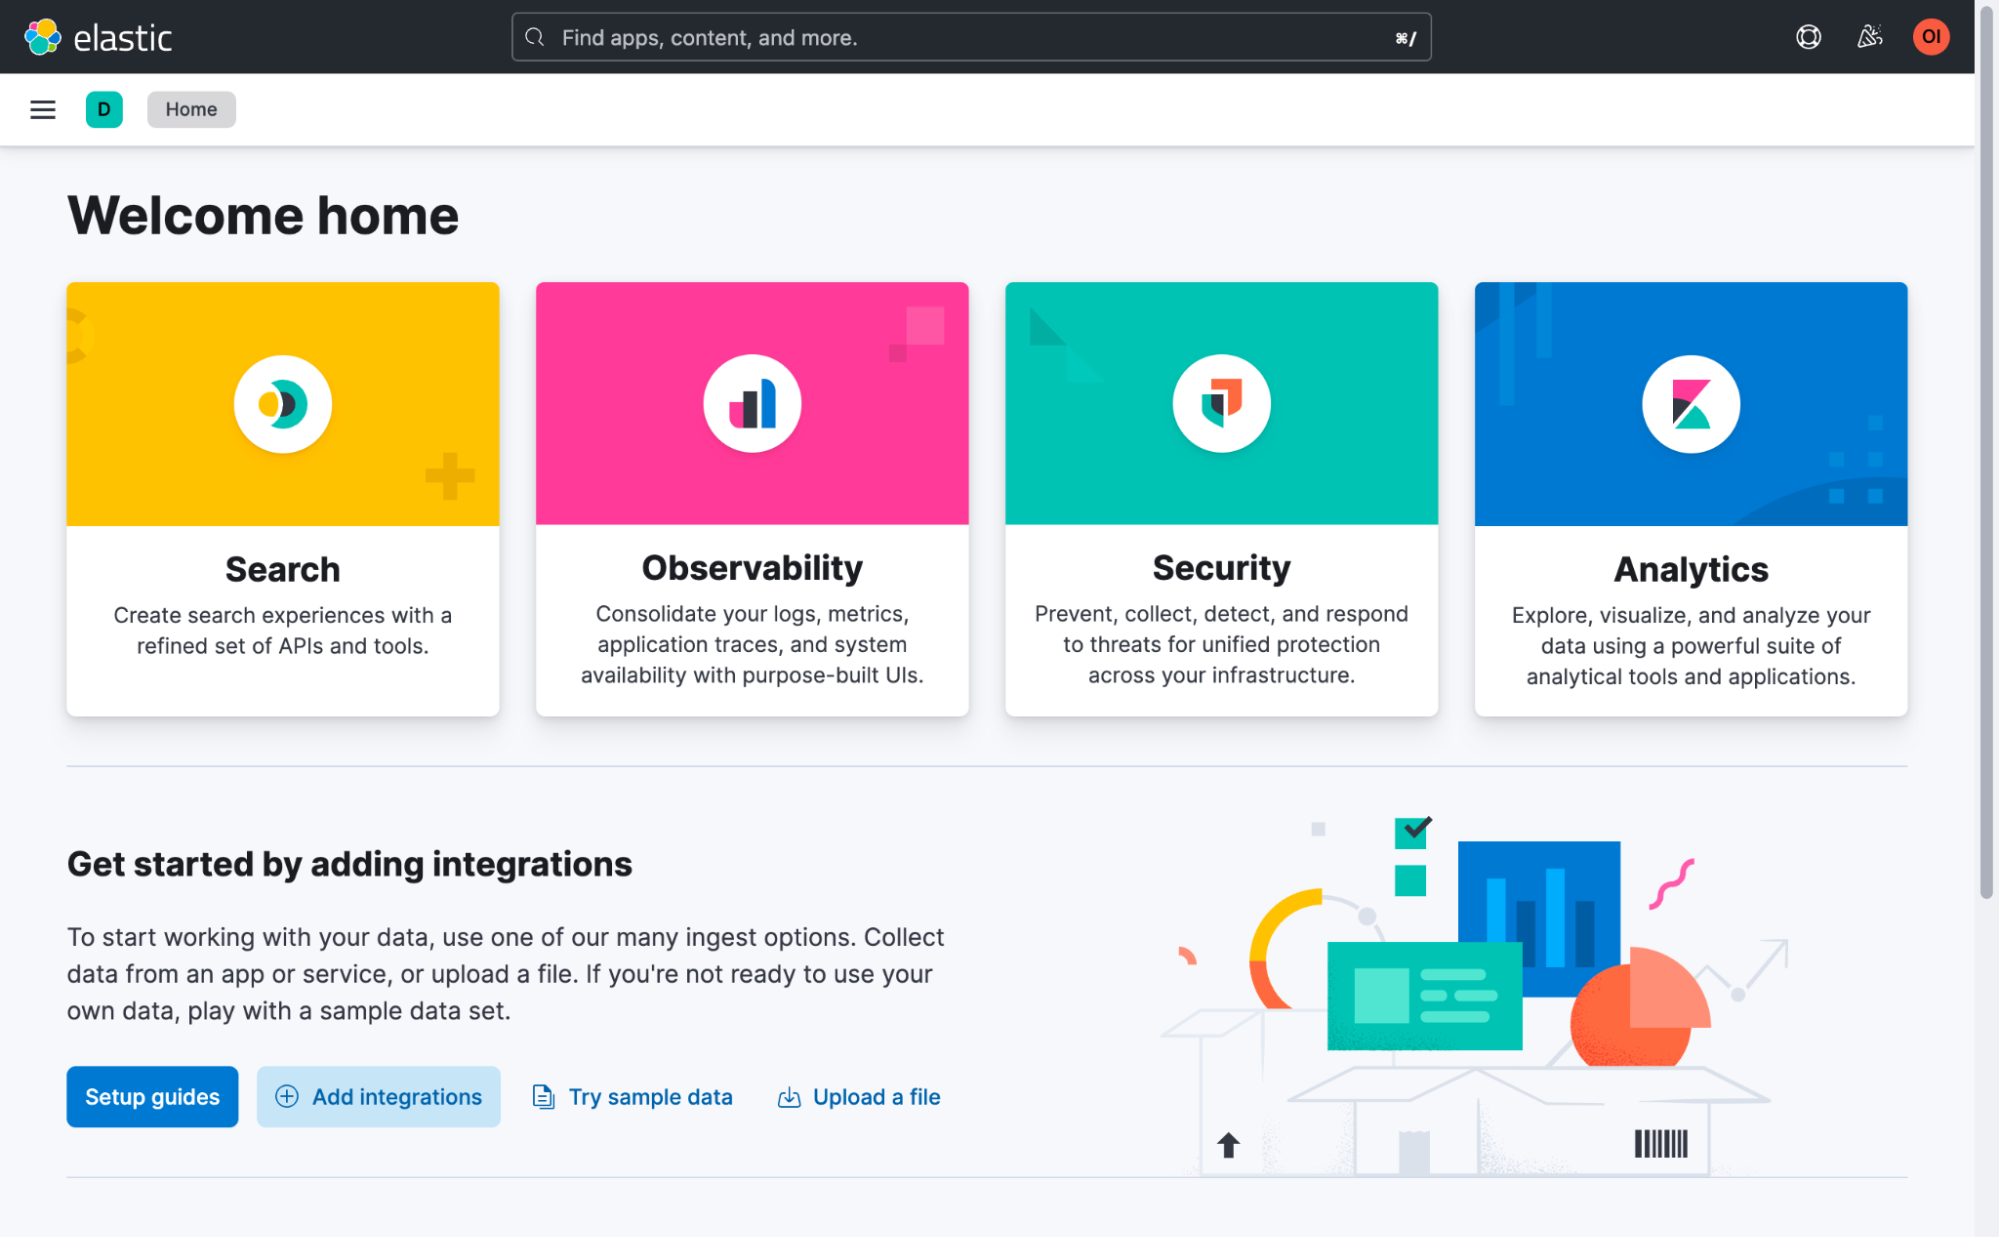
Exploring Elastic solutions
You can now explore all that Elastic has to offer for search, observability, security, and analytics use cases. To get started, click on Kibana from the Elasticsearch overview page in Azure. Select your Azure account to follow through with single sign-on directly into Elastic.
From Elastic, you can follow the in-product guides to configure an integration, ingest your data, and begin exploring your data to get meaningful insights. You can also optimize your data ingestion process by taking advantage of Fleet. Simply navigate to Fleet in the left menu and then select Integrations to view the various types of data you can ingest.
Azure logs and metrics
The Elastic integration allows you to automate the ingestion of Azure logs and metrics into Elastic. There are two integration points:
Azure subscription and resource logs
Azure subscription logs provide insight into any subscription-level events. Azure resource logs describe the operation of those services or resources. Together, these logs provide an overview of the Azure platform to help analysts and administrators better audit activity within Azure. With this Elastic integration enhancement, these logs can easily be exported from Azure into Elastic with a few clicks, eliminating the need to manually deploy an agent or configure an ingest workload.
To get started with ingesting subscription and resource logs:
1. Navigate to the Logs & metrics tab. This can be accessed from the Create Elastic Resource flow or from an existing Elasticsearch resource from the overview page.
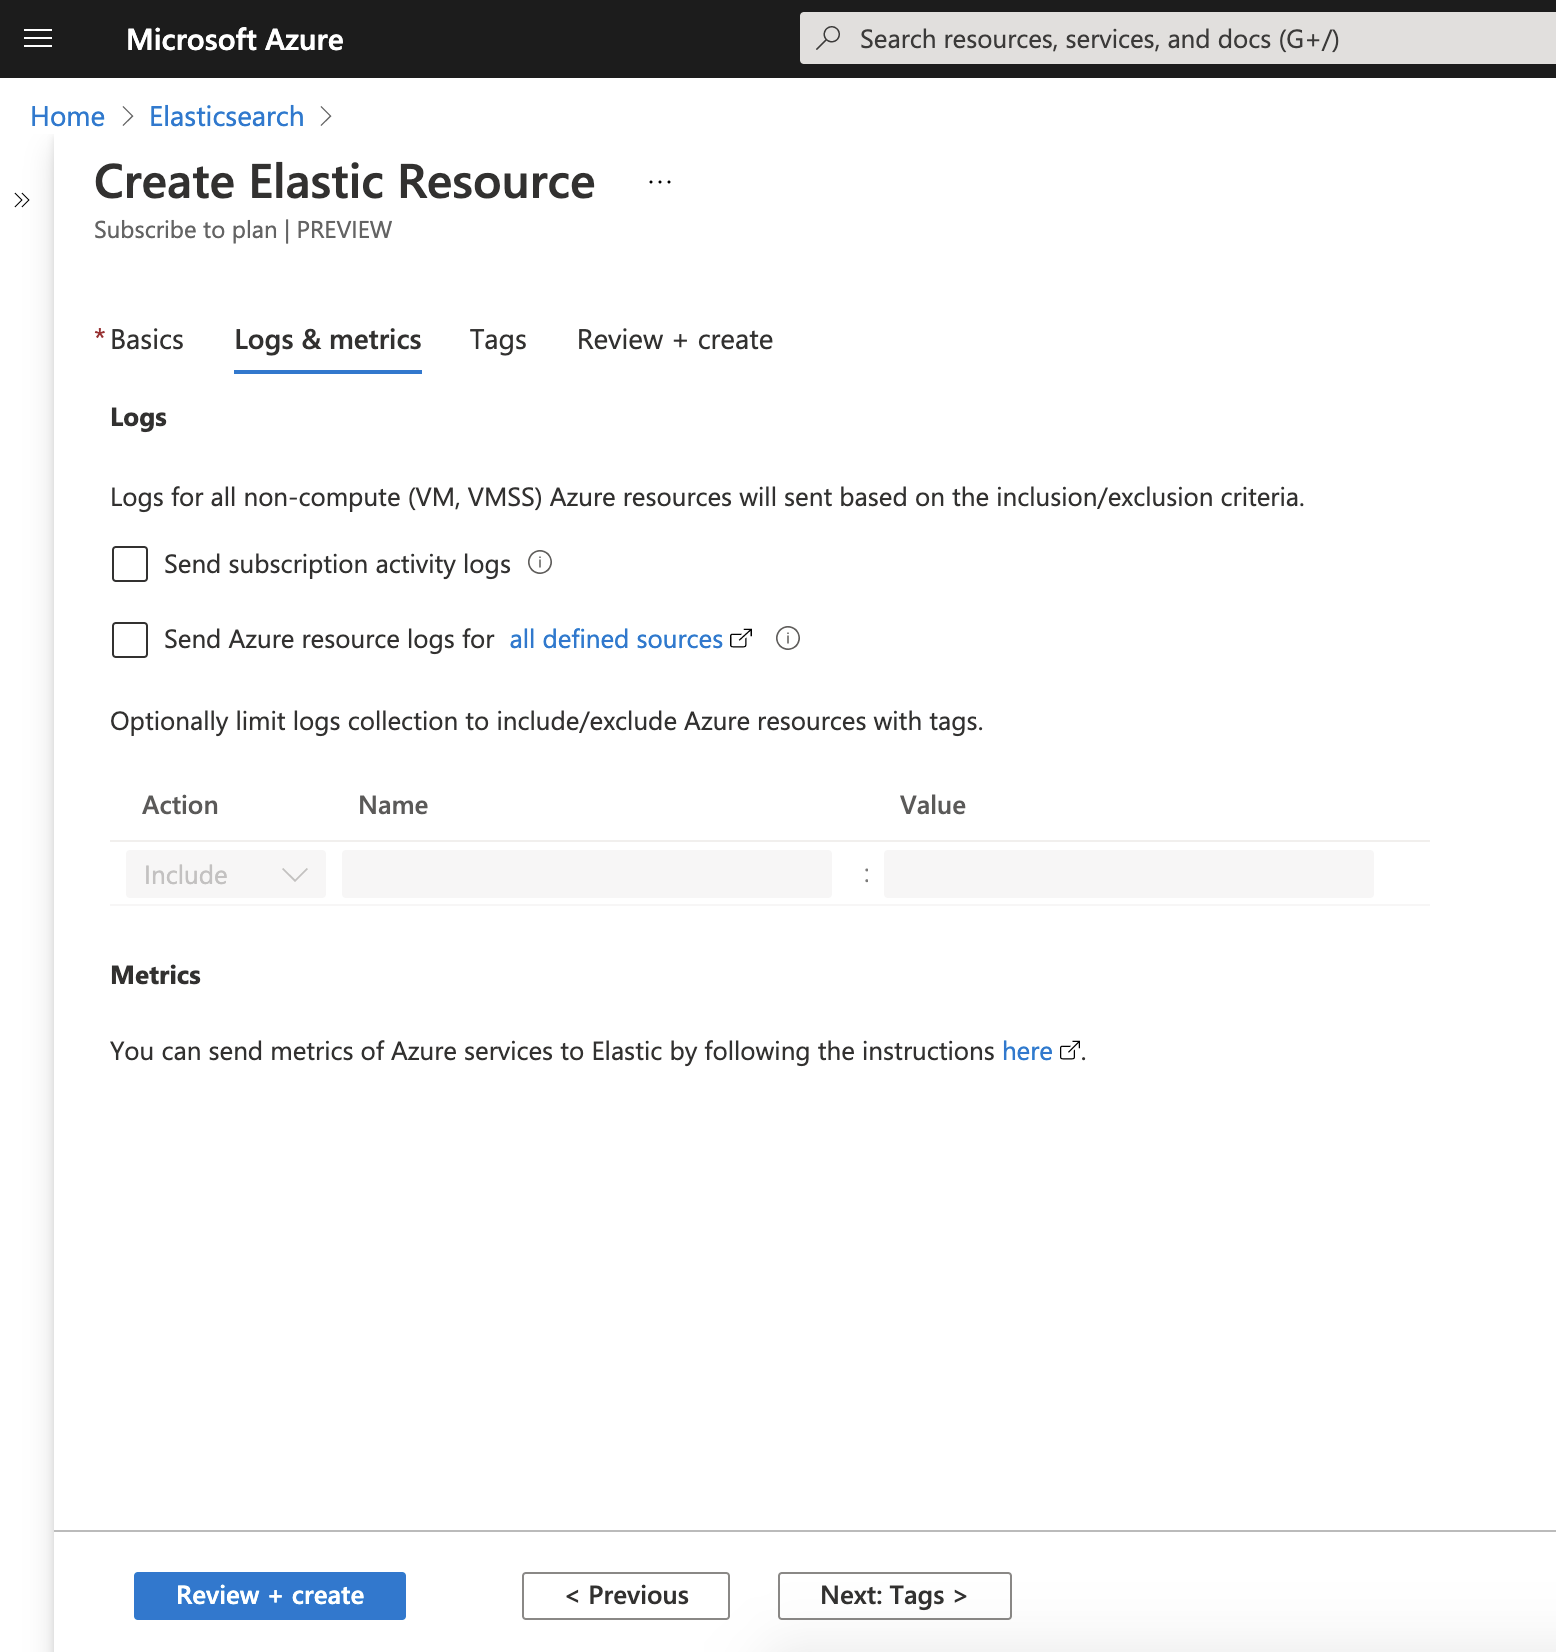
2. Click on the checkboxes for subscription activity logs and/or resource logs.
3. Optionally, you can specify tag rules to include or exclude specific resources from log collection. By default, if no tag rule is specified, the logs from all supported resources will be ingested.
4. Select Save (or finish creating your resource). Log data will begin to appear in Elastic shortly afterward.
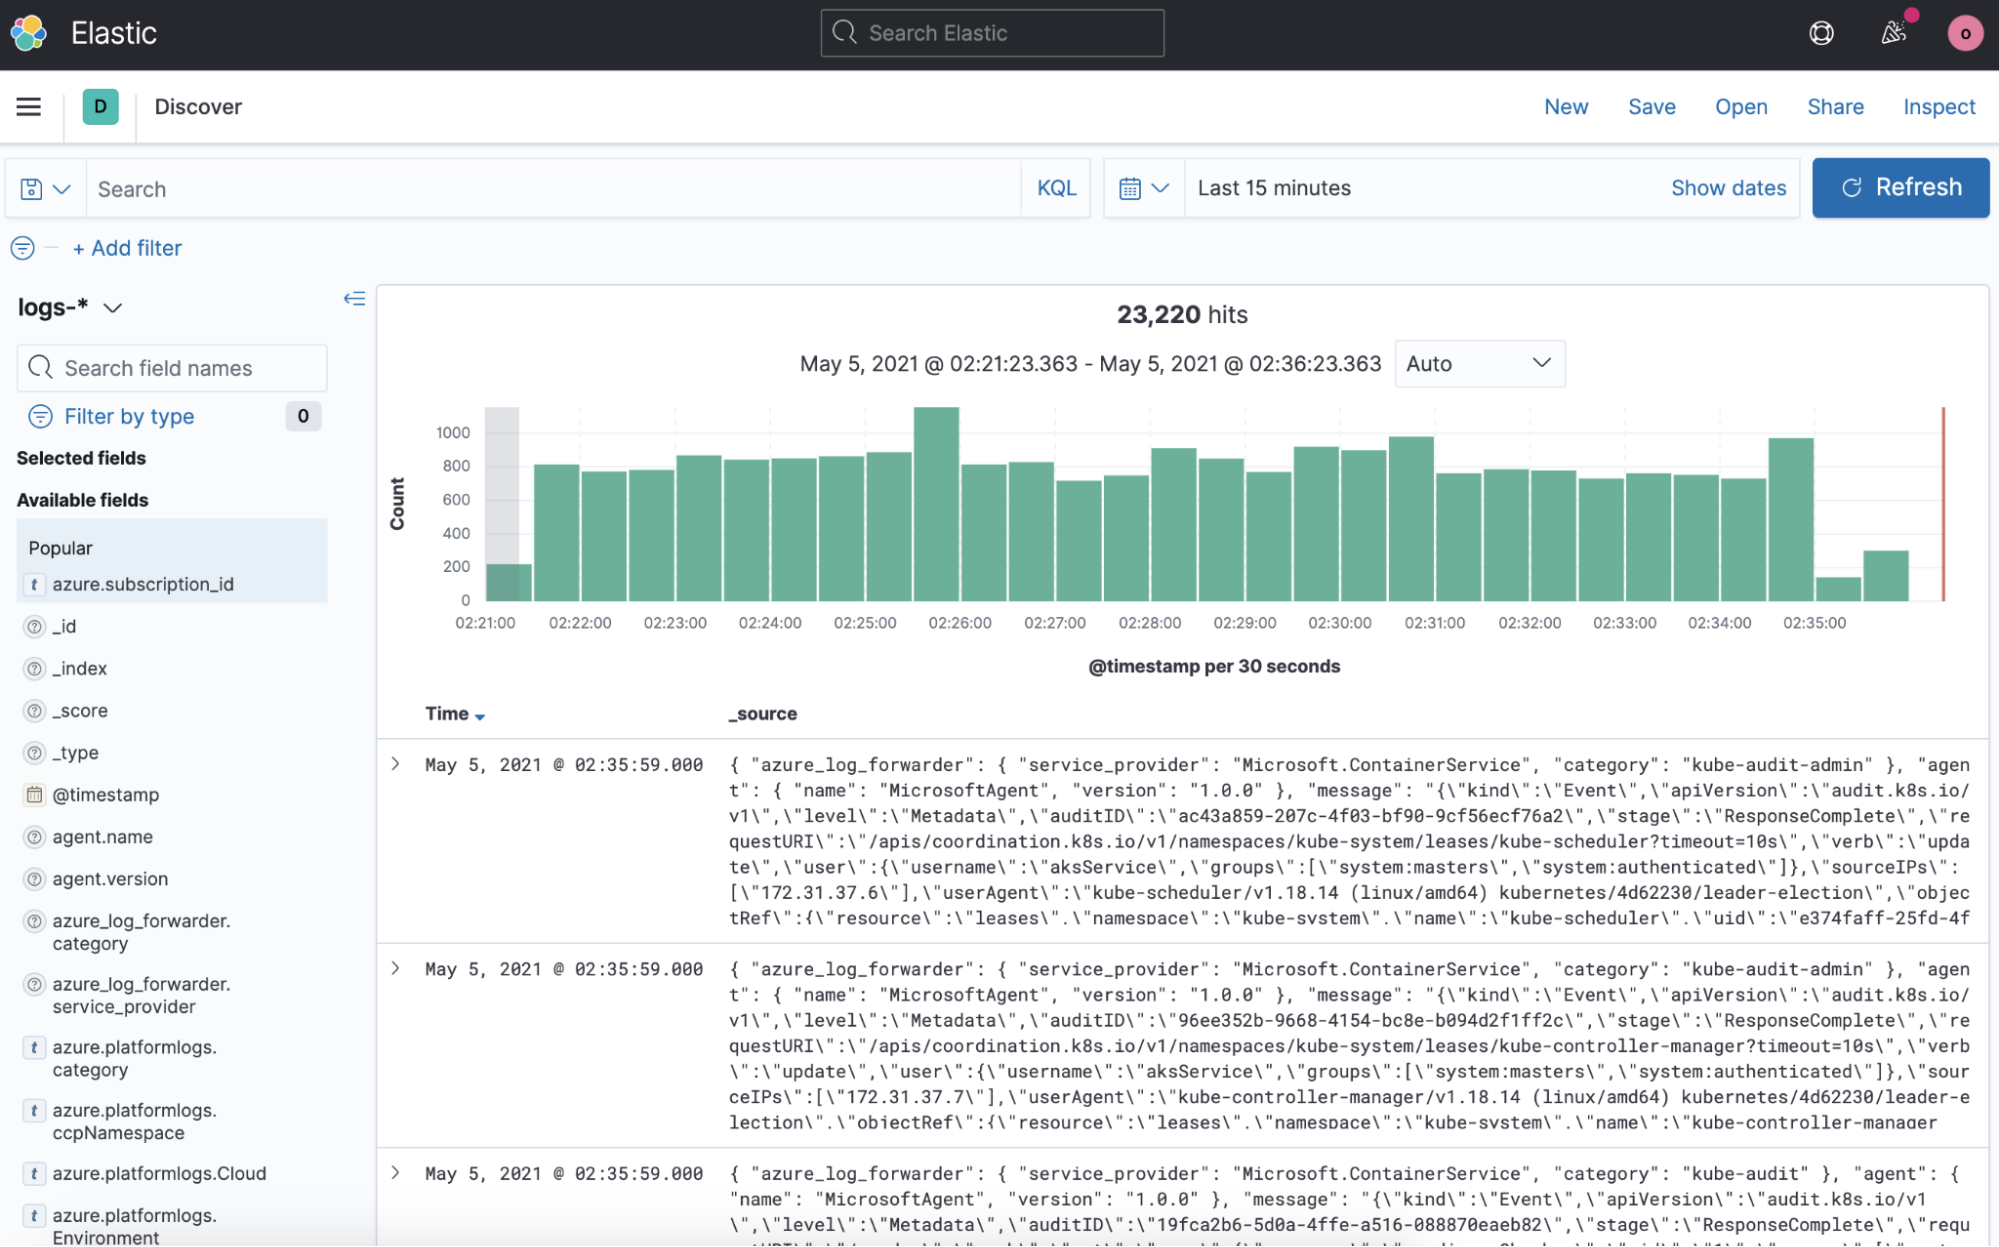
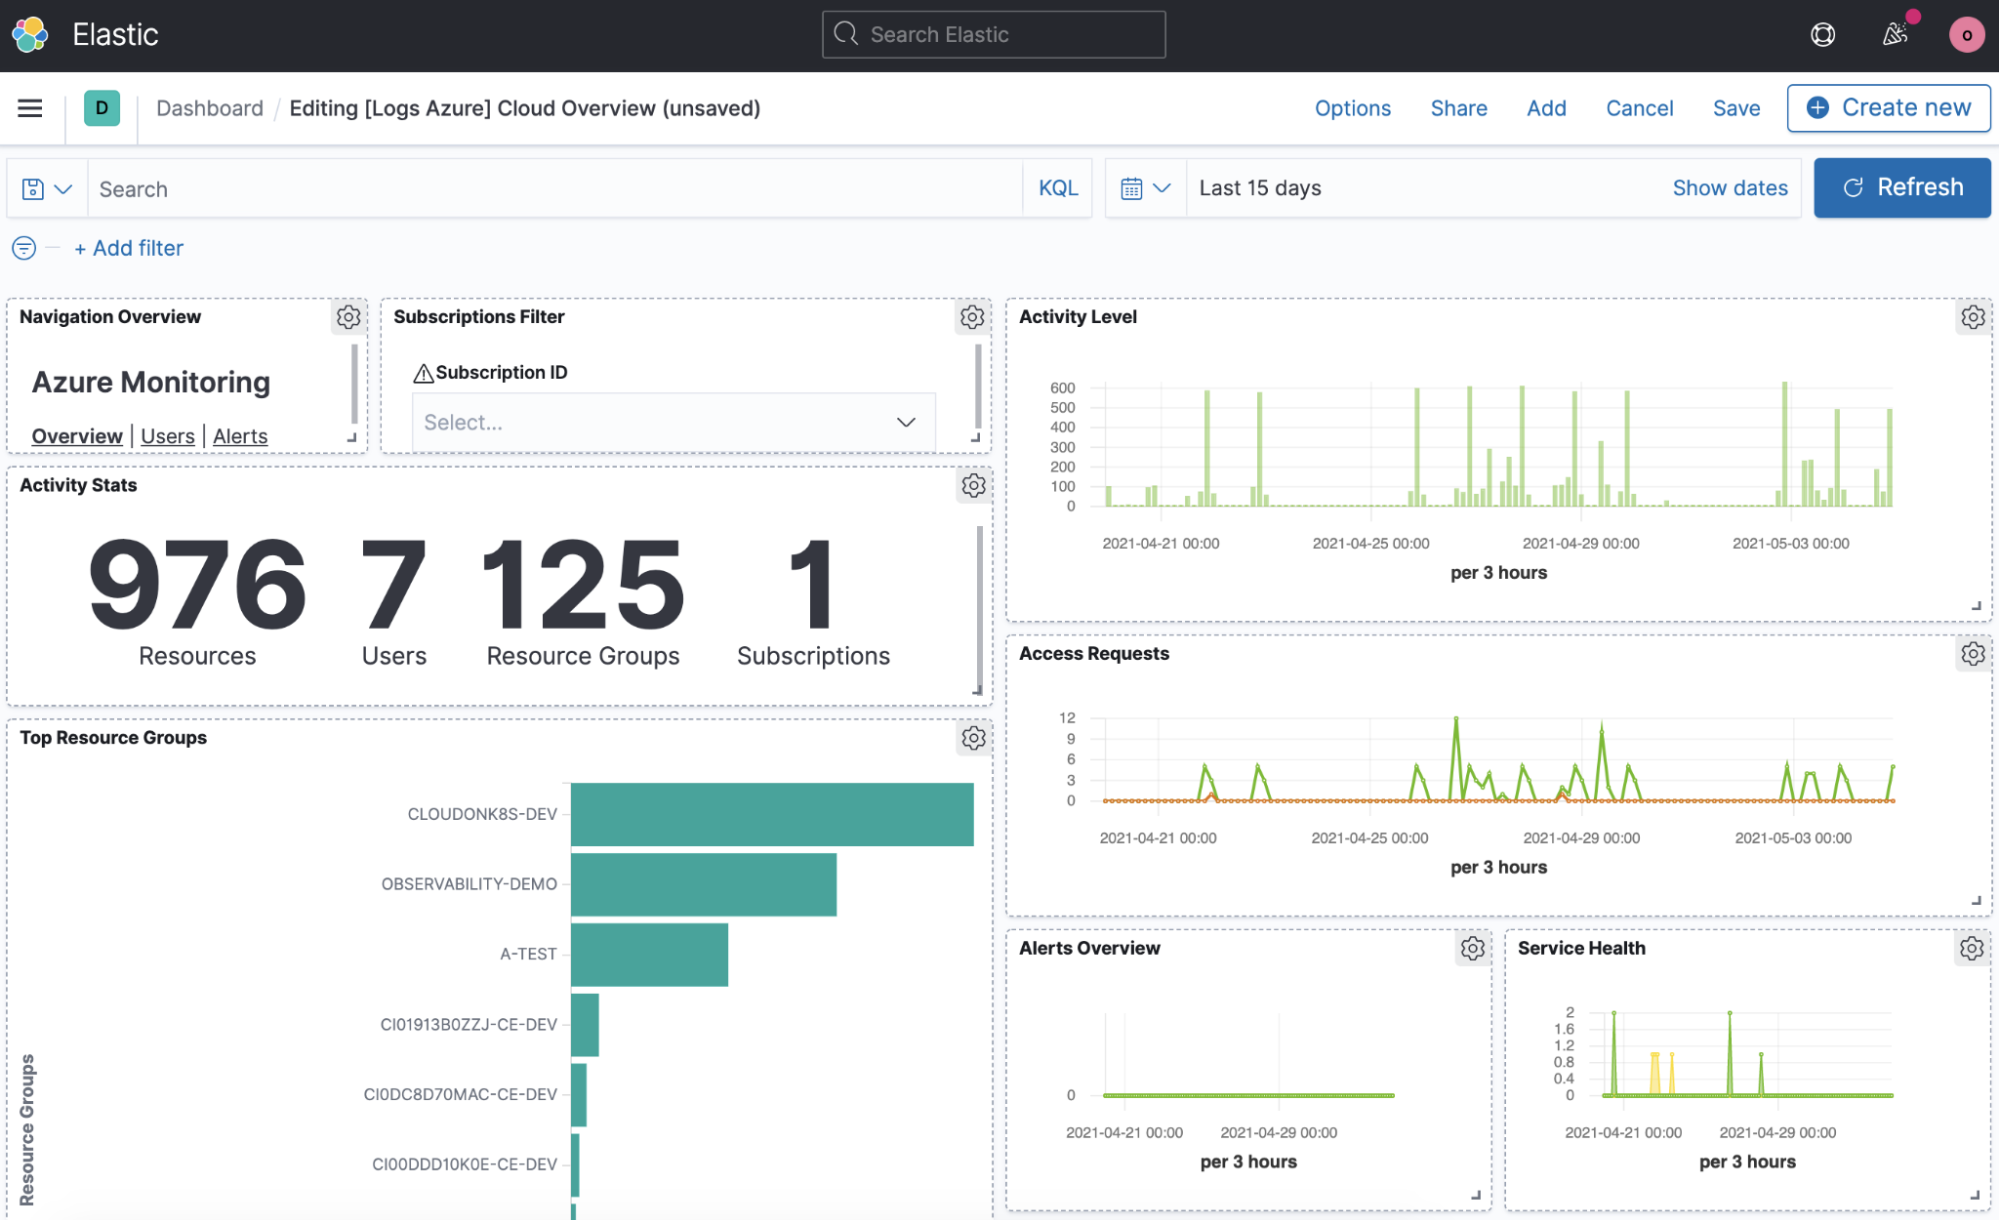
5. To view your log data, log in to Kibana, which you can access from the Elasticsearch overview page in Azure. Once in Kibana, you can view the Discover tab to view the raw log data. The Dashboard tab displays a few out-of-the-box dashboards preconfigured for Azure data.
Note that log collection from this integration is dependent on whether the Azure service is supported and the regions in which the Azure service is deployed. See our documentation for more details.
Virtual machine logs and metrics
The system logs from your virtual machines can easily be sent over to Elastic for deeper analysis. From Elastic you can search, visualize, get alerted, and troubleshoot on your virtual machine data.
To get started:
1. Navigate to the Virtual machines tab for your Elastic resource.
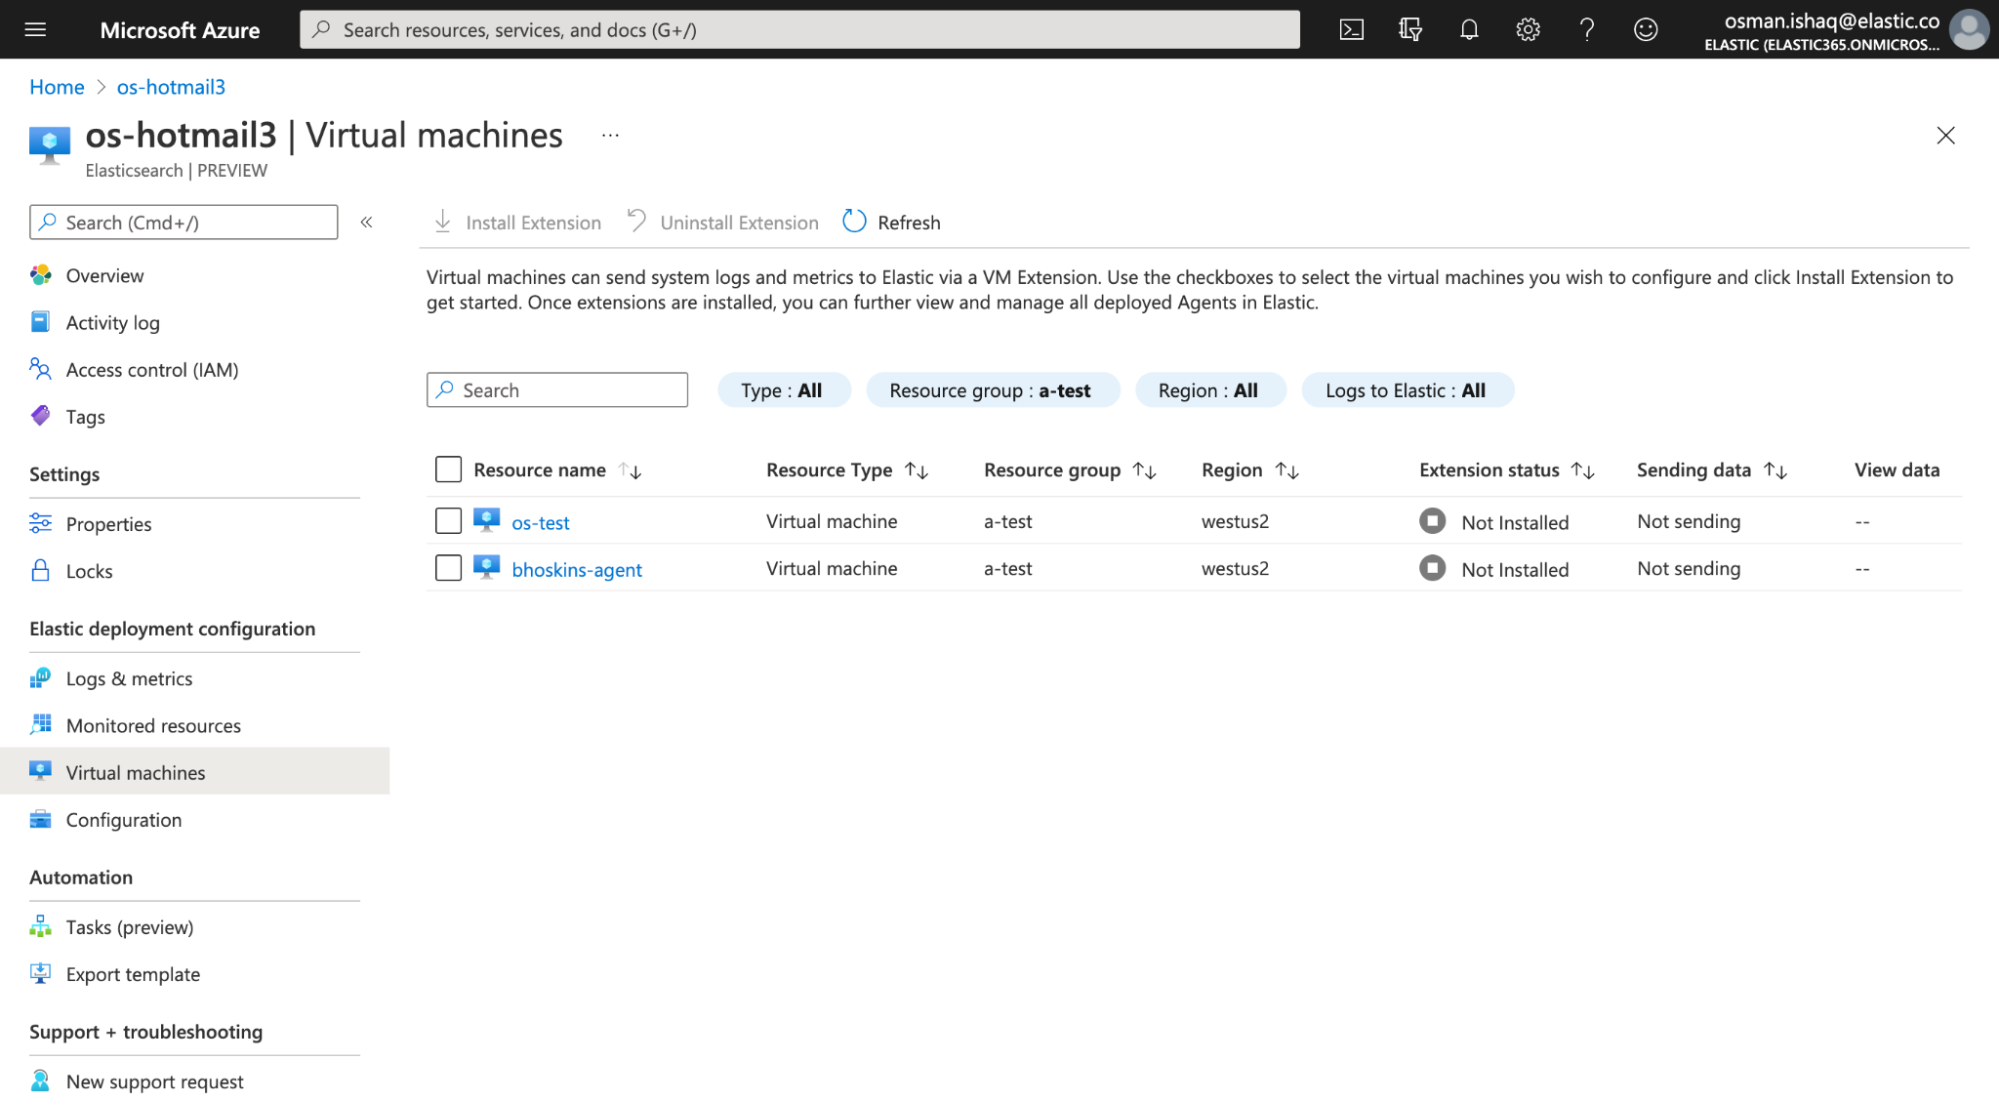
2. Select the virtual machine(s) you want to monitor and click Install Extension. This action will install the Elastic VM Extension on your virtual machine, which will deploy the Elastic Agent to collect system logs and metrics.
3. Once the extension is installed, logs and metrics will start flowing into Elastic. Under the View data column, you can find two quick links that will link you to Elastic so you can view your data:
- Logs: This will link you to the Logs Stream in Elastic so you can view and search your log data.
- Metrics: This will link you to a prefiltered dashboard that provides an overview of the health of your virtual machine.
4. You can further manage Elastic Agents, and the data they collect, directly within Elastic using Fleet.
Now that your platform logs and virtual machine data is in Elastic, explore what Elastic has to offer:
- Ingest additional data in your environment.
- Discover anomalous patterns in your data with anomaly detection.
- Consolidate your logs and metrics data with system traces for application performance monitoring.
- Protect your environment with threat detection and endpoint prevention using Elastic Security.
- Build a highly tailored, customized search experience using Elastic Search.


Share your feedback on Elastic products in UX Labs!
Participate in user research and product feedback sessions with Elastic product teams.
Sign up nowConsolidated billing
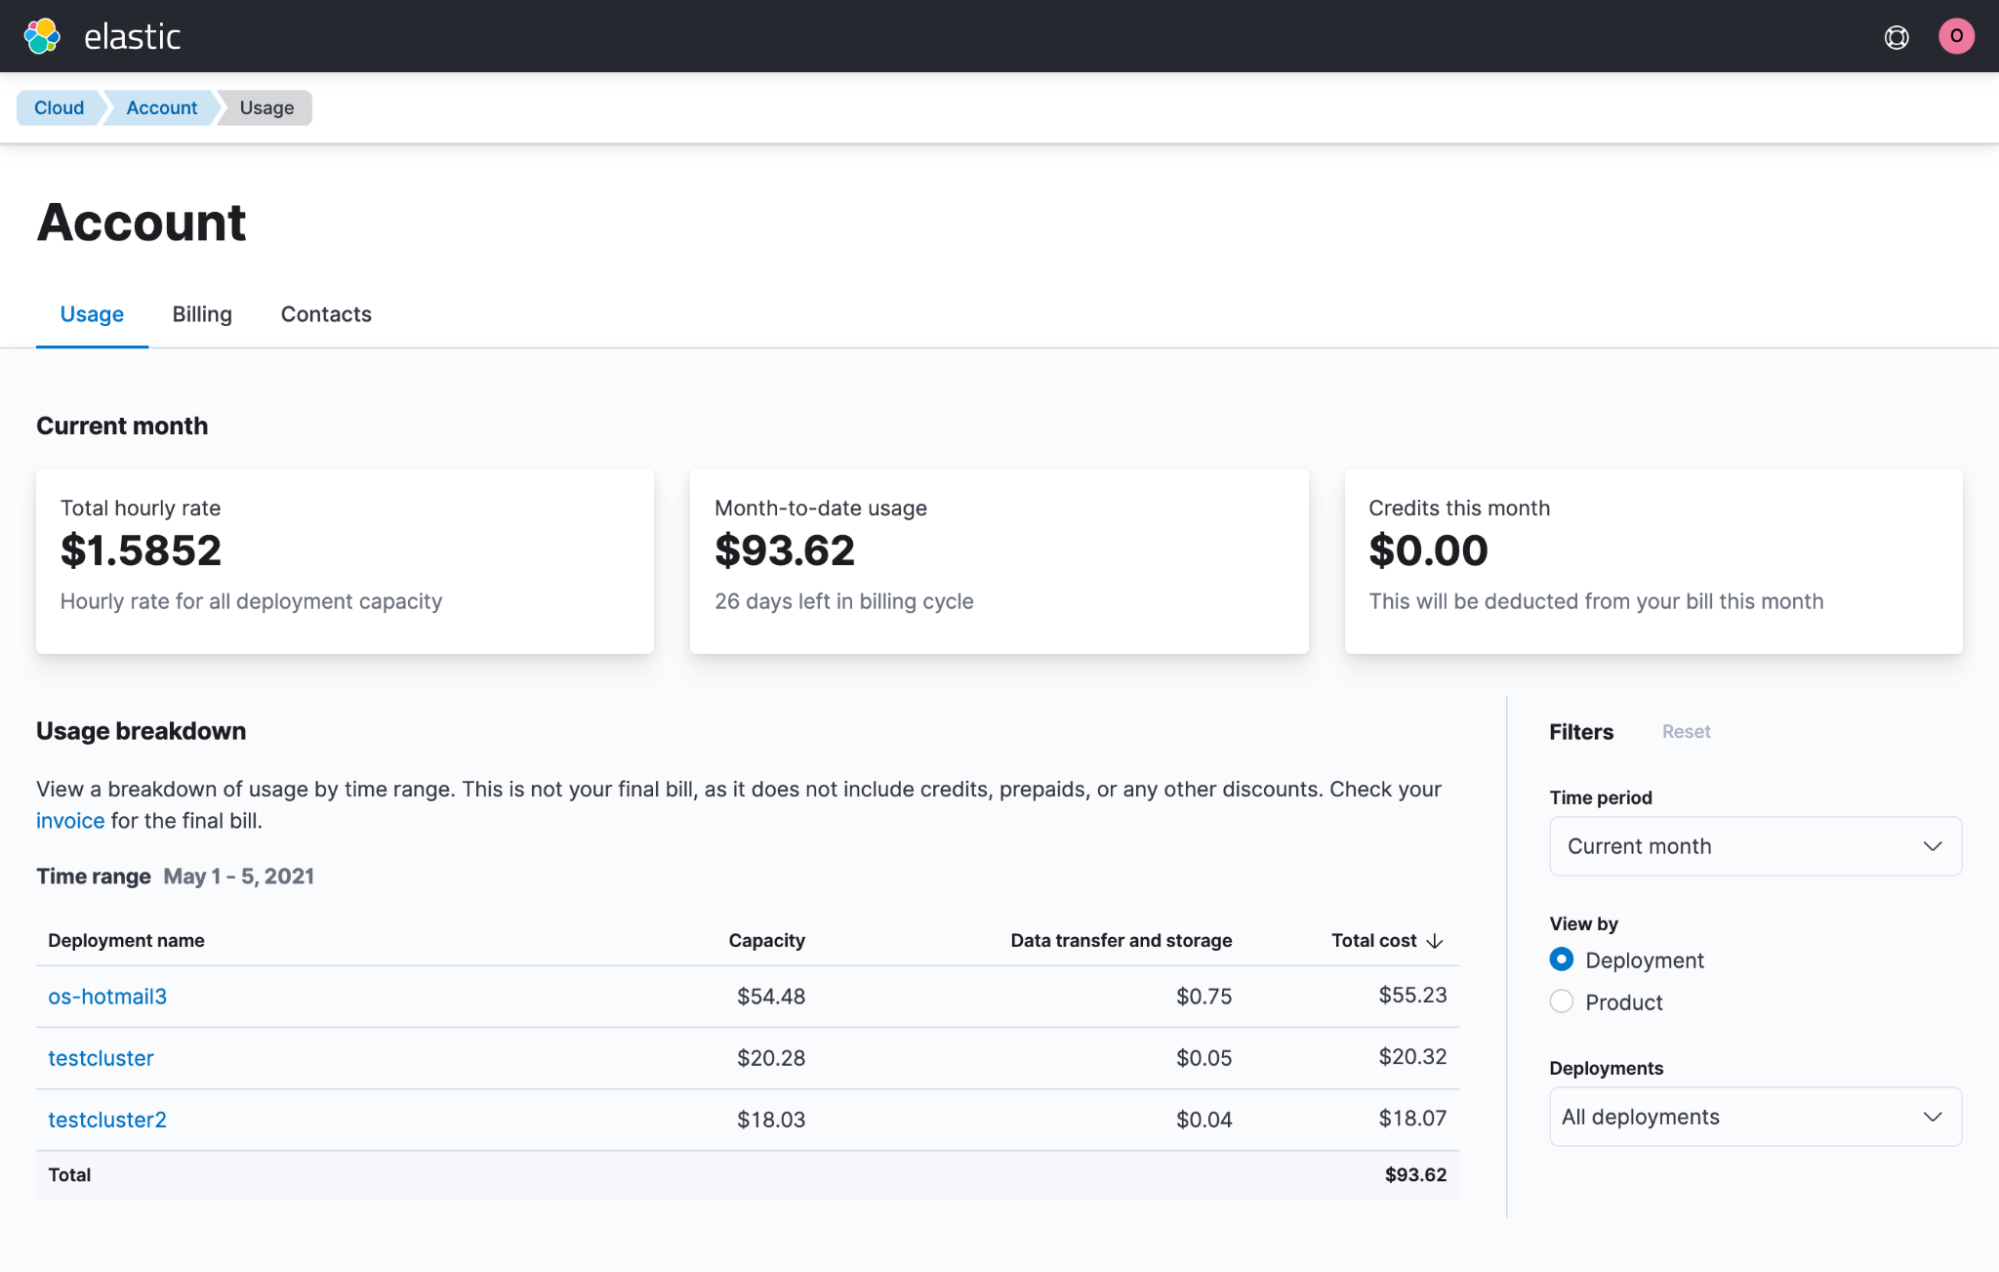
All of your Elastic usage will appear as a line item on your consolidated Microsoft invoice and will accrue toward your Azure spending commitment. You can explore your Elastic usage fees by region and deployment from the Elastic Cost Analysis page.
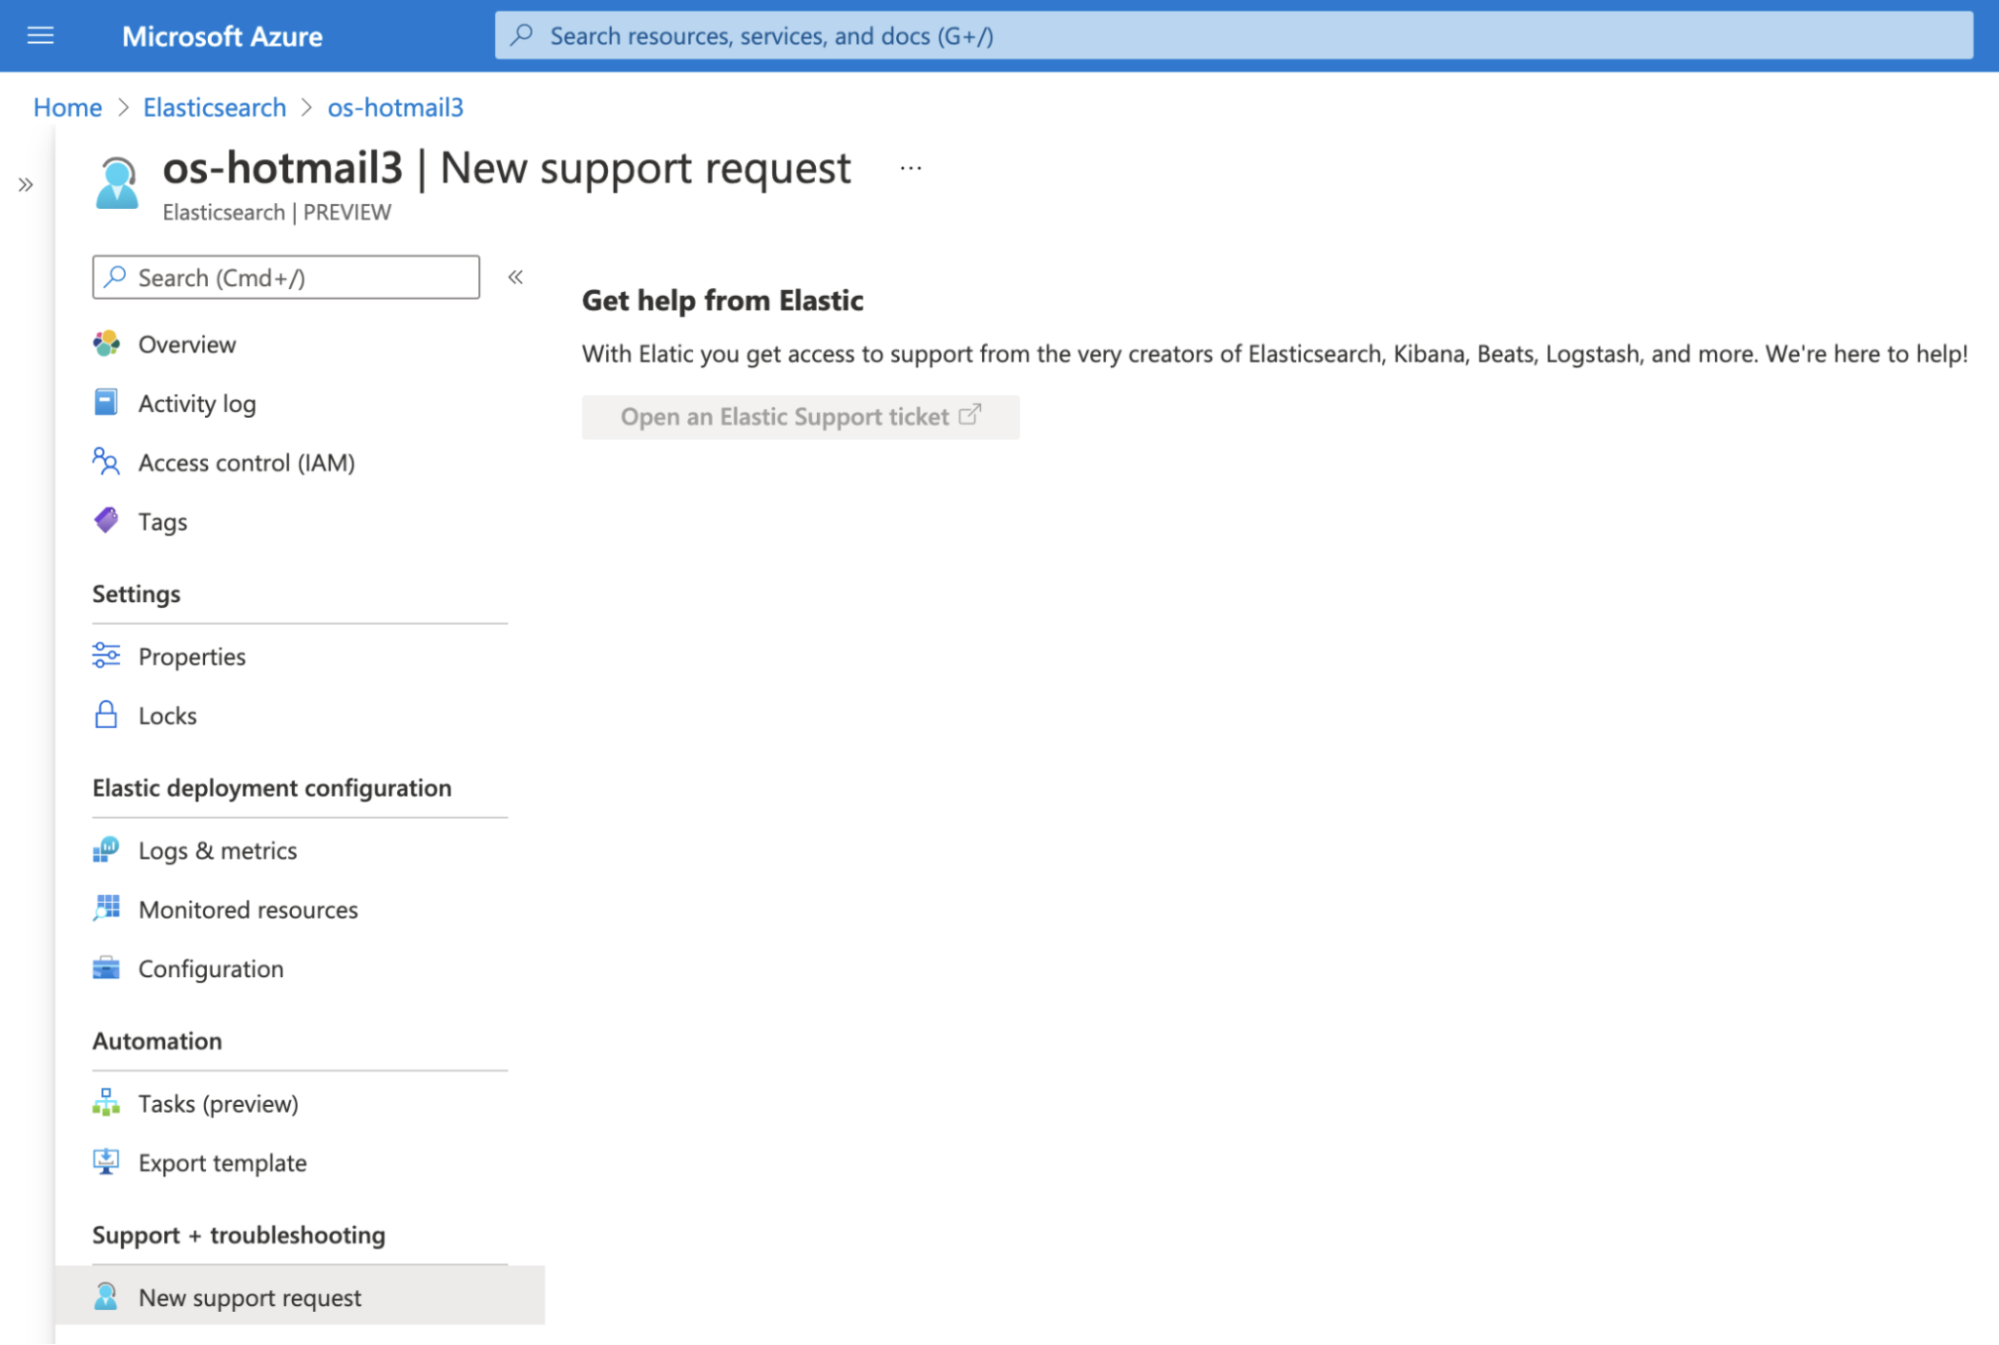
How to get support
Support for this integration is provided by Elastic. We're here to help, and you can reach out to us from the Azure portal by clicking on New support request from the Elasticsearch resource overview. This will bring you to the Elastic Cloud console, where you can create a support case for the Elastic Support team.
Try it out
We ran through how to get started with Elasticsearch on Azure and explored the native logs and metrics monitoring capabilities to give you an overview of this exciting integration. You can dive in by deploying from the Azure portal.
To learn more, check out our documentation. Have questions or feedback? Please reach out to us at azure-co-sell@elastic.co.
Learn how Elastic Observability monitors metrics for Microsoft Azure in just minutes.
Originally published May 25, 2021; updated February 1, 2024.
The release and timing of any features or functionality described in this post remain at Elastic's sole discretion. Any features or functionality not currently available may not be delivered on time or at all.
Share
Share on Twitter
Share on LinkedIn
Share on Facebook
Share by email
Print

