A look under the hood at eBPF: A new way to monitor and secure your platforms

In this post, I want to scratch at the surface of a very interesting technology that Elastic’s Universal Profiler and Security solution both use called eBPF and explain why it is a critically important technology for modern observability.
I’ll talk a little bit about how it works and how it can be used to create powerful monitoring solutions — and dream up ways eBPF could be used in the future for observability use cases.
What is eBPF?
eBPF or Extended Berkeley Packer Filter is a pretty interesting name, but it doesn’t describe the technology in a way that helps users conceptualize what it does. The reason for the name is that the technology’s original purpose was in networking, where it was used for dynamically applying enormously complex firewall rules.
These days, the technology can be used for so many other things, and it has broad applicability across security and observability domains.
At its core, eBPF is a technology that makes it possible to run programs in the operating system’s kernel space without having to change the kernel source code or compile additional modules.
[Related article: Cloud-native observability from customer to kernel]
Why eBPF is so important in observability
I have been in the APM space many years, both as a customer and working for various technology vendors, and the way we have traditionally done instrumentation is pretty invasive. If you aren’t adding instrumentation manually, APM inserts itself into the code and it gets recompiled. This type of deployment can result in all sorts of issues that can bring down production environments.
Now I’m a strong advocate of APM, and the potential for issues is far down the list from the value it can bring, but eBPF can give us a far better way forward. eBPF can provide a method to get the observability data you need with no instrumentation and as a result, far better safety.
When you write BPF code to run in the kernel, it is first compiled to the BPF “bytecode” using Clang, then the bytecode is verified to make sure it's safe to execute. These strict verifications guarantee that the machine code will not intentionally or accidentally compromise the Linux kernel and that the BPF probe will execute a bounded number of instructions every time it is triggered.
The other problem with traditional instrumentation is that it can result in significant overhead due to the frequency with which you need to grab data and then process that data, which generally consumes resources. Because eBPF can run directly inside the kernel, it can be used to apply aggregations to the data and only pass summaries to the user-level resulting in massive reductions in overhead incurred with user-space solutions.
Using BPF Compiler Collection (BCC) to see under the hood
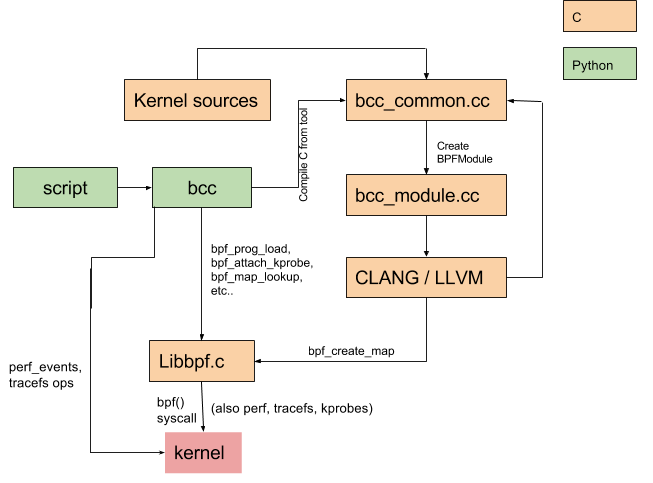
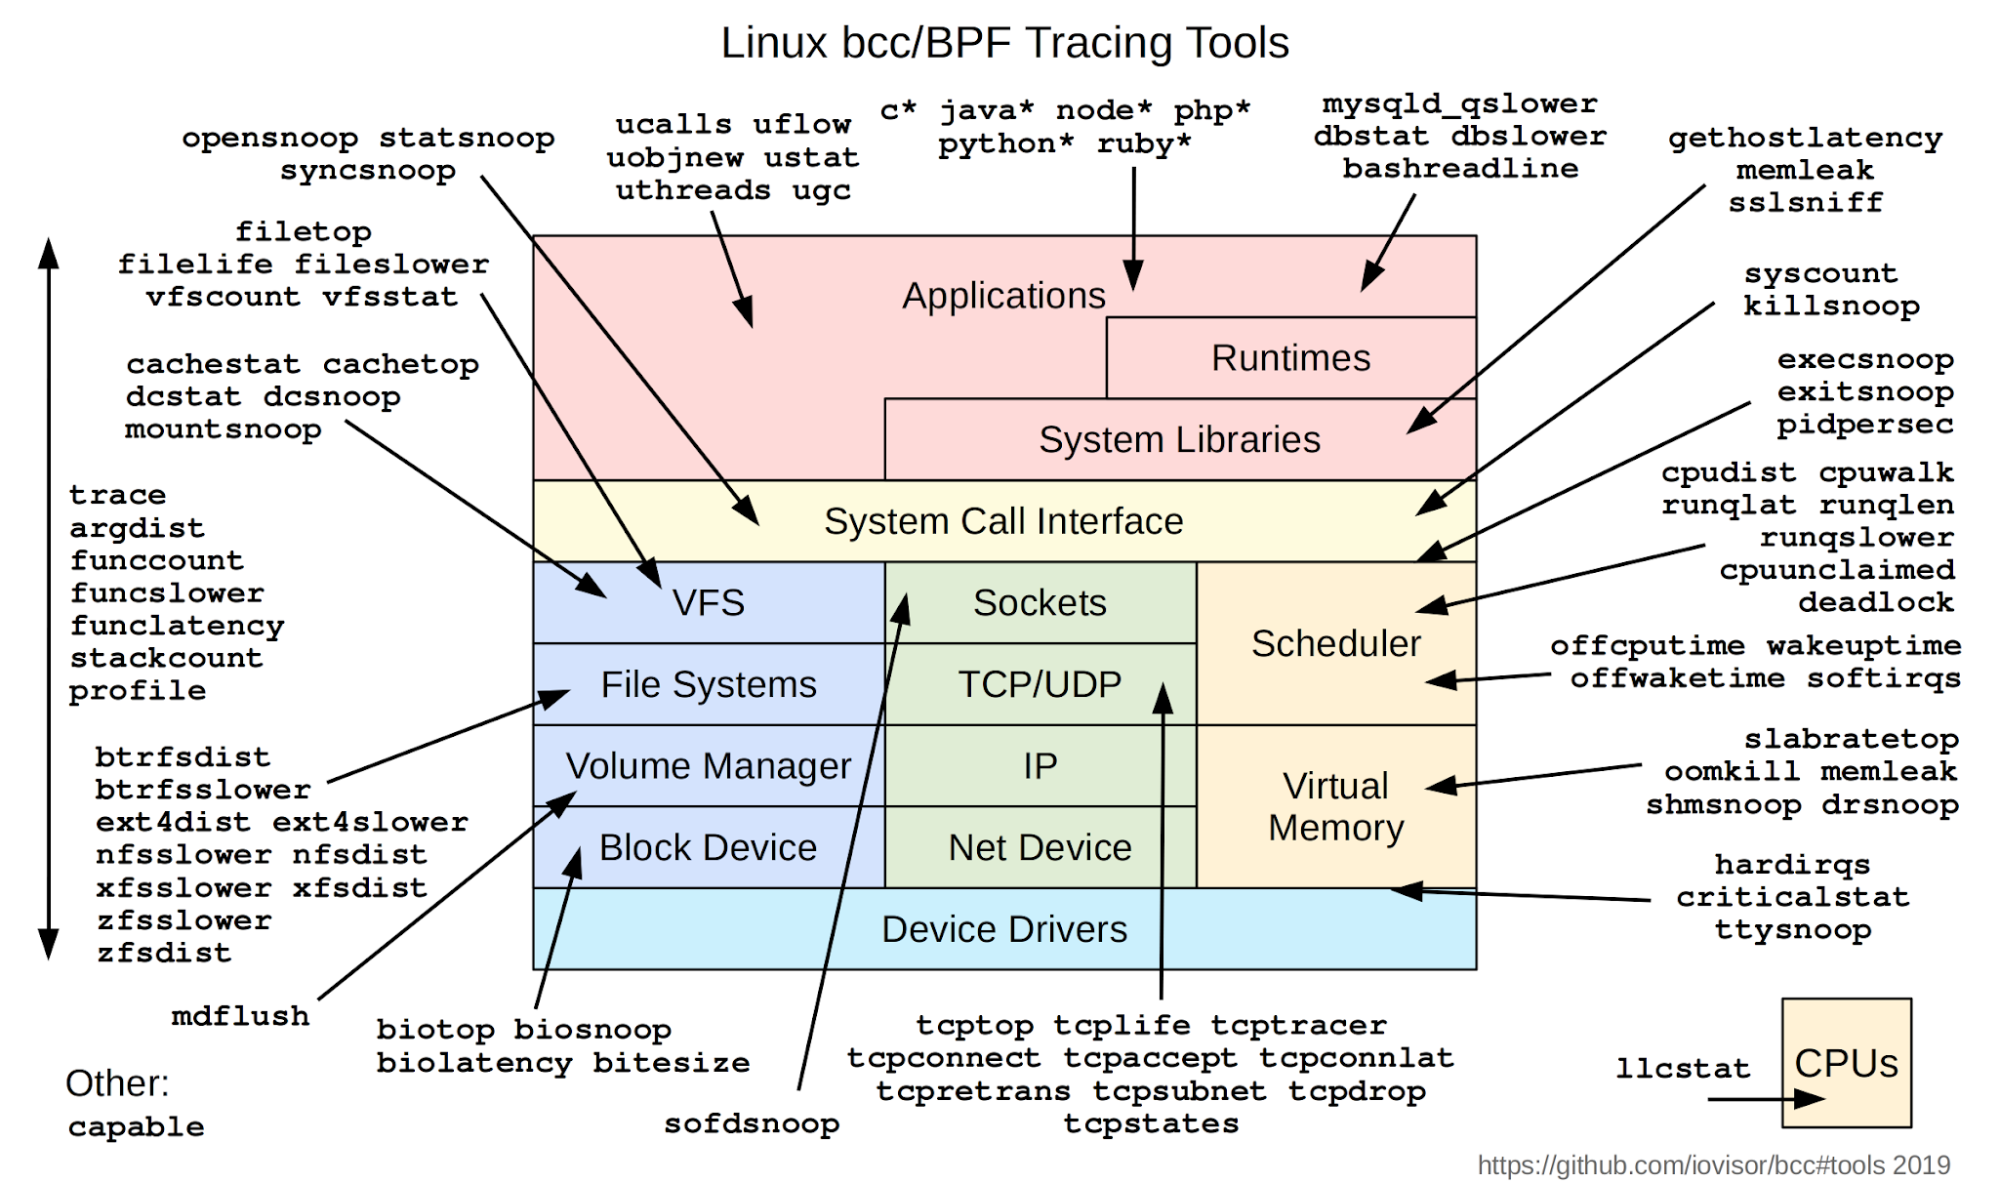
A good place to start our look under the hood is with the BCC tools listed here. What I like about these tools is that they abstract away a lot of the code needed to bootstrap eBPF programs into the kernel and make them easily accessible via Python code, as shown below.

To get started, let's have a look at this — here is the hello world of eBPF:
from bcc import BPF

prog = ‘int kprobe__sys_clone(void *ctx) {
 bpf_trace_printk("Hello, World!\\n");
 return 0;
};’

BPF(text=prog).trace_print()What this program will do is print “hello world!” for each new child process that is created from a terminal because it has a hook for “sys_clone” as mentioned in the man pages.
If you plonk this code into a python file, you should be able to run it (assuming you installed the BCC tools first) and then in another terminal start writing some commands to see “Hello World '' appear each time you launch a process. It really is that simple.
There are four interesting things about this program:
- text='...': This defines a BPF program using simple text. This program is written in C.
- kprobe__sys_clone(): This is a short-cut for kernel dynamic tracing via kprobes. If the C function begins with kprobe__, the rest is treated as a kernel function name to hook into, in this case, sys_clone().
- bpf_trace_printk(): A simple kernel facility for printf() to the common trace_pipe (/sys/kernel/debug/tracing/trace_pipe).
- trace_print(): A bcc routine that reads trace_pipe and prints the output.
Let’s take a look at another example, one which is slightly more useful for observability purposes, tracing http server calls here.
As you can see, there isn’t really a lot to this and it is incredibly powerful. It allows you to essentially intercept Node JS http requests and see the specific parameters being passed into the request method.
It’s worth checking out the other BCC tools (shown below) in that repository to see all the ways to help with nasty problems that you experience, especially the ones that traditional tools have not been able to solve for you, yet. I have no doubt that we will soon see an integration of these tools into our favorite observability solution.

Here is a list of things we at Elastic have been able to tackle with eBPF using the BCC tools:
- Debugging Disk IO latency
- Trace slow xfs file operations
- Summarize XFS operation latency
- Tracing kernel function calls to find an issue with md_flush_request and reduce disk write slowdowns
Where is eBPF technology going?
As you can see, it’s easy for us to get our hooks into the kernel and start to look at things that are happening on our system, from the network and low-level subsystems to the applications running on top.
Now eBPF does have some limitations. It cannot safely modify data — the virtual machine that runs the eBPF code has read-only access to the variables in the code, and this is really important because otherwise this could result in all sorts of unexpected problems. You can’t really add tags or tracing IDs to code dynamically in a practical way with eBPF as you can with APM. Technically it is possible, but it involves patching memory, which is unsafe and potentially has higher overheads. Therefore, APM agents and OpenTelemetry still have a place in the world today until those issues are resolved, given we need to add tracing information, logs, and metric data to our code.
What I think may happen here is that some of the responsibility of traditional APM, the collection part in particular, will move to eBPF based agents. The bit where we read the trace IDs or metrics so that we can generate context and tie all the data together could be shifted over to eBPF-based agents for its performance benefits, speed of summarization, and because it has access to much more of the underlying system.
At the same time, eBPF could be used to gather deeper and more interesting information, networking data, security data, data about kubernetes, and other system services traditionally beyond the reach of APM.
Expect to hear a lot more about eBPF in the future. Large parts of observability solutions like Elastic will increasingly use more of this technology under the covers. Perhaps we might even see eBPF programs embedded with machine learning models to identify the most important data and issues, alerting us to problems much faster than ever before. eBPF has an important future in modern observability and for emerging use cases in the years to come.