Elastic Universal Profiling™, a continuous profiling solution, is now GA
Performance engineering meets sustainability


 Share on Twitter
Share on Twitter

 Share on LinkedIn
Share on LinkedIn

 Share on Facebook
Share on Facebook

 Share by Email
Share by Email

 Print this page
Print
In a world where software is ubiquitous and its impact is profound, the importance of efficiency extends beyond just the boundaries of the business. Efficient software is not only good for businesses; it’s also good for the planet. By making computational efficiency a core objective and empowering professionals with the right tools to achieve it, we're not only driving toward more profitable business outcomes, but also fostering a more responsible and sustainable future.
Driven by our focus on optimizing computational efficiency –– resulting in measurable cost-savings and a reduction in the carbon footprint for our customers –– Elastic Observability charts new frontiers in sustainable software engineering. Today, we're thrilled to announce the general availability of Elastic® Universal Profiling, an observability solution that embodies our commitment to sustainable software development and operations.
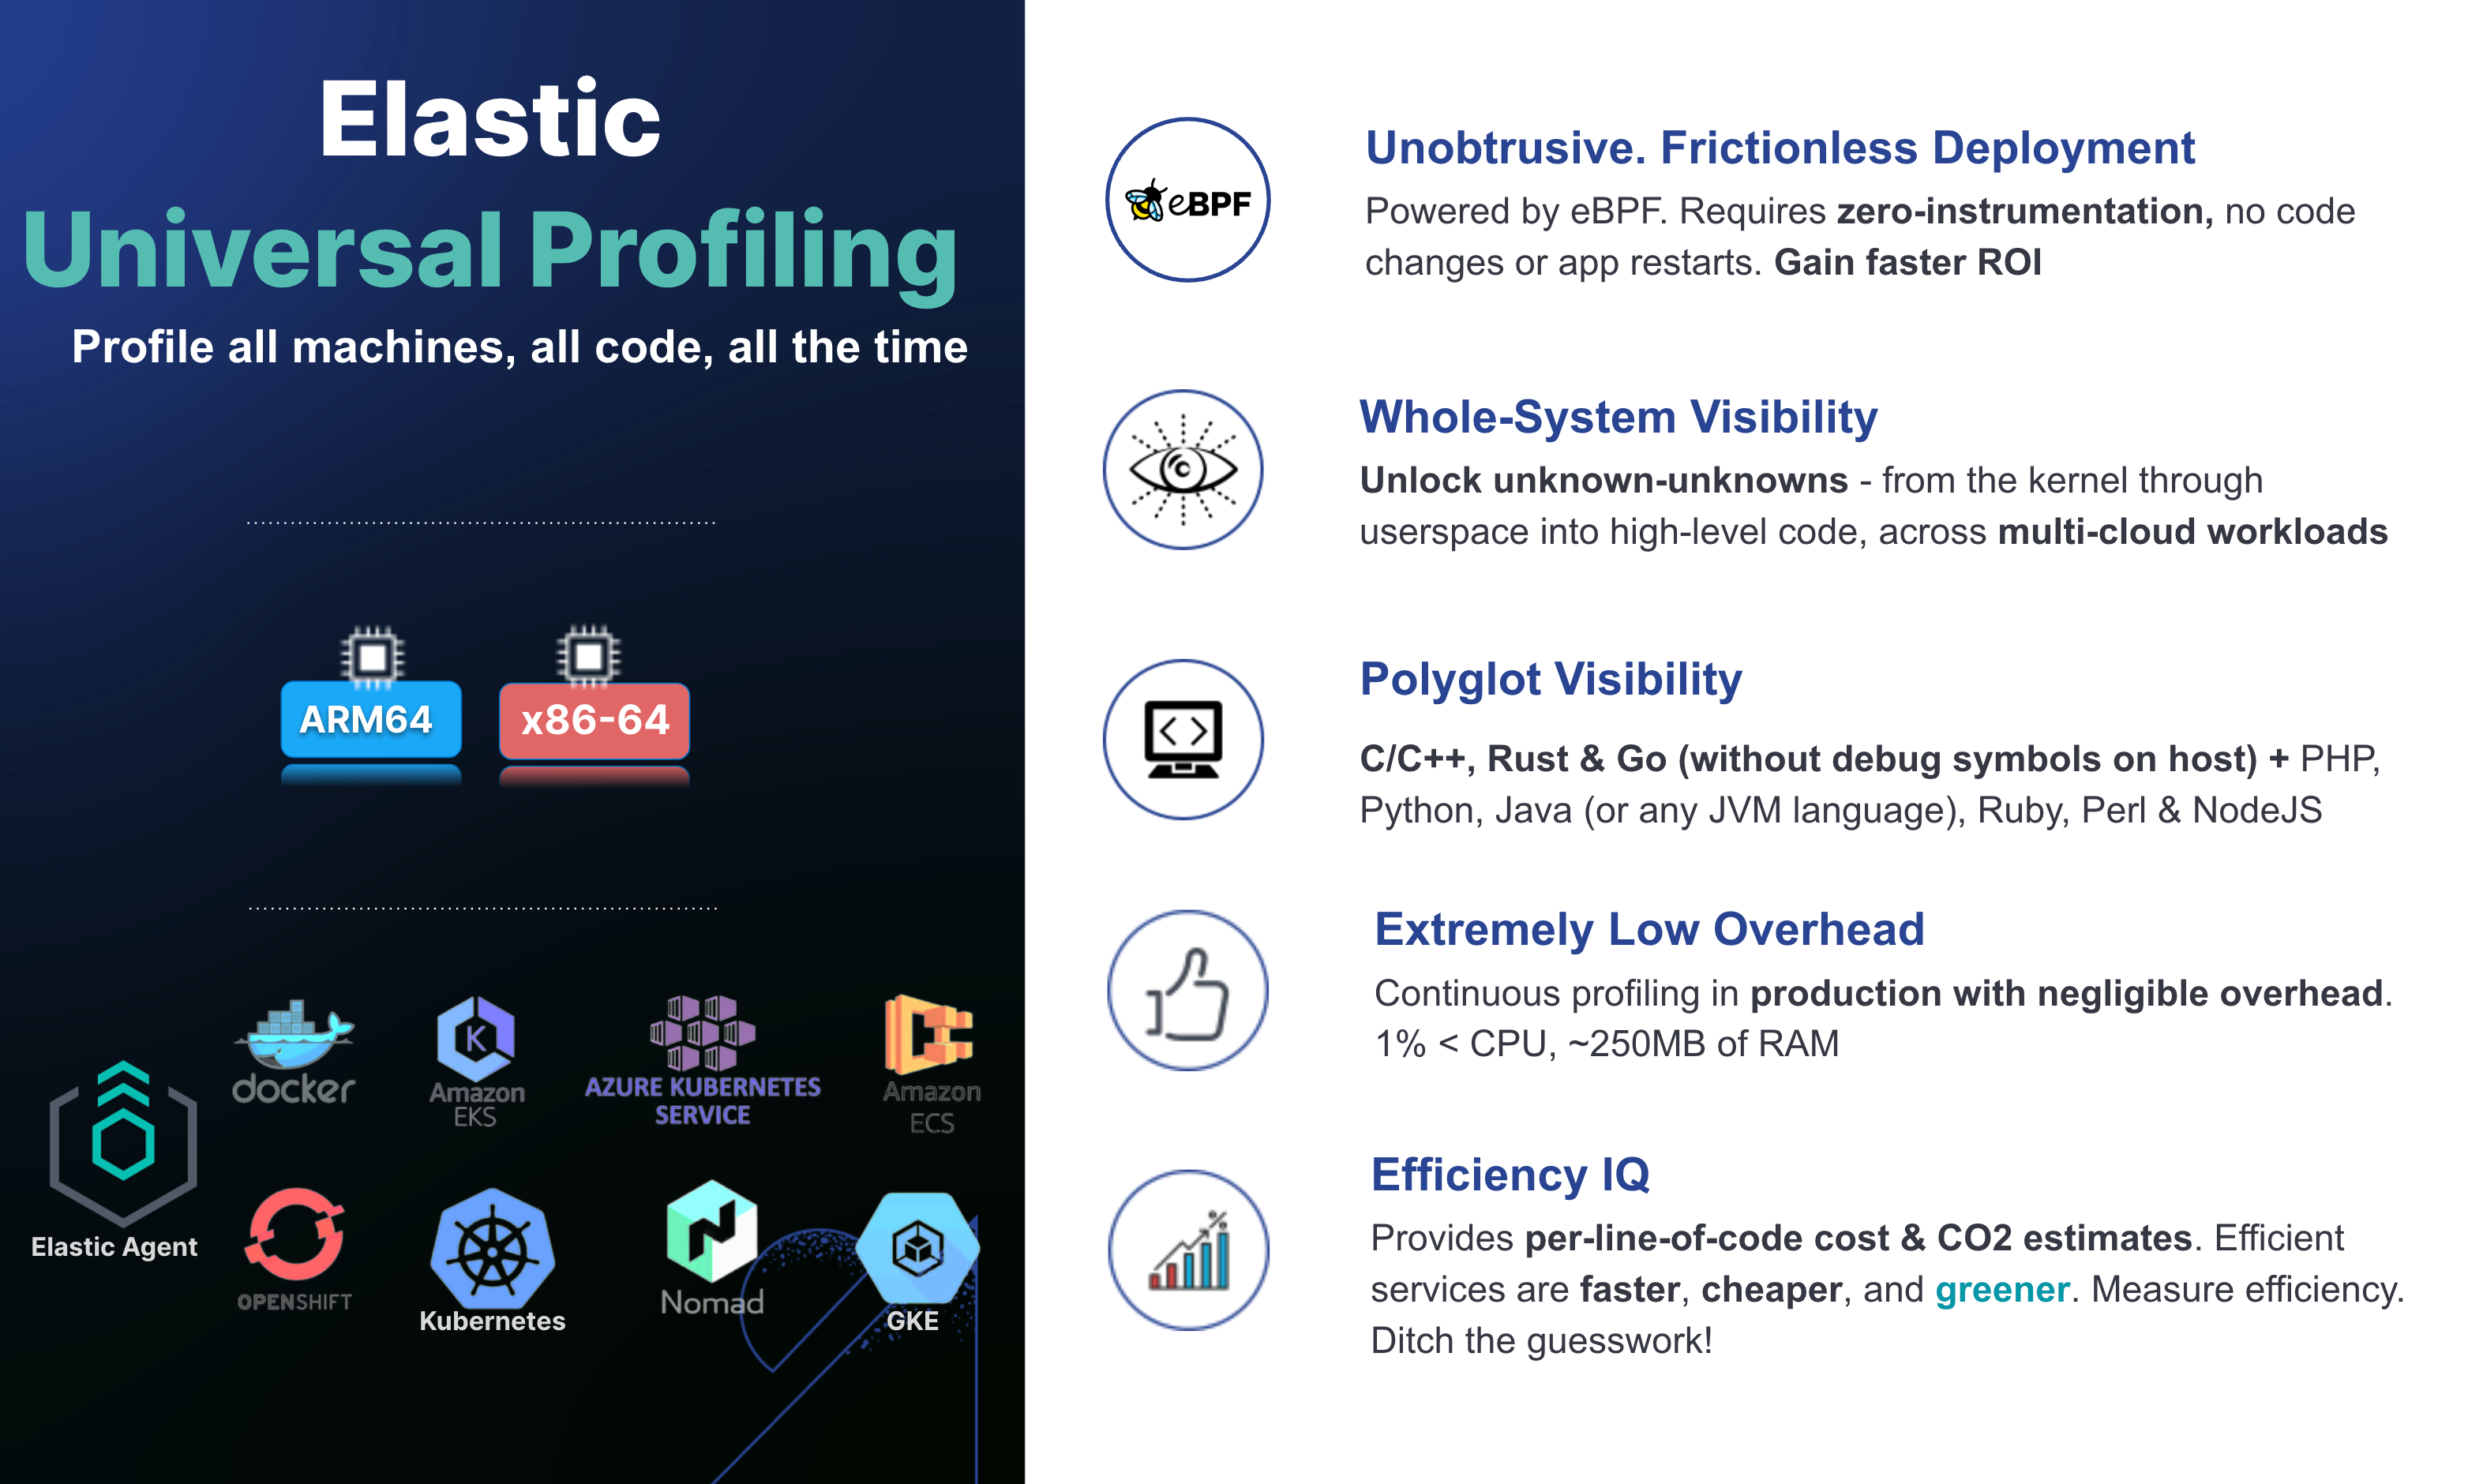
Elastic Universal Profiling is a whole-system, always-on, continuous profiling solution that eliminates the need for code instrumentation, recompilation, on-host debug symbols, or service restarts. Leveraging eBPF, Universal Profiling operates within the Linux kernel space, capturing only the needed data with minimal overhead in an unobtrusive manner. It profiles every line of code running on the machine –– including not only your application code but the kernel and third-party libraries –– thereby providing deep, whole-system code visibility across your entire fleet, so you can eliminate the guesswork.
Further, Elastic Universal Profiling is designed to help organizations run efficient services by minimizing computational wastage. To this end, it measures code efficiency in three dimensions: CPU utilization, CO2, and cloud cost. This approach resonates with the sustainability objectives of our customers –– ensuring that Elastic Universal Profiling aligns seamlessly with their strategic ESG goals.
Certifying software as energy efficient is just as crucial as hardware, but without the tools to measure software efficiency in relation to carbon emission, we're navigating without a compass.
Israel Ogbole, Principal Product Manager, Elastic Observability
The need for energy-efficient software is becoming increasingly significant, mirroring the well-established practice of certifying hardware for energy efficiency. However, the process of certifying software as energy efficient is complicated, as there are no reliable methods to measure how code efficiency relates to carbon emissions. Elastic Universal Profiling is addressing this gap by estimating the CO2 emission associated with every line of code in your entire infrastructure, enabling SREs and developers to engineer greener and more cost-effective software.
What can I do with Elastic Universal Profiling?
Understand which lines of code are consuming CPU resources, at all times, and across your entire infrastructure.
Universal Profiling provides unprecedented visibility into the runtime behavior of all applications: it builds stack traces that go from the kernel, through userspace native code, all the way into code running in higher level runtimes, enabling you to identify performance regressions, reduce wasteful computations, and debug complex issues faster.
Here's what Mike Brancato, principal security engineer at AppOmni, a leading cloud security and management platform, has to say:
Using Elastic Universal Profiling, we were able to very quickly identify the slowest parts of our applications, and target those for improvement. We were able to easily and quickly deploy into production without disruption to existing workloads. Profiling data for our applications and other components was immediately available, without the need to include any libraries or make any modifications to our applications.
Mike Brancato, Principal Security Engineer, AppOmni
We built Universal Profiling with three personas in mind: SREs, developers and FinOps professionals.
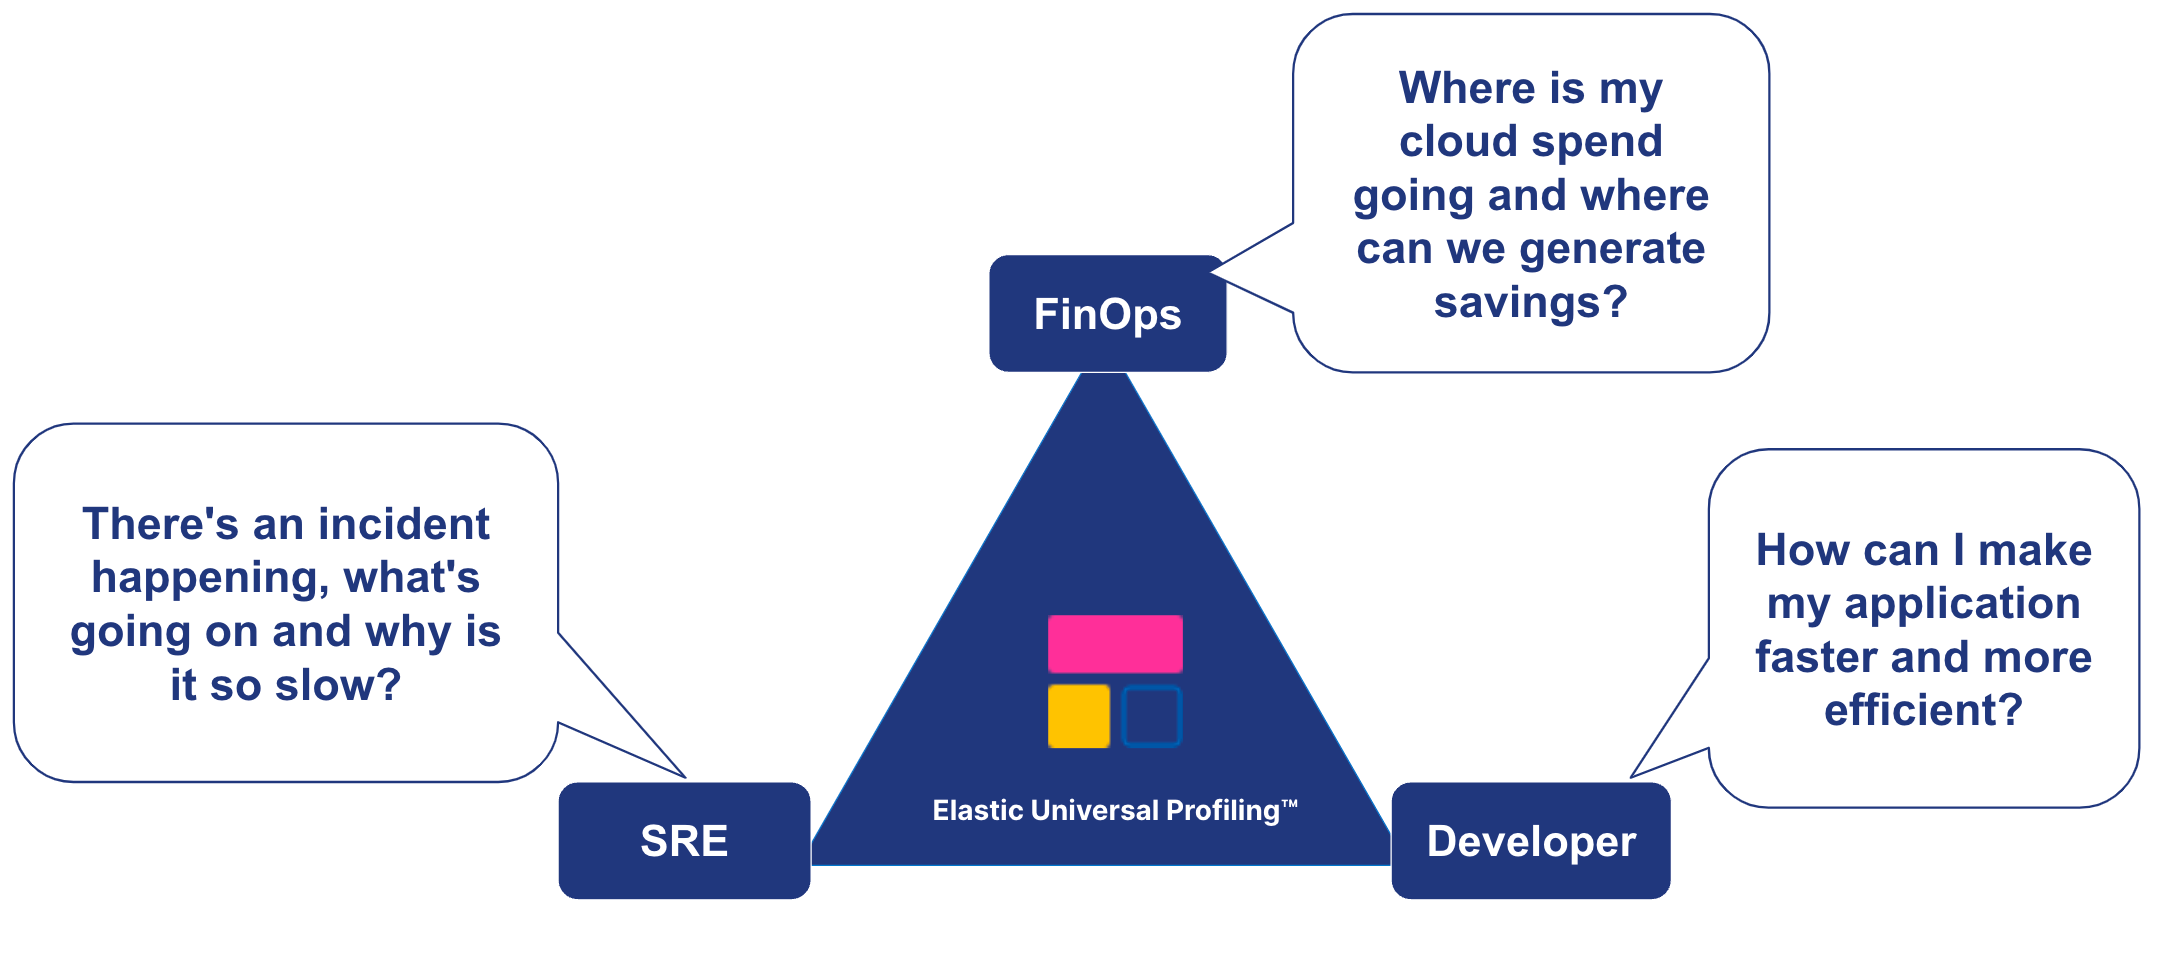
SRE use cases
For SREs, Elastic Universal Profiling provides system-wide performance insights that span across the kernel, run-times, and third-party library codes. With unprecedented breadth and depth of visibility, it unlocks insight into the unknown-unknowns that may be lurking in your system –– allowing for precise and rapid troubleshooting. This deeper level of system-wide visibility empowers SREs to answer essential "why" and "what" questions:
- Why are we spending x% of our CPU budget on function y?
- Why are we experiencing unexpected CPU spikes during off-peak hours?
- What are the resource consumption patterns across different workloads, and how can they be optimized for cost and carbon-emission efficiency?
- What is the most expensive line of code across our entire multi-cloud fleet?
All of this visibility is available to you, the SRE, without relying on developers to instrument or change the code, and with zero recompilations or restarts. Universal Profiling puts the power to diagnose and resolve issues with precision and speed firmly in your hands. Just deploy the agent and receive profiling data (in Kibana®) a few minutes later. Get started now.
[Related article on how profiling complements APM: Why metrics, logs, and traces aren’t enough]
Developer use-cases
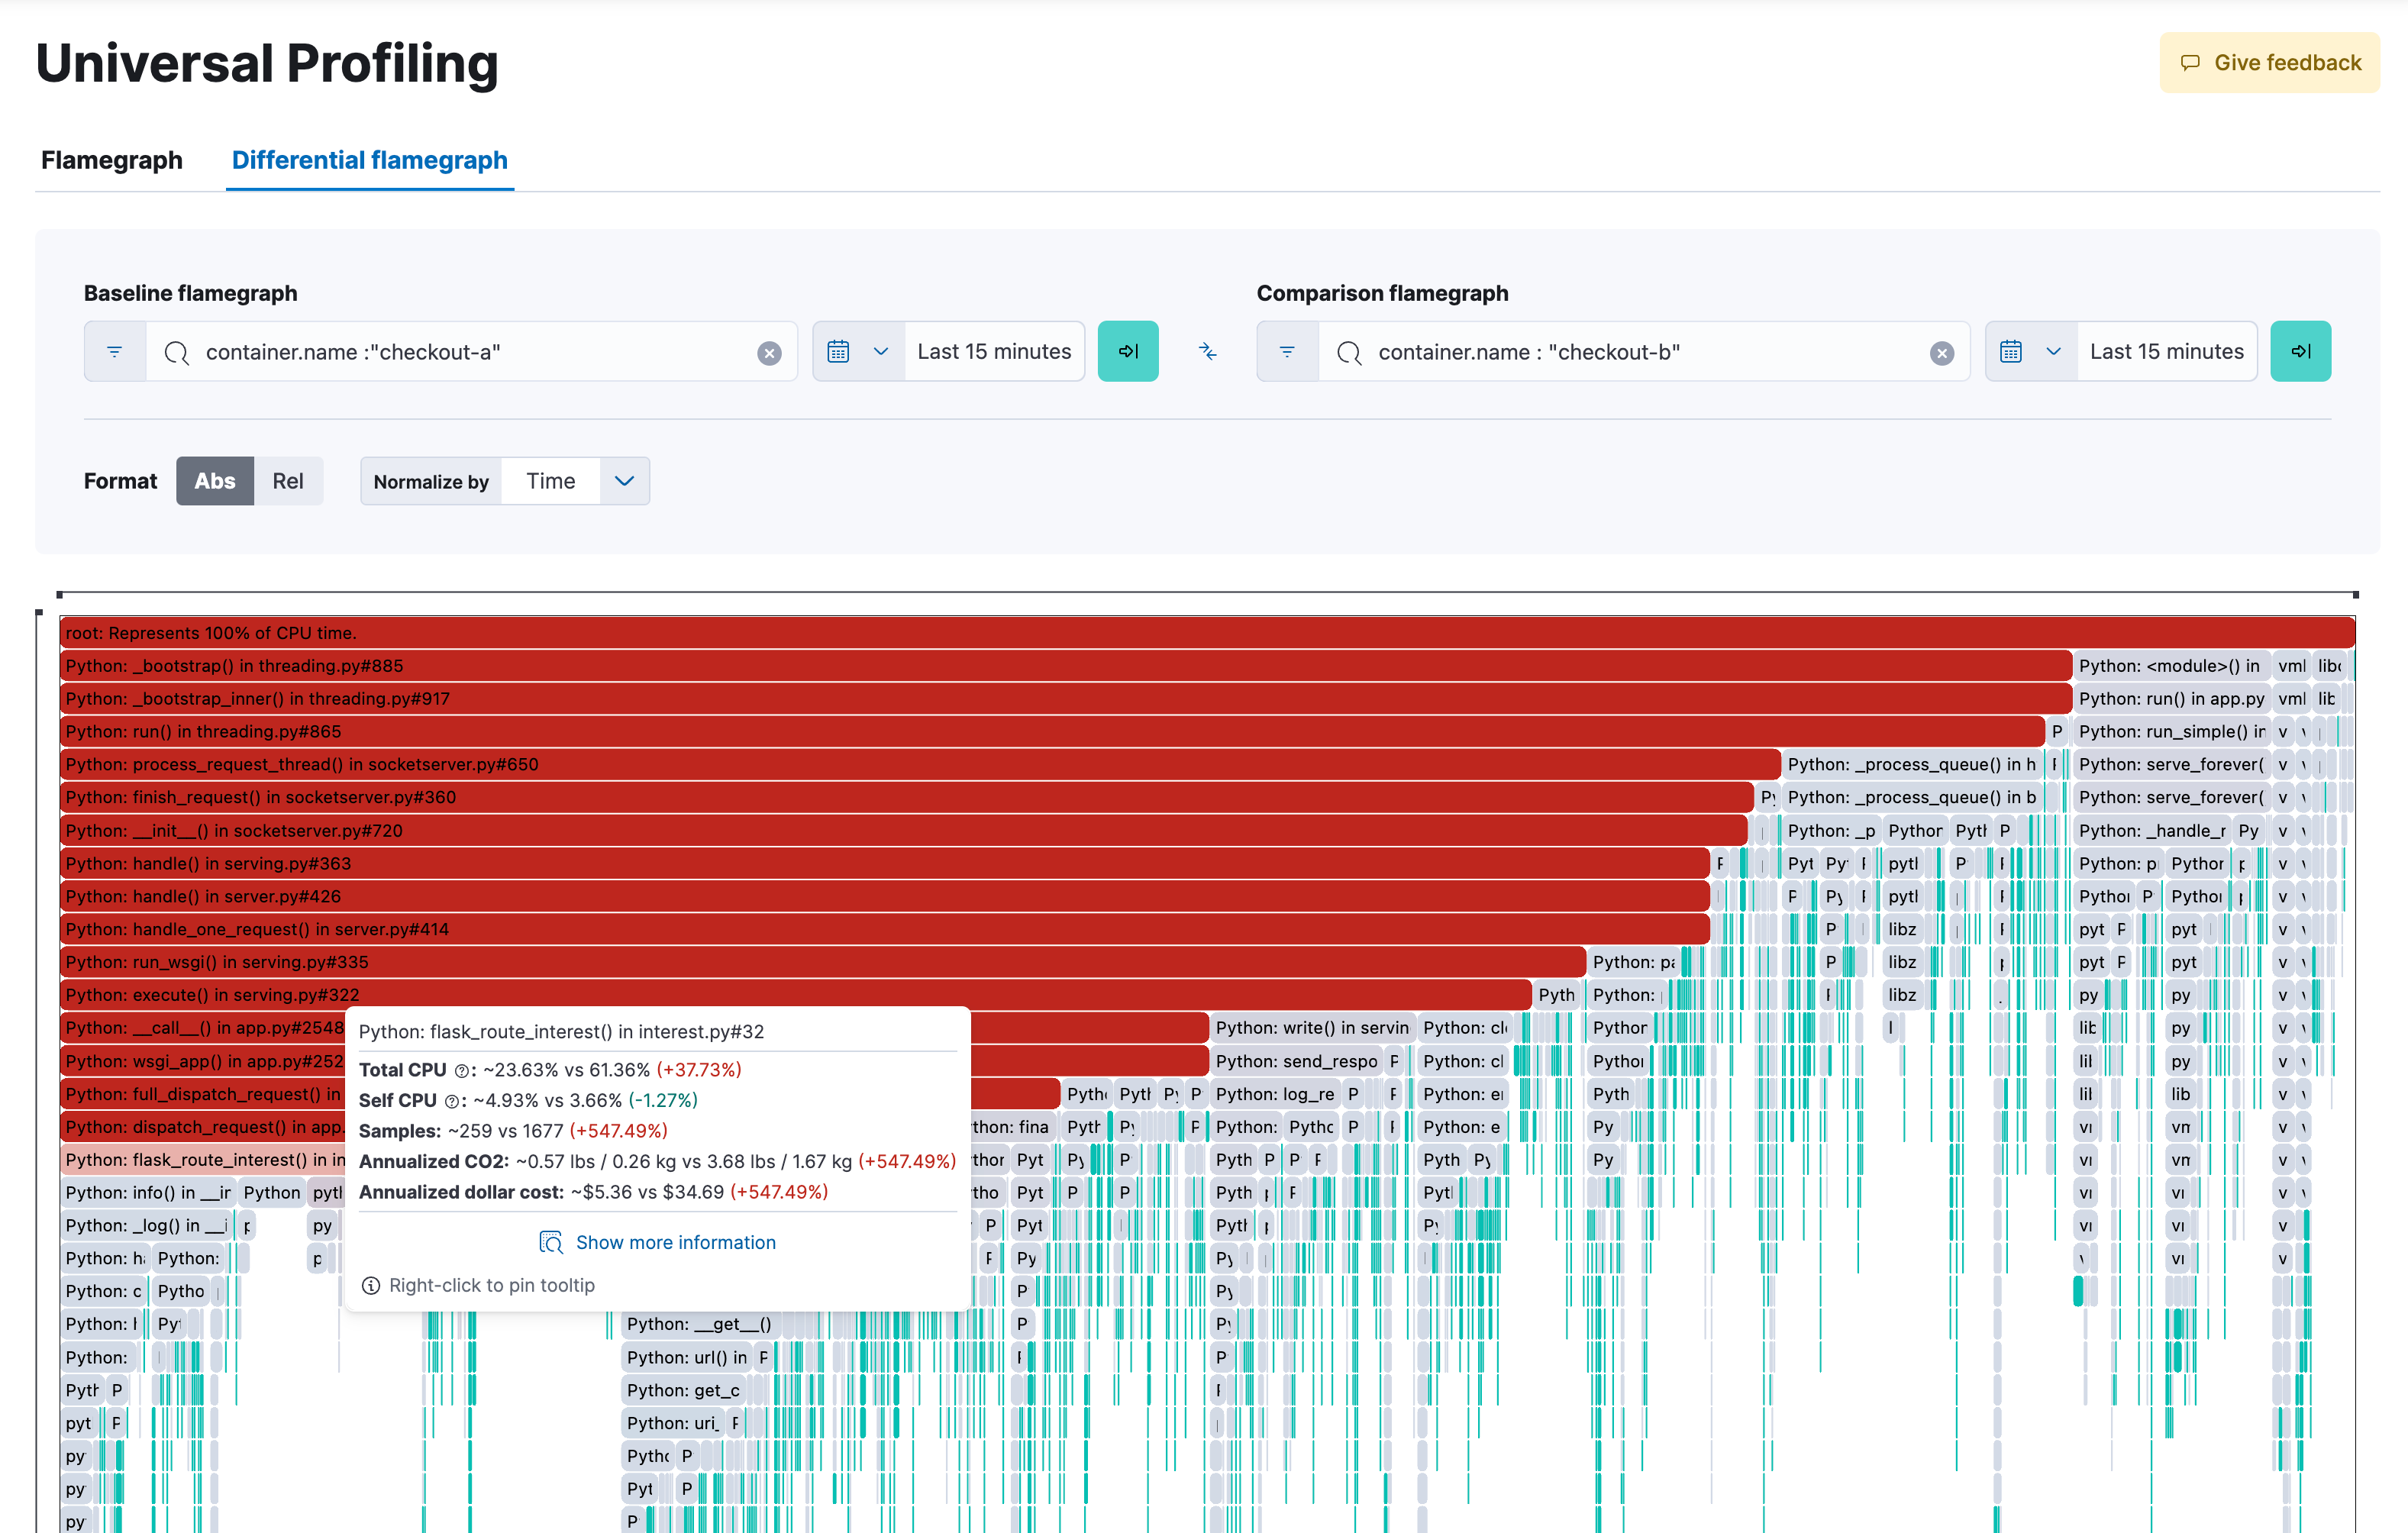
For the very first time in history, developers can now measure the performance (gained or lost), cloud cost, and carbon footprint impact of every deployed change.
Elastic Universal Profiling provides powerful insights for performance optimization, catching regressions, validating releases, and contributing to cloud cost and CO2 emission savings. With insights that identify issues with data structures, memory allocation, and code execution at both kernel and userspace levels, developers are equipped to catch even the most elusive issues. This code-level visibility empowers developers to answer pivotal "what" and "why" questions, such as:
- Why is a recent code change causing a slowdown in a particular method?
- What unexpected regressions are introduced with the latest release, and how can they be promptly addressed?
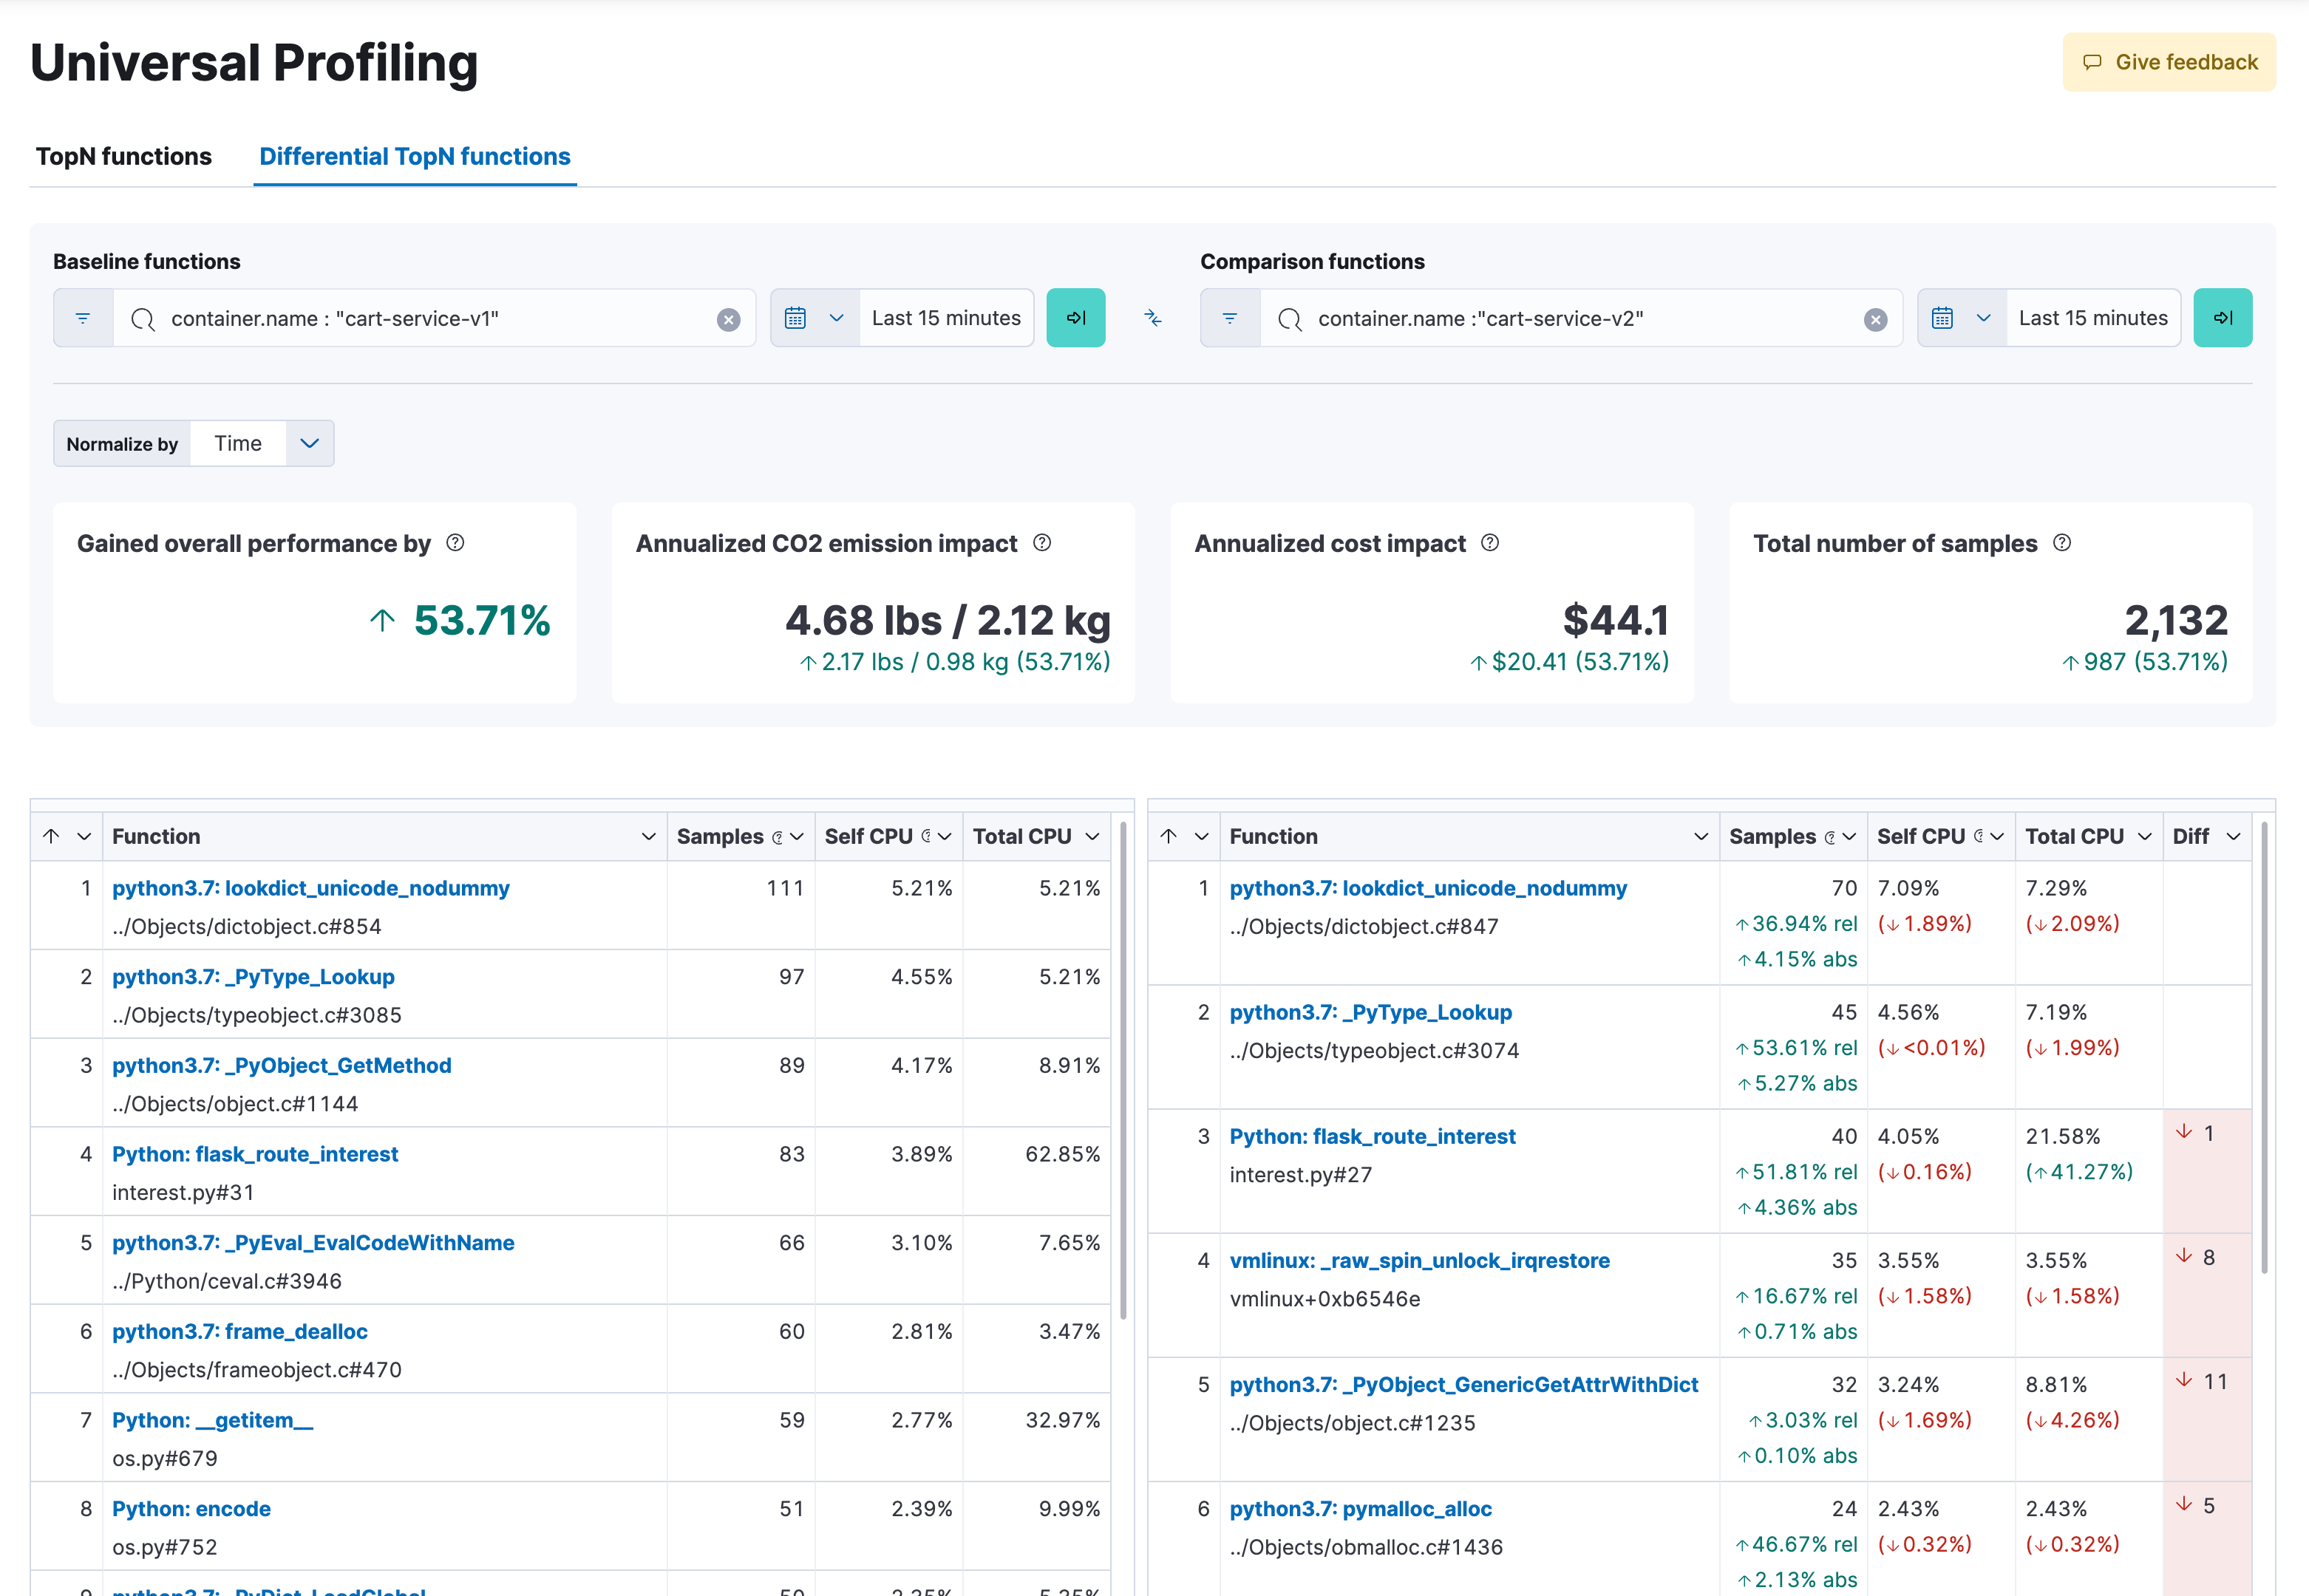
- How does the new version compare to previous ones in terms of CPU consumption, cloud cost, and CO2 footprint?
- How can third-party library functions be fine-tuned to meet performance criteria while aligning with sustainability goals?
With Elastic Universal Profiling, developers can focus on innovating, optimizing, and delivering efficient applications that meet performance, business, and environmental sustainability objectives.
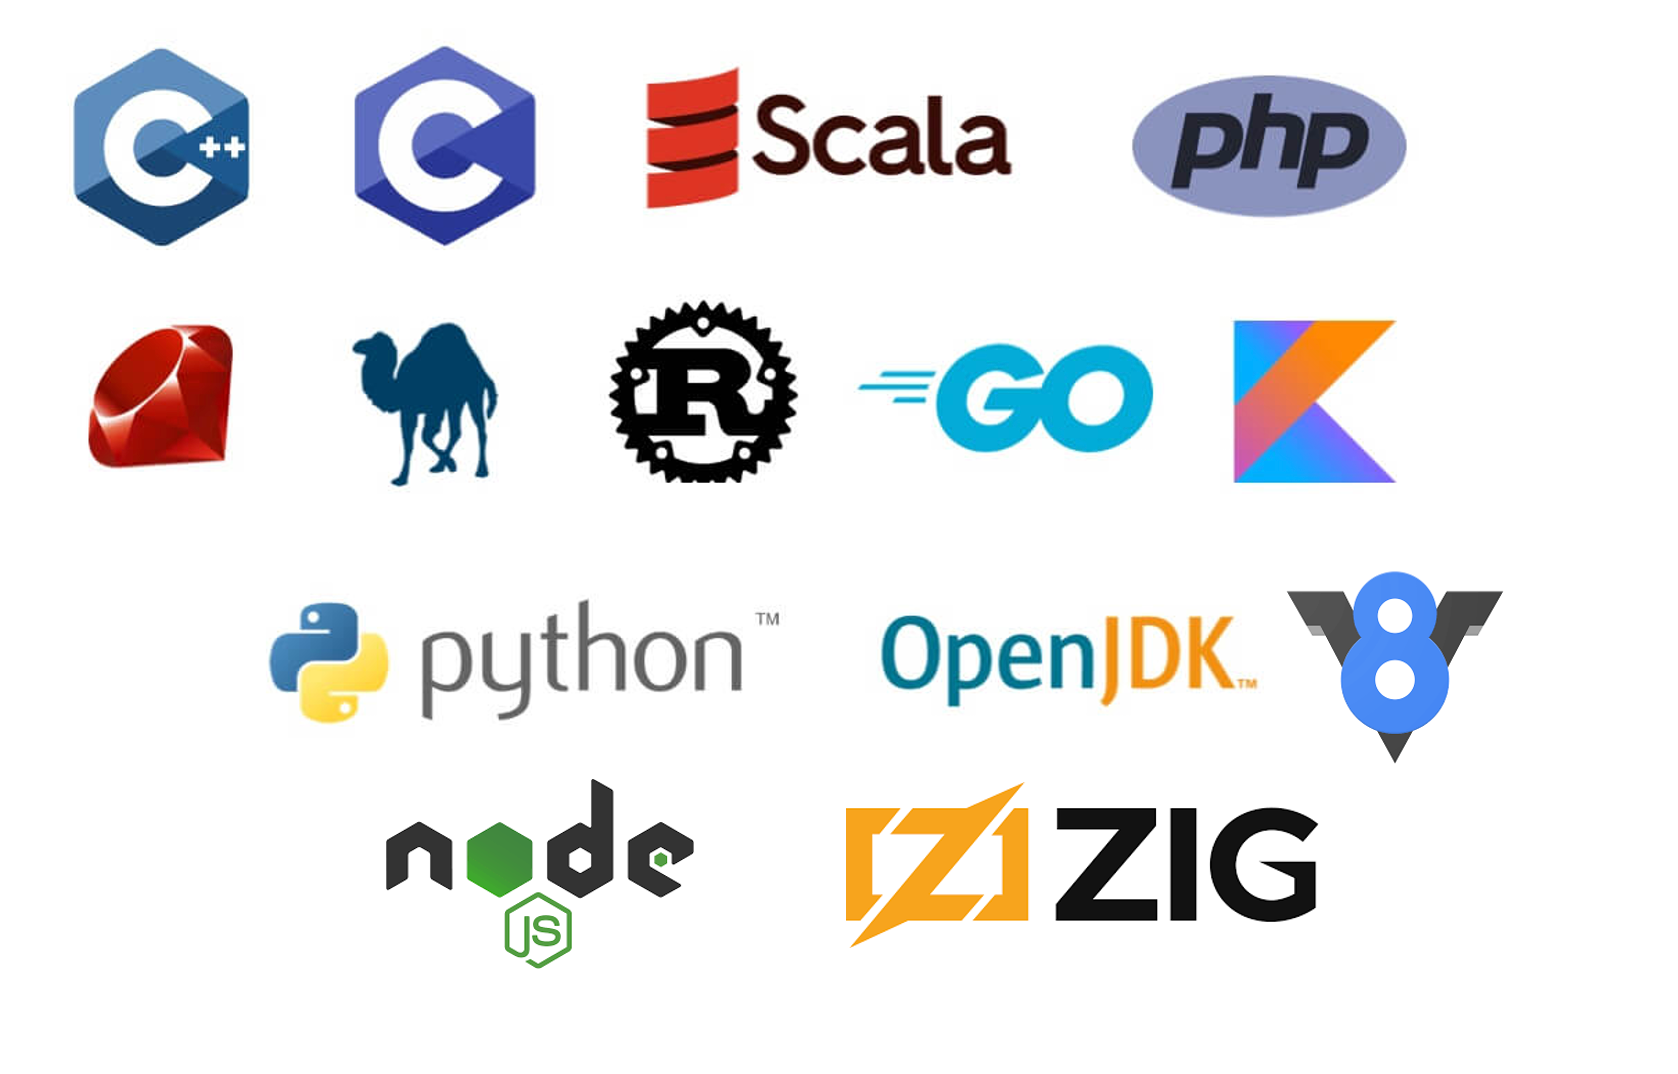
Universal Profiling supports PHP, Python, Java (or any JVM language), Go, Rust, C/C++, Zig, Node.js/V8, Ruby, and Perl.
FinOps use cases
Imagine that you know which parts of your code are responsible for compute costs, and that you can easily build a unit cost metric to guide engineers on where to focus their efforts to improve margins and reduce CO2 footprint.
Thomas Dullien, Distinguished Engineer, Elastic Observability
Elastic Universal Profiling equips FinOps professionals with the insights needed to manage costs strategically, aligning financial decisions with both performance demands and sustainability goals, allowing them to answer critical questions such as:
- How can we reduce cloud costs without compromising on performance?
- What are the trends in resource utilization, and how can they be aligned with our sustainability targets?
- Where are the opportunities for driving efficiencies that have both economic and environmental benefits?

To sum it up, just as car manufacturers monitor the cost of every component on their assembly line, Elastic Universal Profiling offers deeper insight into the unit economics of your software assembly line.
Discover how each line of code, including those you don't own, influences your cost of goods sold (COGS) with Elastic Universal Profiling.
More efficient software with Universal Profiling
Computational efficiency has always been a critical concern for software professionals, but in an era where every line of code affects both the bottom line and the environment, there’s a new reason to pay attention to it. Improving software efficiency leads to better performance, lower resource consumption, lower cost, and lower emissions. Efficient software is not only good for businesses; it’s also good for the planet.
Elastic Universal Profiling champions this very principle, providing unprecedented insights into your entire fleet. By weaving computational efficiency, cost insight, and environmental sustainability into the fabric of software development, it caters to the needs of SREs, developers, and FinOps professionals.
Join us in this exciting journey toward sustainable software development. Get started now.
The release and timing of any features or functionality described in this post remain at Elastic's sole discretion. Any features or functionality not currently available may not be delivered on time or at all.
Share
- Share on Twitter
Share on Twitter
- Share on LinkedIn
Share on LinkedIn
- Share on Facebook
Share on Facebook
- Share by Email
Share by Email
- Print this page
Print