A cookbook for contributing a plugin to the Elastic APM Java agent
Ideally, an APM agent would automatically instrument and trace any framework and library known to exist. In reality, what APM agents support reflect a combination of capacity and prioritization. Our list of supported technologies and frameworks is constantly growing according to prioritization based on our valued users' input. Still, if you are using Elastic APM Java agent and miss something not supported out of the box, there are several ways you can get it traced.
For example, you can use our public API to trace your own code, and our awesome custom-method-tracing configuration for basic monitoring of specific methods in third-party libraries. However, if you want to get extended visibility to specific data from third party code, you may need to do a bit more. Fortunately, our agent is open source, so you can do everything we can do. And while you’re at it, why not share it with the community? A big advantage of that is getting wider feedback and have you code running on additional environments.
We will gratefully welcome any contribution that extends our capabilities, as long as it meets several standards we must enforce, just as our users expect of us. For example check out this PR for supporting OkHttp client calls or this extension to our JAX-RS support. So, before hitting the keyboard and start coding, here are some things to keep in mind when contributing to our code base, presented alongside a test case that will assist with this plugin implementation guide.
Test case: Instrumenting Elasticsearch Java REST client
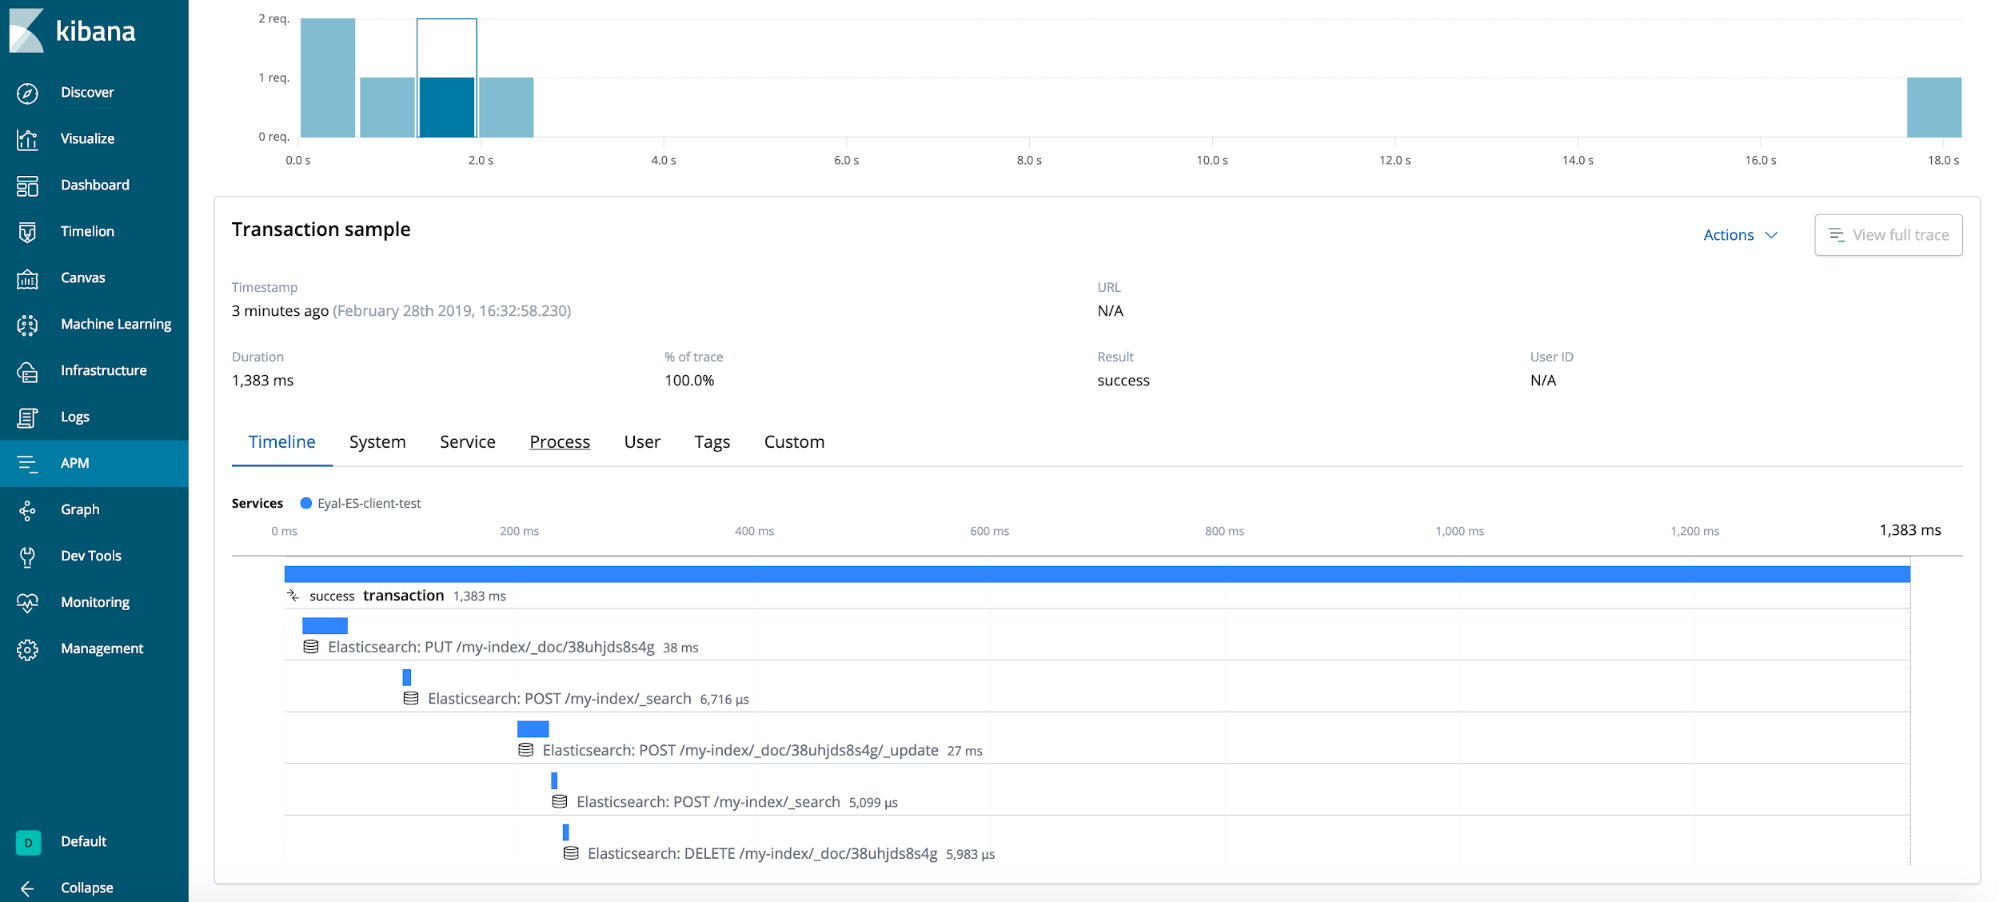
Before releasing our agent, we wanted to support our own datastore client. We wanted Elasticsearch Java REST client users to know:
- That a query to Elasticsearch occurred
- How long this query took
- Which Elasticsearch node responded the query request
- Some info about the query result, like status code
- When an error occurred
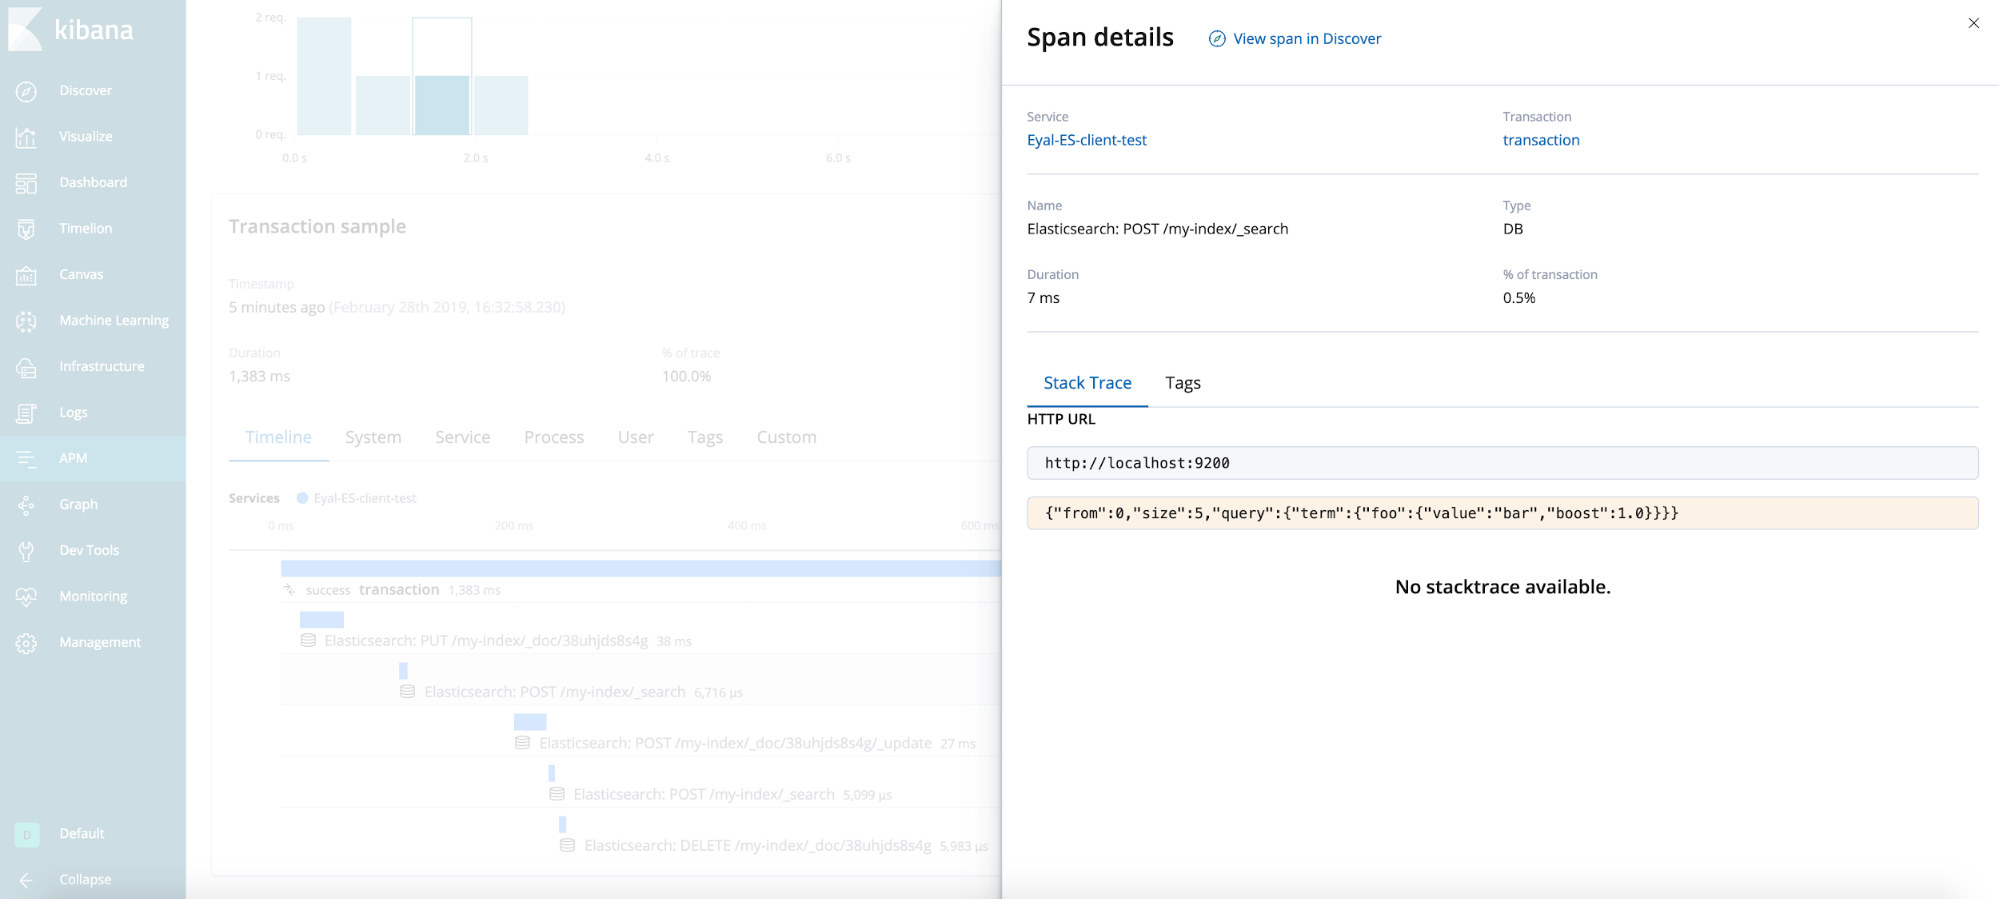
- The query itself for
_searchoperations
We also made the decision to only support sync queries as first step, delaying the async ones until we have a proper infrastructure in place.
I extracted the relevant code, uploaded it to a gist and referenced it throughout the post. Note that although it is not the actual code you would find in our GitHub repo, it is entirely functional and relevant.
Java agent specific aspects
When writing Java agent code, there are certain special considerations to make. Let’s try to go over them briefly before examining our test case.
Bytecode instrumentation
Don’t worry, you will not need to write anything in bytecode, we use the magical Byte Buddy library (that, in turn, relies on ASM) for that. For example, the annotations we use to say what to inject at the beginning and at the end of the instrumented method. You just need to keep in mind that some of the code you write is not really going to be executed where you write it, but rather injected as compiled bytecode into someone else’s code (which is a huge benefit of openness — you can see exactly what code is getting injected).
Class visibility
This may be the most elusive factor and where most pitfalls hide. One needs to be very aware of where each part of the code is going to be loaded from and what can be assumed to be available for it in runtime. When adding a plugin, your code will be loaded in at least two distinct locations — one in the context of the instrumented library/application, the other is the context of the core agent code. For example, we have a dependency on HttpEntity, an Apache HTTP client class that comes with the Elasticsearch client. Since this code is injected into one of the client’s classes, we know this dependency is valid. On the other hand, when using IOUtils (a core agent class), we cannot assume any dependency other than core Java and core agent. If you are not familiar with Java class loading concepts, it may be useful to get at least a rough idea about it (for example, reading this nice overview).
Overhead
Well, you say, performance is always a consideration. Nobody wants to write inefficient code. However, when writing agent code, we don’t have the right to make the usual overhead tradeoff decisions you normally make when writing code. We need to be lean in all aspects. We are guests at someone else’s party and we are expected to do our job seamlessly.
For more in-depth overview about agent performance overhead and ways of tuning it, check out this interesting blog post.
Concurrency
Normally, the first tracing operation of each event will be executed on the request-handling thread, one of many threads in a pool. We need to do as little as possible on this thread and do it fast, releasing it to handle more important business. Byproducts of these actions are handled in shared collections where they are exposed to concurrency issues. For example, the Span object we create at the very entry is updated multiple times across this code on the request handling thread, but later being used for serialization and sending to the APM server by a different thread. Furthermore, we need to know whether we trace sync or potentially-async operations. If our trace can start in some thread and continue in other threads we must take that into consideration.
Back to our test case
Following is a description of what it took to implement the Elasticsearch REST client plugin, divided into three steps only for convenience.
A word of warning: It’s becoming very technical from here on...
Step 1: Selecting what to instrument
This is the most important step of the process. If we do a bit of research and do this properly, we are more likely to find just the right method/s and make it real easy. Things to consider:
- Relevance: we should instrument method/s that
- Capture exactly what we want to capture. For example, we need to make sure that end-time minus start-time of the method reflects the duration of the span we want to create
- No false positives. If method invoked we are always interested to know
- No false negatives. Method always called when the span-related action is executed
- Have all the relevant information available when entered or exited
- Forward compatibility: we would aim for a central API that is not likely to change often. We don’t want to update our code for every minor version of the traced library.
- Backward compatibility: how far back is this instrumentation going to support?
Not knowing anything about the client code (even though it’s Elastic’s), I downloaded and started investigating the latest version, which was 6.4.1 at the time. Elasticsearch Java REST client offers both high and low level APIs, where the high level API depends on the low level API, and all queries eventually go through the latter. Therefore, to support both, naturally we would only look in the low level client.
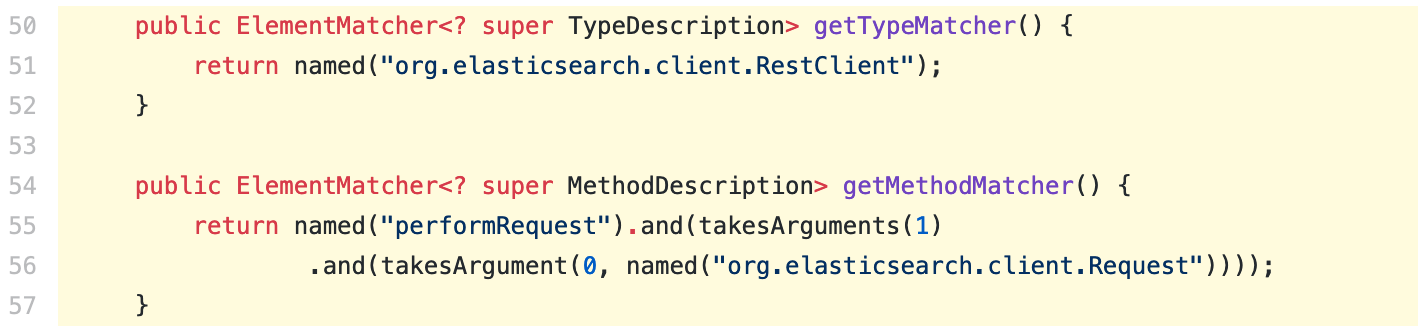
Digging into the code, I found a method with the signature Response performRequest(Request request) (here in GitHub). There are four additional overrides to the same method, all call this one and all are marked as deprecated. Furthermore, this method calls performRequestAsyncNoCatch. The only other method calling the latter is a method with the signature void performRequestAsync(Request request, ResponseListener responseListener). A bit more research showed that the async path is exactly the same as the sync one: four additional deprecated overrides calling a single non-deprecated one that calls performRequestAsyncNoCatch for making the actual request. So, for relevance the performRequest method got a score of 100%, as it exactly captures all and only sync requests, with both the request and response info available at entry/exit: perfect! The way we tell Byte Buddy that we want to instrument this method is by overriding the relevant matcher-providing methods.
Looking forward, this new central API seemed a good bet for stability. Looking backwards, though, it wasn’t as good of a choice — version 6.4.0 and prior didn’t have this API…
Since this was such a perfect candidate for instrumentation, I decided to use it and get long lasting support for Elasticsearch REST client, and add additional instrumentation for older versions. I did a similar process looking for a candidate there, and ended up with two solutions — one for versions 5.0.2 through 6.4.0 and another for versions >=6.4.1.
Step 2: Code design
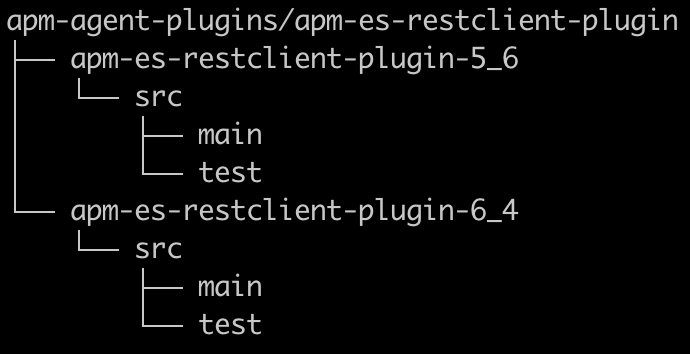
We use Maven, and each new instrumentation we introduce to support a new technology would be a module we refer to as a plugin. In my case, since I wanted to test both old and new Elasticsearch REST clients (meaning conflicting client dependencies), and because the instrumentation would be a bit different for each, it made sense that each would have its own module/plugin. Since both are for supporting the same technology, I nested them under a common parent module, ending up with the following structure:
It is important that only the actual plugin code will be packaged into the agent, so make sure library dependencies are scoped as provided and test dependencies are scoped test in your pom.xml. If you add third-party code, it must be shaded, that is, repackaged to use the root Elastic APM Java agent package name.
As for the actual code, following are the minimal requirements for adding a plugin:
The Instrumentation class
An implementation of the abstract ElasticApmInstrumentation class. Its role is to assist with the identification of the right class and method for instrumentation. Since the type and method matching can considerably extend application startup times, the instrumentation class provides some filters that enhance the matching process, for example, overlook classes that do not contain a certain string in their name or classes loaded by a class loader that has no visibility at all to the type we are looking for. In addition, it provides some meta-information that enables turning the instrumentation on and off through configuration.
Notice that ElasticApmInstrumentation is used as a service, which means each implementation needs to be listed in a provider configuration file.
The service provider configuration file
Your ElasticApmInstrumentation implementation is a service provider, which is identified in runtime through a provider-configuration file located in the resource directory META-INF/services. The name of the provider-configuration file is the fully qualified name of the service and it contains a list of fully qualified names of service providers, one per line.
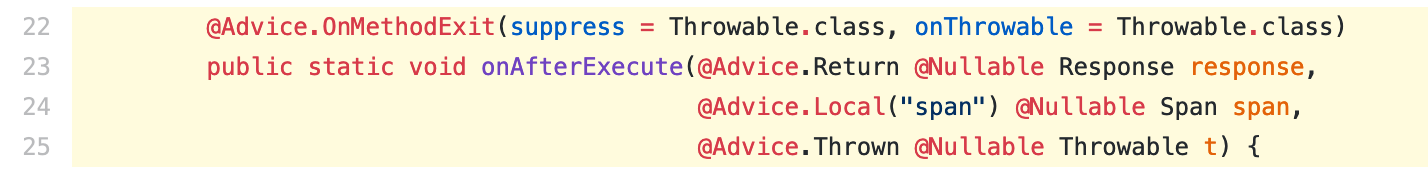
The Advice class
This is the class that provides the actual code that will be injected into the traced method. It doesn’t implement a common interface, but normally uses Byte Buddy’s @Advice.OnMethodEnter and/or @Advice.OnMethodExit annotations. This is how we tell Byte Buddy what code we want to inject at the beginning of a method and just before it is exited (quietly or throwing a Throwable). The rich Byte Buddy API allows us doing all kinds of fancy stuff here, like
- Create a local variable at method entry that will be available at method exit.
- Observe and possibly replace a method argument, the returned value or the thrown
Throwablewhere applies. - Observe
thisobject.
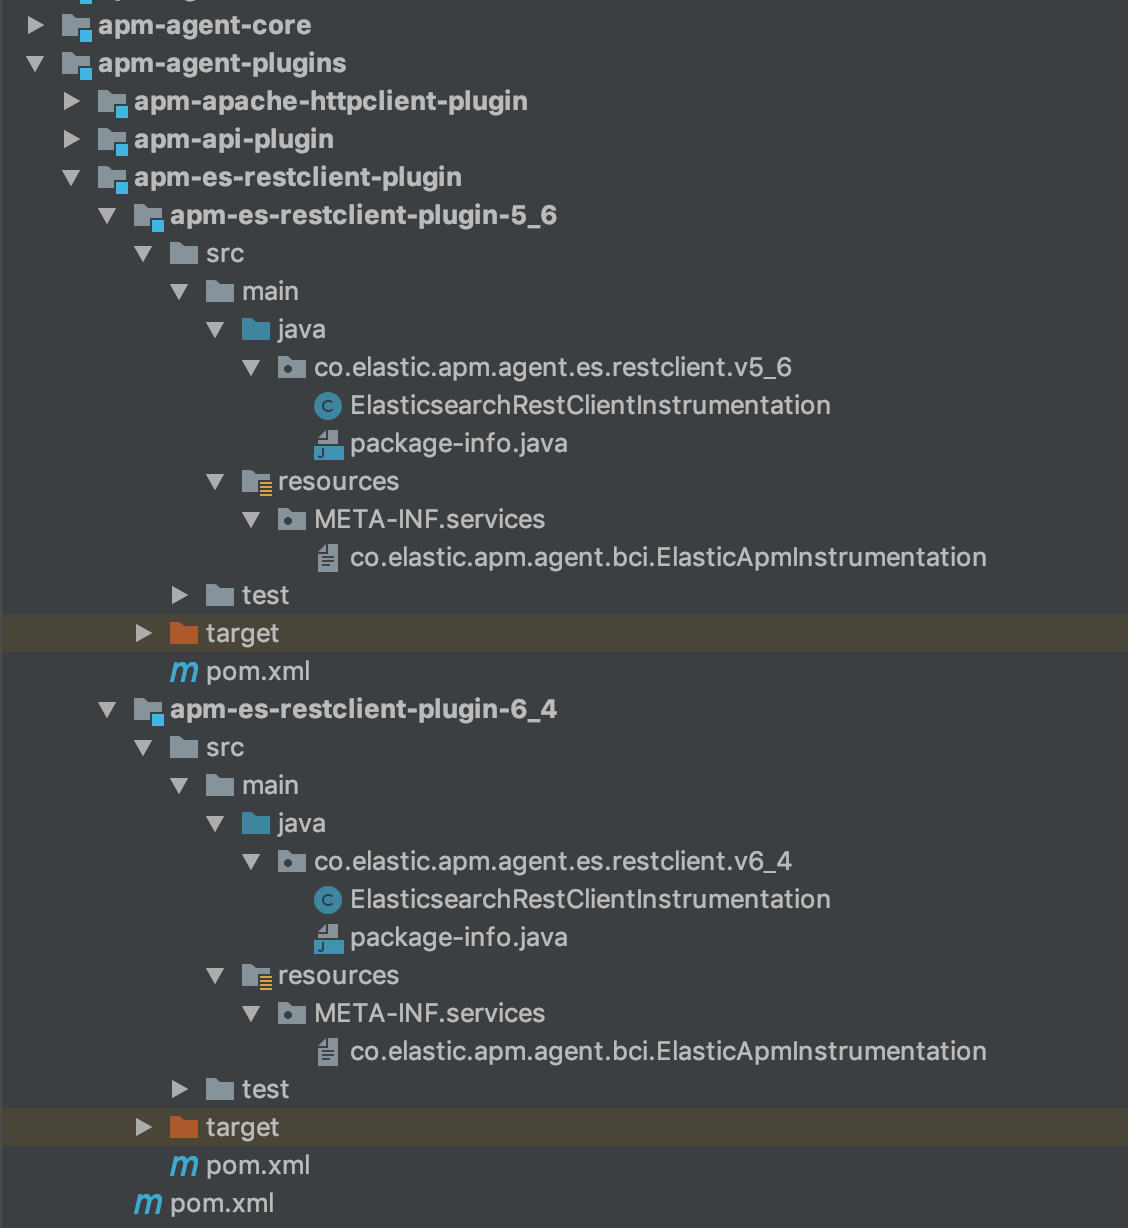
Eventually, my Elasticsearch REST client module structure is as follows:
Step 3: Implementing
As said above, writing agent code has some specifics to it. Let’s see how these concepts came about in this plugin:
Span creation and maintenance
Elastic APM uses spans to reflect each event of special interest, like handling HTTP request, making DB query, making remote call etc. The root span of each span-tree recorded by an agent is called a Transaction (see more in our data model documentation). In this case, we are using a Span to describe the Elasticsearch query, as it is not the root event recorded on the service. Like in this case, a plugin will normally create a span, activate it, add data to it and eventually deactivate and end it. Activation and deactivation are the actions of maintaining a thread-context state that enables obtaining the currently active span anywhere in the code (like we do when creating the span). A span must be ended and an activated span must be deactivated, so using try/finally is a best practice in this regard. In addition, if an error occurs, we should report that as well.
Never break user code (and avoid side-effects)
Besides writing a very “defensive” code, we always assume our code may throw Exceptions, which is why we use suppress = Throwable.class in our advices. This tells Byte Buddy to add an Exception handler for all Throwable types thrown during advice code execution, which ensures user code is still executed if our injected code fails.
In addition, we must make sure we don’t cause any side effects with our advice code that may change the state of the instrumented code and affect its behavior as a result. In my case, this was relevant for reading the request body of Elasticsearch queries. The body is read by obtaining the request content stream through a getContent API. Some implementations of this API will return a new InputStream instance for each invocation, while others return the same instance for multiple invocations per request. Since we only know which implementation is used at runtime, we must ensure that reading the body will not prevent it from being read by the client. Luckily, there is also an isRepeatable API that tells us exactly that. If we fail to ensure that, we may break client functionality.
Class visibility
By default, the Instrumentation class is also the Advice class. However, there is one important difference between them due to their role. The Instrumentation methods are always invoked, regardless of whether the corresponding library it aims to instrument is actually available or even used at all. On the other hand, the Advice code is only used when the relevant class of a specific library was detected. My Advice code has dependencies on Elasticsearch REST client code in order to get information like the URL used for the request, the request body, response code, etc. Therefore, it would be safer to compile the Advice code in a separate class and only refer to it by the Instrumentation class where needed. Note that more often than not, Advice code will have dependencies on the instrumented library, so this may be a good practice in general.
Performance overhead considerations
One of the things we wanted to do is get _search queries, which means reading the HTTP request body that we have access to in the form of InputStream. There is not much we can do about the fact that we need to store the body content somewhere, so the memory overhead would be at least the length of the body we allow reading for each traced request. However, there is a lot to do regarding memory allocations, that translate to CPU and pauses due to garbage collection. So we reuse ByteBuffer to copy bytes read from the stream, CharBuffer to store the query content until serialized and sent to APM server and even CharsetDecoder. This way, we don’t allocate and deallocate any memory on a per-request basis. This decreases overhead on the account of a bit more complicated code (code in the IOUtils class).
End result
General tips (not demonstrated in the test case)
Beware of nested calls
In some cases, when instrumenting API methods, you may encounter a scenario where one instrumented method calls another instrumented method. For example, an override method calling its super-method, or one implementation of the API wrapping another. Awareness of such scenarios is important, as we wouldn’t want multiple spans reported for the same action. There are no rules that say when this applies and when not, and most likely you would get different behaviour in different scenarios/settings, so the tip in this case is just to code in this awareness.
Beware of self-monitoring
Make sure your tracing code does not cause invocation of actions that will be traced as well. In the better scenario, this will result in reporting traced operations that the result of the tracing process itself. In the worse case, this can lead to stack overflow. An example would be in JDBC tracing — when trying to get some DB info, we use the java.sql.Connection#getMetaData API, which may cause a DB query to occur and get traced, leading to another invocation of java.sql.Connection#getMetaData and so forth.
Be aware of asynchronous operations
Asynchronous execution means that a span/transaction may be created in one thread, then get activated in another thread. Each span/transaction must be ended exactly once and always deactivated in each thread it was activated at. Therefore, one must be absolutely aware to this aspect.