Elasticsearch as one platform: What a second data system really costs
Running search, analytics, metrics, logs, and vector retrieval in five systems costs more than five licenses. Here's what one platform looks like in practice.
Get hands-on with Elasticsearch: Dive into our sample notebooks in the Elasticsearch Labs repo, start a free cloud trial, or try Elastic on your local machine now.
If you count the data engines in your stack, you’ll find that full-text search runs in one system, while analytics runs in a warehouse. You’ll also see that metrics live in a time series database and logs are in an aggregator. And vector retrieval sits in its own dedicated vector store. That’s five engines for five shapes of the same operational data, and the licenses are the cheapest part.
We wrote about the architecture behind consolidating those shapes in Why Elasticsearch is becoming a columnar database. This post is about the other side of the ledger. What does the split actually cost, and what does "search and analytics on one platform" mean in terms clear enough to hold up in a proof of concept?
What running five data engines actually costs
Anyone who has kept two sets of books for the same business knows where the hours go. Writing the second ledger is quick, but making the two agree is what takes the week.
Each engine needs its own ingest path, so the same events get parsed and shipped twice. That gives you two sets of failure modes and two backlogs to drain when a broker slows down. It also gives you drift: A field rename lands in one copy before the other, and for a while, the two systems disagree about the same hour of data. Reconciling that disagreement is real engineering work that rarely appears in the business case.
Each engine also brings a query language, and the syntax is the small part. The cost is everything written in that language, including dashboards, alert rules, saved queries, runbooks, and the operational knowledge of the person on call this week. Two languages means two of all of it, maintained in parallel.
Then there’s correlation. You find the failing request in the log aggregator. You move to the warehouse to chart how often it happened this week and then to the metrics store to check whether the host was saturated at the time. Each of those moves is a join performed by hand, by a person under time pressure, and every one of them adds minutes to the incident.
Retention compounds all of this. Each system gets its own lifecycle policy, so the cheap system ends up keeping data that the expensive one dropped weeks ago. When you finally need the history, it lives in the engine that cannot answer your question quickly.
Why search and analytics were split across two systems
The split was a reasonable response to a real constraint. Document engines and columnar engines were built to answer different questions. A document engine is good at finding the records that match a query and ranking them by relevance, and a columnar engine is good at reading three columns out of 50 and aggregating them across billions of rows. For years, running both was the reasonable answer, because no single system was credible at both jobs. The introduction of a full columnar engine in Elasticsearch 9.5 makes the split optional rather than necessary. For the full history and what changed, check out the columnar post.
What one platform means in practice
Three things have to be true before "one platform" means anything.
The first is one query language. Elasticsearch Query Language (ES|QL) runs across logs, metrics, traces, security events, and documents, which means a single skill set and one set of dashboards. Because it’s one language rather than a federation of several, queries compose: A time series aggregation can sit in the same query as
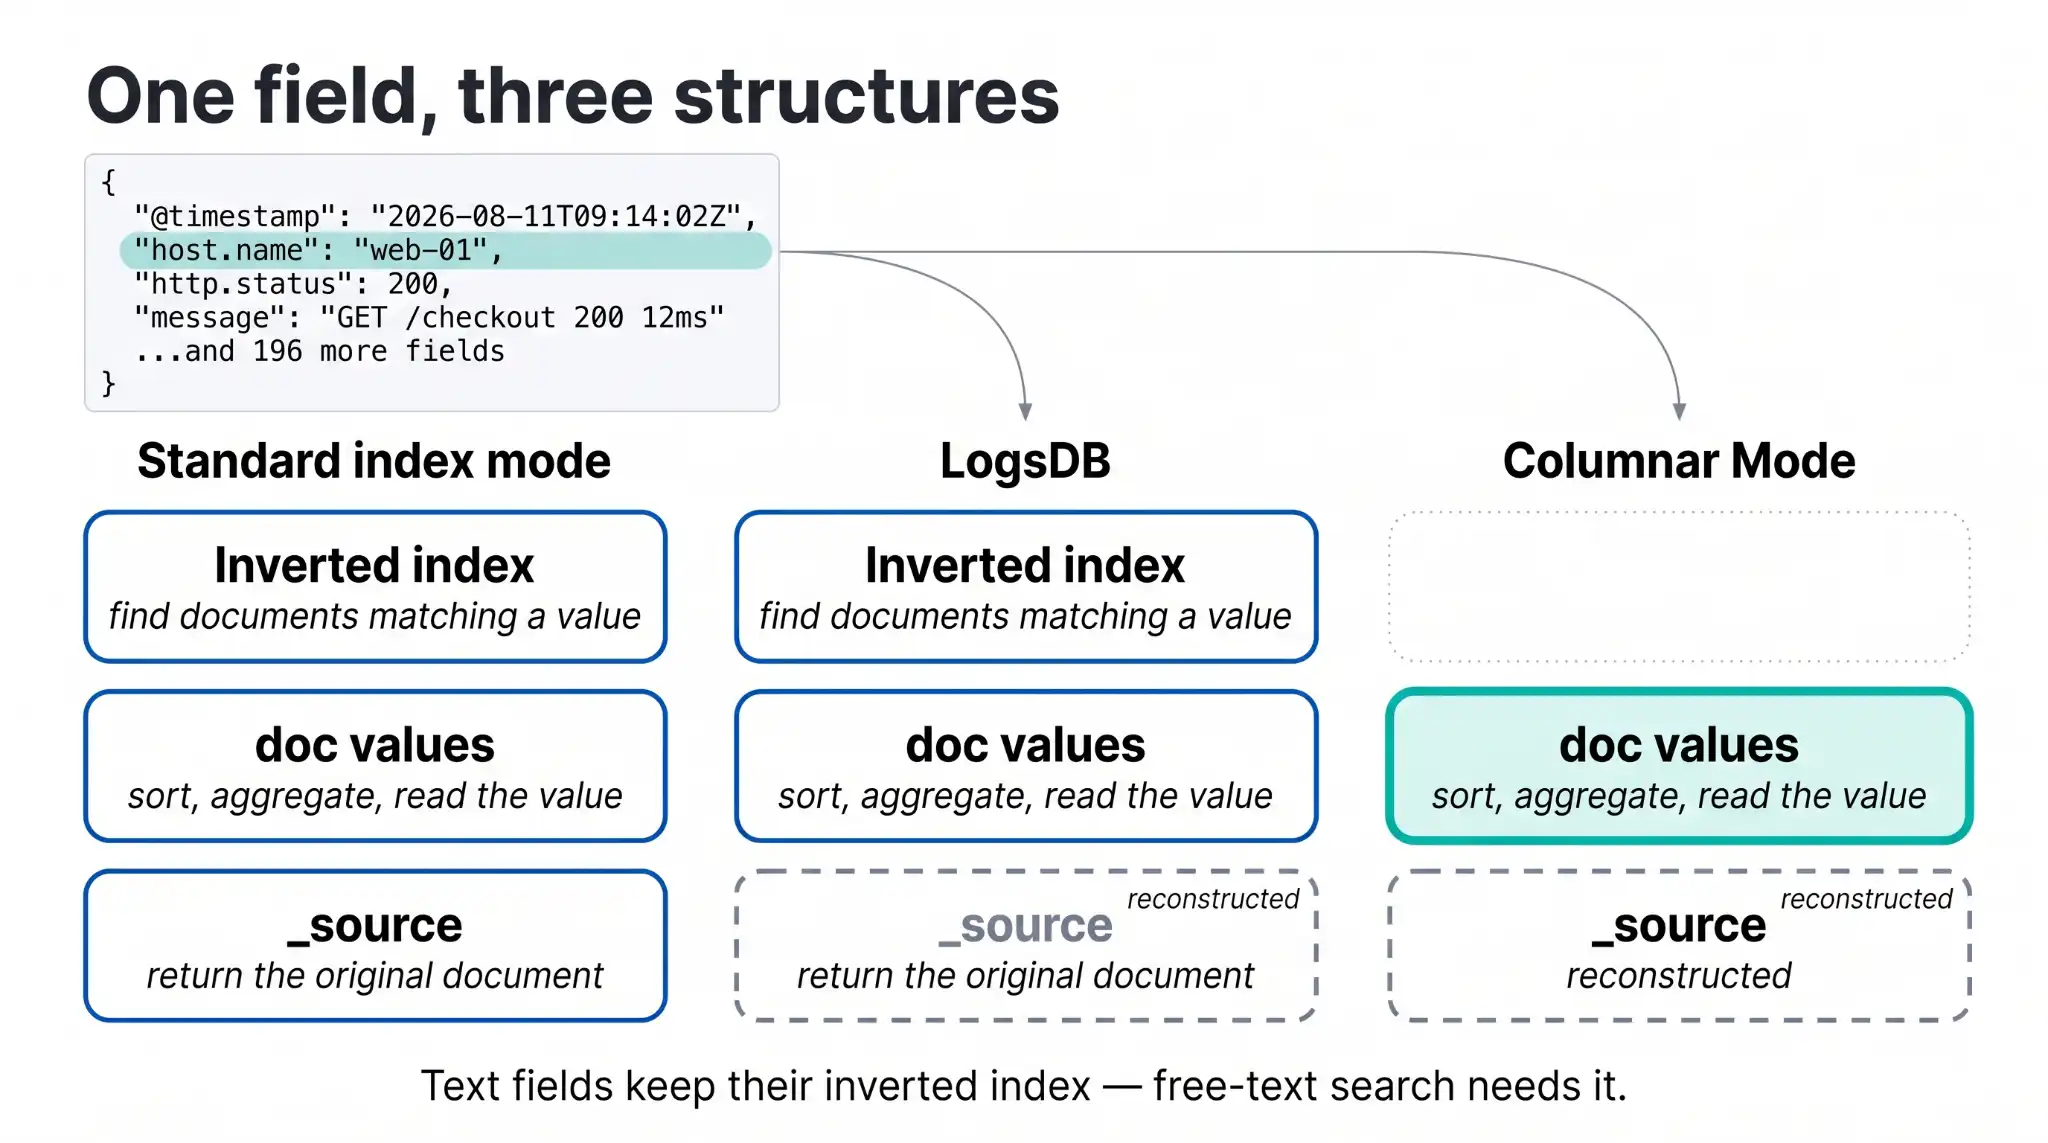
LOOKUP JOINorINLINE STATS, which systems built around PromQL alone cannot do.The second is one storage substrate. Doc values, the column store that has been inside Elasticsearch since 2013, is what every index mode reads and writes underneath. Various modes tune that substrate for different shapes of data. Elasticsearch's time series engine (TSDB) went fully columnar in 9.4, which is the clearest evidence so far that the approach works. Columnar Mode and Columnar Logs, both in technical preview in Elasticsearch 9.5, extend the same treatment to analytical and log-shaped data.
The third is one operational story. It’s the same cluster, with the same APIs, integrations, agents, access control, backup, and upgrade path that you already run.
Several index modes share one column store, and one language queries all of them inside a single cluster. That’s a narrower claim than "one engine for everything," and it’s the one that holds up when someone tests it.
When is a specialized database still the right choice?
A specialized system will always win a specialized benchmark. If your workload is one shape with a single query pattern, there’s a purpose-built engine that beats us on it, and we would rather say so than pretend otherwise. The argument for consolidation applies to data that spans more than one shape, which describes most production estates.
That said, being the general-purpose platform doesn’t mean settling for second place on every shape. We’ve climbed this curve once already. TSDB has stored metrics since Elasticsearch 8.7, and the early work concentrated on storage efficiency rather than on competing with dedicated metrics stores.
A run of releases from Elasticsearch 9.1 through 9.4 then turned it into a columnar metrics engine: OpenTelemetry (OTel) metrics now land at 3.75 bytes per data point, down from 25 a year earlier, which is 2.5x less storage than Prometheus and 2x less than ClickHouse. Gauge average and counter rate queries run up to 30x faster than Prometheus and Mimir, and on the high cardinality benchmark, Elasticsearch scans four hours of data across half a million time series in under two seconds, where the other systems needed more than 30 seconds. The full methodology and per-query results are in how we rebuilt Elasticsearch as a leading columnar metrics datastore.
Columnar Mode is at the start of that same curve. Technical preview lands in Elasticsearch 9.5 and general availability (GA) in 9.6, with phased improvements to storage, ingest, and query performance in the releases that follow. Metrics took a year of that work to get where they are, and we expect logs and analytical data to follow the same path rather than a shorter one.
Which workloads should stay on the document modes
Some workloads should stay exactly where they are.
Search-first applications, like product catalogs and knowledge bases, where the answer is the 10 most relevant documents, are what the existing document modes do well, and none of those modes are deprecated.
Frequent individual document updates - these workloads suit the document modes, too.
Nested data models - The same is true of data models that genuinely depend on nested structure, because Columnar Mode flattens fields into key/value pairs and doesn’t support the nested field type. In Elasticsearch 9.5,
semantic_textanddense_vectorfields aren’t available in Columnar Mode; a columnar profile for vector retrieval comes later.
Adoption is per index and opt-in. Existing indices continue to behave as they do today, and your APIs don’t change. Plus, your dashboards don’t break.
Where Columnar Mode is today: Elasticsearch 9.5 preview, 9.6 GA
Storage and performance numbers are coming in a separate technical deep dive, and the public roadmap issues for Columnar Mode and Columnar Logs are the right place to tell us what your workload needs.
If you want a real number for your own five-tool tax, start by counting two things: ingest pipelines carrying the same events to more than one destination, and dashboards that answer the same question in two different query languages. In most estates, the second number is the one that surprises people.
The release and timing of any features or functionality described in this post remain at Elastic's sole discretion. Any features or functionality not currently available may not be delivered on time or at all.
How helpful was this content?
Related Content
The fastest work is the work you never do: 100x faster sorted queries in Elasticsearch
The best LLM writes correct Elasticsearch ES|QL 59% of the time. Here's what breaks the other 41%.

Ask Elastic Agent Builder why it's slow: Natural-language trace analysis