Elastic Stack 8.12: Enhanced vector search with improvements to ES|QL and more

 Share on Twitter
Share on Twitter

 Share on LinkedIn
Share on LinkedIn

 Share on Facebook
Share on Facebook

 Share by Email
Share by Email

 Print this page
Print
Elastic® Stack 8.12 is built on top of Apache Lucene 9.9, the fastest Lucene release ever, and delivers big advancements to text, vector, and hybrid search — based on our contributions toward scalar quantization and search concurrency. This release also optimizes query parallelization in Elasticsearch® and enhancements to Kibana® including ES|QL query editing in Dashboard.
These new features allow customers to:
Utilize scalar quantization and Fused Multiply-Add (FMA), which reduce costs and query latency and enhance ingest performance for vector data searches
Experience significantly faster search and aggregation using query parallelization
Edit an ES|QL query directly on a Dashboard without the need to flip between the Dashboard and Discover application, as well as leverage improvements to the ES|QL in-app documentation to help users learn faster
Elastic Stack 8.12 is available now on Elastic Cloud — the only hosted Elasticsearch offering to include all of the new features in this latest release. You can also download the Elastic Stack and our cloud orchestration products, Elastic Cloud Enterprise and Elastic Cloud for Kubernetes, for a self-managed experience.
What else is new in Elastic 8.12? Check out the 8.12 announcement post to learn more >>
Faster and more efficient vector search, based on Apache Lucene 9.9
Between Lucene 9.6 and Lucene 9.9, some parameters have seen between 7% and 290% speed improvements! We’re excited to share with you some of the work we have contributed to Lucene.
Scalar quantization of vectors
Performing vector search is based on comparing the similarity of the query vector to the vectors in the index, which means performing an operation on each dimension of the vector. That means the index size (influencing cost), ingest performance, and query latency are all a function of the size of the individual vectors.
Many of the ML models that are used to generate the vectors are outputting vectors with float32 elements. A float32 consumes 4 bytes of memory, which allows for a lot of values (2^32). In most cases, there is very limited benefit to relevance ranking from maintaining so much information per dimension, since the same sorting (ranking) can be obtained by a much smaller dimension element. Testing is easy: transform the dimension value into a smaller data type, and see how much the ranking changes. We (and others) have done that and found that by increasing the number of candidates that are being evaluated by just a little bit, it is easy to get to zero reduction in ranking quality when transforming from float32 to int8 (from 4 bytes to 1 byte).
For that reason, we developed support for int8 element vectors in Elasticsearch, but up until now the transformation from float32 to int8 was performed by users. In 8.12 Elasticsearch handles the linear transformation from float32 to int8 by adding a new index options type for vectors: "int8_hnsw." The impact is in the tens of percent in reduced cost, improved ingest performance, and reduced query latency, typically without any noticeable impact on ranking quality even without increasing the number of candidates that are being evaluated. It is an option that most vector search users will benefit from. For more information, see our Introducing scalar quantization in Lucene and Scalar quantization 101 blogs.
kNN vector search as a query
Dense vector search using the HNSW algorithm is now available as a query. Up until now it had to be a top level element in the search request. This is part of a bigger change aimed to simplify the syntax for vector search and to allow combining vector search with other search mechanisms, to flexibly address more complex user requests.
Saving the norm at ingest for a more efficient cosine similarity
In Elasticsearch, we support four methods of vector similarity (Euclidian, Manhattan, cosine, and dot product), but in practice, most models output vectors that are supposed to be compared by cosine similarity. We have always recommended that users use dot product instead of cosine, but in order to do that, users had to normalize the vectors that the ML model produces at inference (i.e., divide them by their norm so that their length becomes 1). When the vectors are normalized, their sort order by dot product to the normalized query vector will be identical to their sort order by cosine prior to the normalization. The reason we recommended using dot product is that it requires fewer operations at query time, thus allowing for better query latency. If you examine the operations for dot product and for cosine, it all becomes clear:
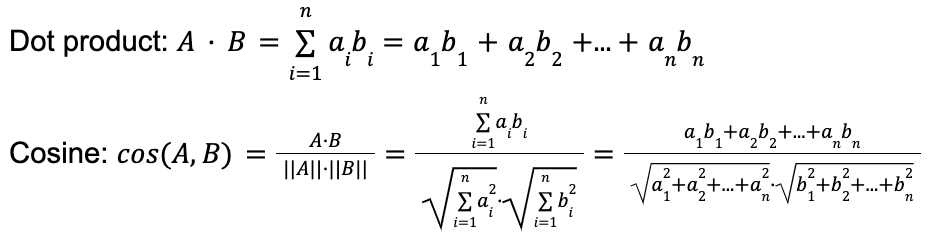
In other words, calculating a dot product requires a number of multiplication operations and a number of addition operations equal to the number of dimensions in the vector, while for cosine you first perform a dot product, and then on top of that twice the number of operations that it took to calculate the dot product (plus some minor overhead), in order to calculate the denominator. Now remember that this is calculated per each vector that is being considered as a potential result. As a side note, the many multiplications and summing operations are the reason the FMA enhancement introduced in 8.12 (see below) is so significant.
However, you may have noticed that the denominator, the norm…
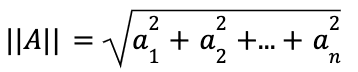
…is actually constant per vector, so instead of calculating it repeatedly per query, we calculate it once at ingest and keep the normalized vector and the norm (the added overhead per vector is negligible). This means that query latency when using cosine becomes just as efficient as when using dot product, because we simply perform dot product on the normalized vectors. We keep the norm so we can calculate the original vector upon need, for script access. The bottom line is that there is no need to normalize the vectors, which makes using vector similarity easier.
The improved query latency will automatically take place for any index that was created from 8.12 onward.
FMA instructions for vector search
Vector comparison (e.g., through dot product or cosine operations) involves repeatedly multiplying two numbers and summing the result with a third number (that’s how you calculate dot product
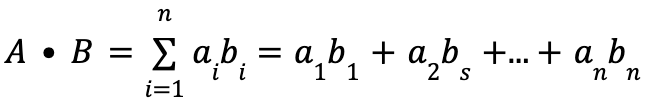
where n is the number of dimensions, and you repeat it for each evaluated vector, which is a lot).
We have changed the instructions that Lucene provides to the CPU in these situations, so that the multiplication and addition operations are performed as a single CPU operation (Fused Multiply-Add), if the CPU supports it (supported by ARM and x86 CPUs). This change improves vector indexing performance and query latency for dot product and cosine similarity. The improvement at the Lucene level is around 5% for dot product and can get to double digit territory for cosine similarity indexing (the impact in Elasticsearch is lower since there are additional operations that Elasticsearch performs and that are not impacted).
The only thing you need to do in order to benefit from this is to upgrade to 8.12. The improvement will just happen. More information about this change is available in our Vector similarity computations FMA-style blog.
When we took the strategic decision to develop vector similarity within Lucene and to make Lucene the best infrastructure for vector search, one of the key considerations was that we wanted users to benefit from this kind of meticulous engineering work that keeps optimizing and improving the engine, and the FMA optimization is a perfect example of this ongoing improvement.
Geographical search and aggregation
Geo queries in ES|QL
Elasticsearch has started introducing a new query language, which has many advantages going way beyond the simplified syntax. As part of the work on the new language, we are now introducing support for the geo_point and point data types via ES|QL. This functionality is still in tech preview and allows fundamental capabilities — mainly performing a Select operation on these geospatial data types. It is a basis that we will keep extending, since we see a lot of use for capabilities like joins, which could become available through ES|QL, in geo scenarios. Please try it out and provide your feedback.
Geo_shape runtime field
It is now possible to create a runtime field for geo_shape. Runtime fields are calculated at query time by running a painless script and can also be defined ad-hoc as part of a query. Having the ability to form a runtime field for geo_shapes opens a host of new possibilities, like being able to project from one coordinate system to another.
Query parallelization
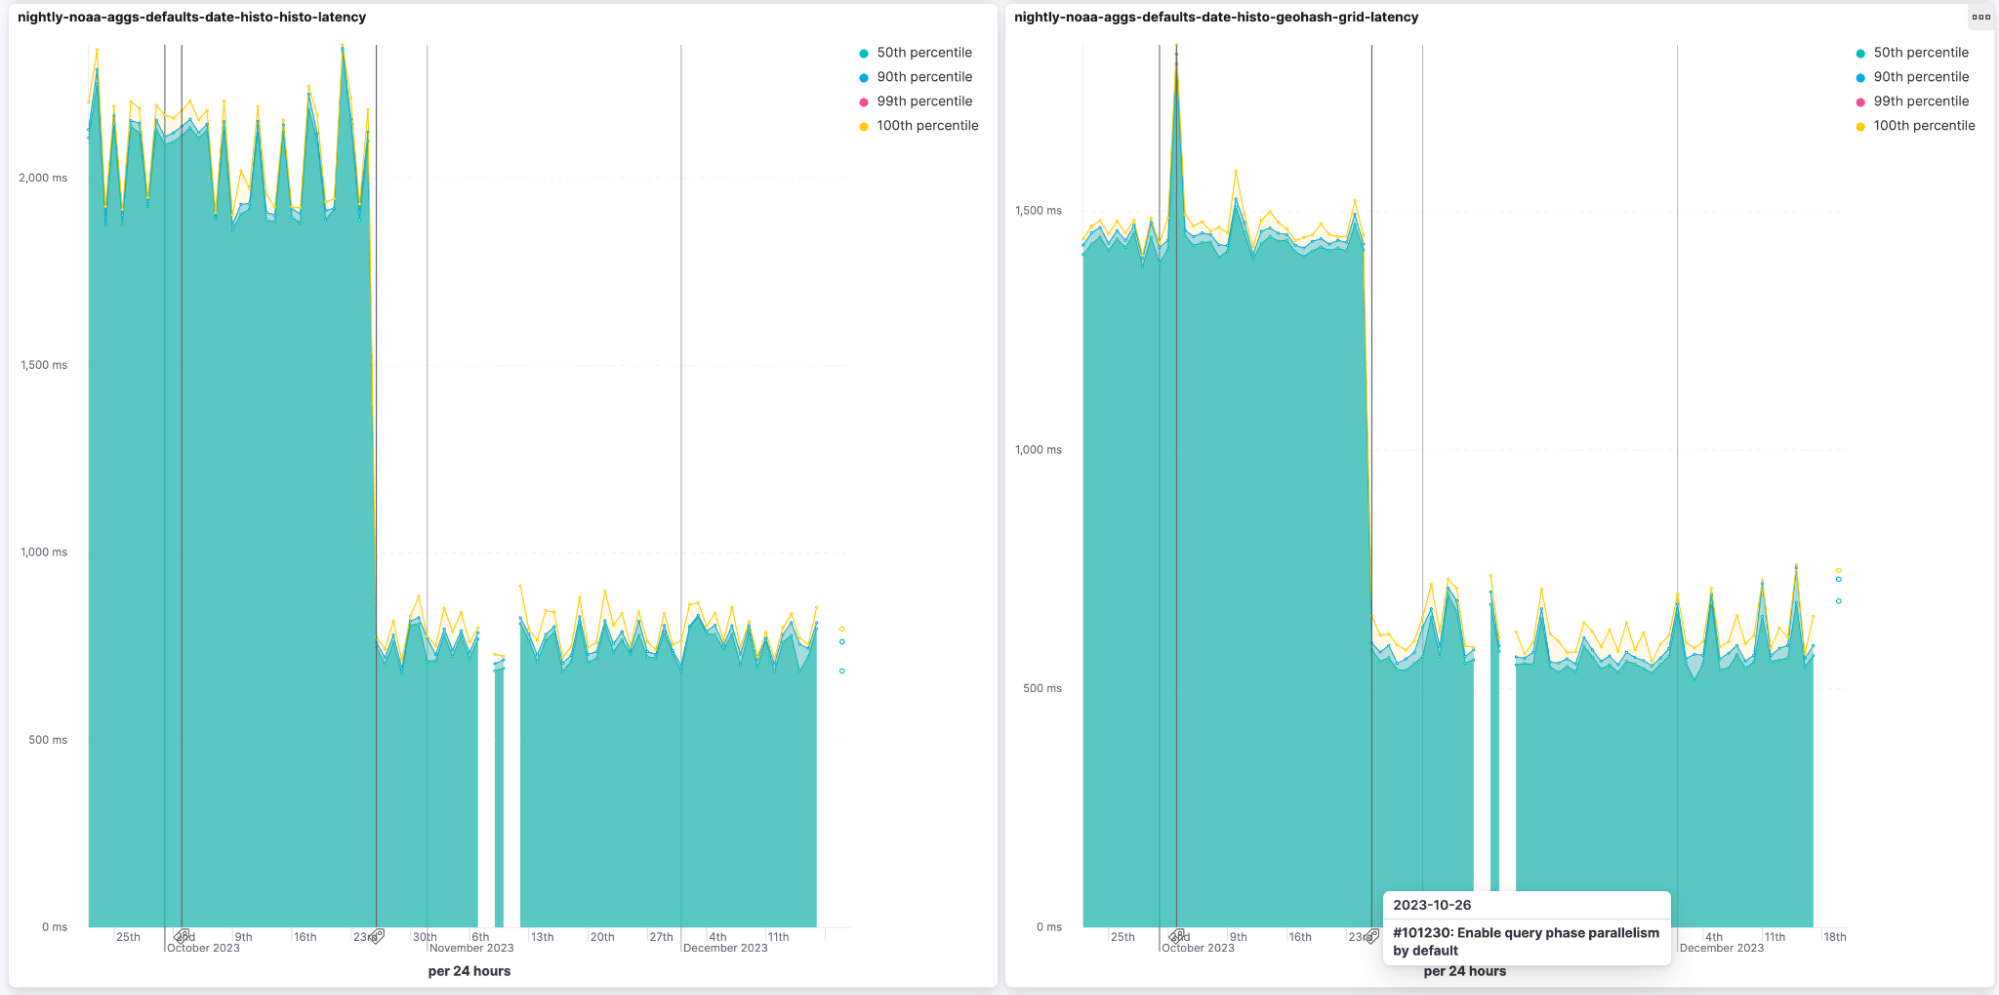
Up until recently, Elasticsearch would run each query with one thread per shard. That works really well when you have multiple queries running concurrently, but when the query load is lower than the cluster resources can handle, it might be that there is sub-optimal utilization of computing resources and a potential to improve query latency.
In 8.10, we added query parallelization for vector search, which improved query latency considerably under appropriate conditions. We are now adding similar parallelization for most other queries and aggregations. There are a few exceptions to that, most notably terms aggregation (since increasing the parallelization for terms aggregation would negatively impact their accuracy). The impact on aggregations is particularly significant, sometimes cutting the latency to less than a half of what it previously was. The new parallelization mechanism allocates up to a thread per segment per query, if there are available threads, and caps the maximum number of threads allocated per query. You can witness the results in our public nightly benchmarks.
New pipeline and routing simulation features
With the recent addition of the reroute ingest processor (GA in 8.11), ingest pipelines in Elasticsearch got a lot more flexible. Reroute lets you separate logs into appropriate data streams based on the data_stream.dataset and data_stream.namespace fields, or other fields and conditions that you specify. The only downside is this adds an element of mystery when developing or debugging ingest pipelines — without reroute, the maximum number of ingest pipelines that can be executed during the ingest of a single document was two (the specified pipeline or default pipeline, and the final pipeline).
Elasticsearch has long had the ability to simulate executing a pipeline for a given document, so you could quickly try out new pipelines or pipeline changes without actually storing any data. The existing simulate pipeline API could be used to test a pipeline and see what the resulting document would look like. When using reroute, the number of pipelines executed per document is unbounded, as each pipeline can reroute to another. We needed a new way to simulate the execution that would cover the full chain of pipelines.
The new simulate ingest API offers this capability, simulating ingesting data into an index. It executes the default and final pipeline for that index against a set of documents provided in the body of the request.
Simulate example:
POST /_ingest/_simulate
{
  "docs": [
    {
      "_index": "my-index",
      "_id": "123",
      "_source": {
        "foo": "bar"
      }
    },
    …
  ]
}
If a pipeline contains a reroute processor, it follows that reroute processor to the new index, executing that index’s pipelines as well (the same way that a non-simulated ingest would). No data is indexed into Elasticsearch. Instead, the transformed document is returned, along with the list of pipelines that have been executed and the name of the index where the document would have been indexed if this were not a simulation.
Simulate example response:
{
   "docs": [
      {
         "doc": {
            "_id": "123",
            "_index": "my-index",
            "_version": -3,
            "_source": {
               "field1": "value1",
               "field2": "value2",
               "foo": "bar"
            },
            "executed_pipelines": [
               "my-pipeline",
               "my-final-pipeline"
            ]
         }
      },
   …
This differs from the existing simulate pipeline API in that you specify a single pipeline for that API, and it only runs that one pipeline. The simulate pipeline API is more useful for developing a single pipeline, while the new simulate ingest API is more useful for troubleshooting the interaction of the various pipelines that get applied when ingesting into an index.
You can also supply substitute pipeline definitions in the body of the request, to use in place of the pipeline definitions that are already in the system. The pipeline substitutions are only used within this request to show what the documents would look like and which pipelines they would follow.
The simulate ingest API complements the simulate pipeline API by letting you test the integration of multiple pipelines across multiple indices, something that has never been possible before without actually indexing the data.
For the same reasons, we also added an option to the bulk API (list_executed_pipelines=true) to make it include the list of pipelines that were executed on each document in the response.
Even more handy access to status of remote searches
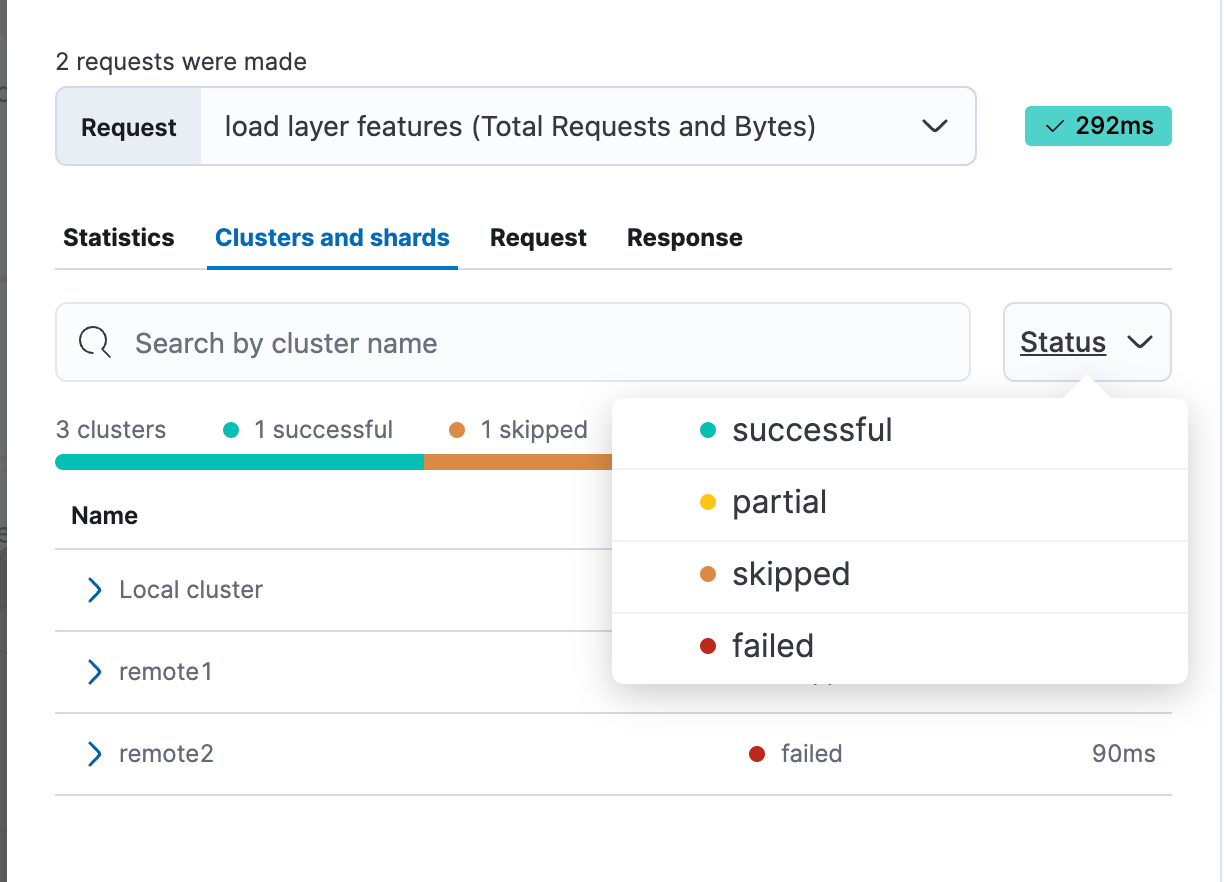
Kibana 8.12 is another step in our quest to make the best large scale distributed search even better (CCS, of course!). In 8.11, we added cross-cluster search response info at your fingertips with the new Clusters and shards tab in Kibana’s Inspector. With 8.12, we’ve added some nice new features to the Inspector and made it available under more circumstances.
If you have a lot of remote clusters (we have over 170), it’s now much quicker and easier to find the subset that had a particular status, or the status from a particular cluster. You can now filter by search status:
And if you want to only show clusters matching a certain name, just type part of the remote cluster name in the search box and we’ll filter the list of remotes.
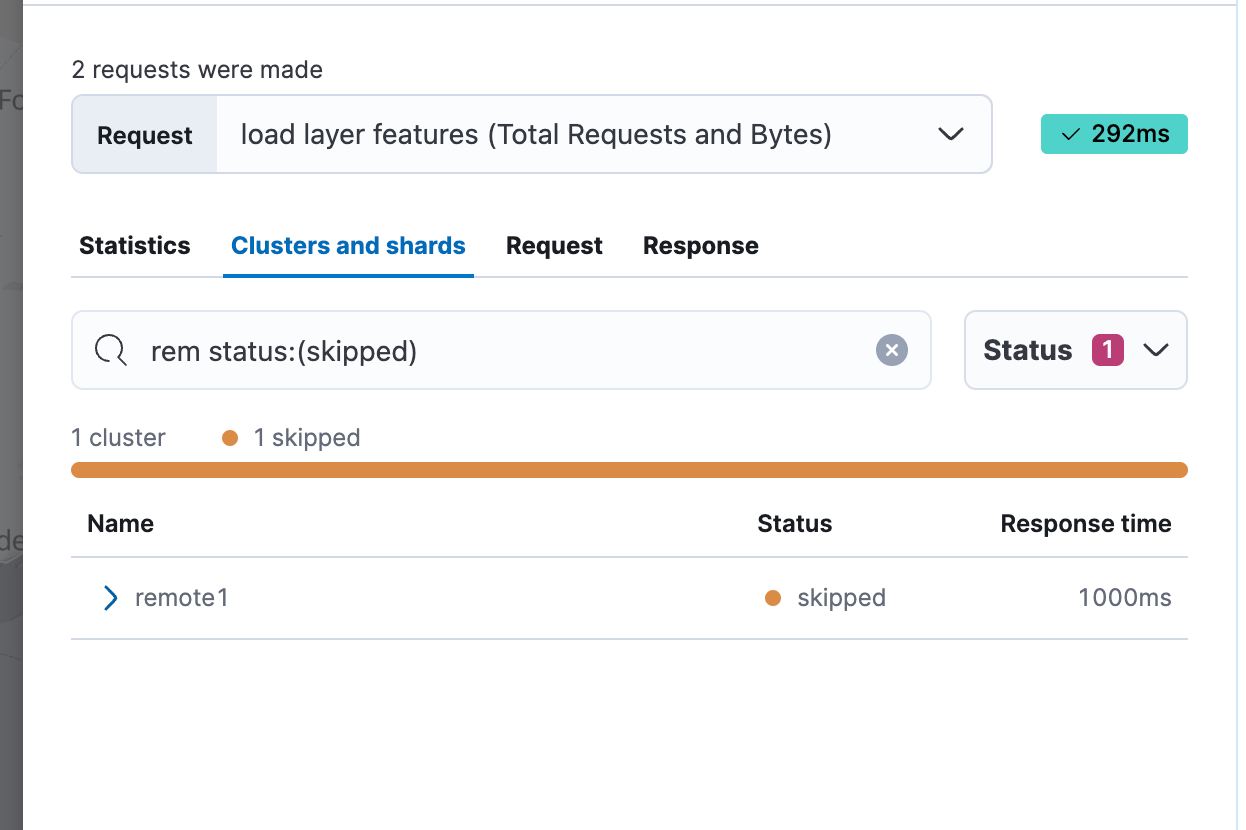
You can also sort the list by Name, Status, or Response time, making it easy to find the slowest remote cluster if needed.
All these great ways to better understand your remote searches are now available in more parts of Kibana as well. In 8.12, the Clusters and shards Inspector will be linked from Discover and Maps, not just Dashboards. We’ll also provide a link to it when searches fail, in addition to partial searches as we did in 8.11.
Kibana alerting
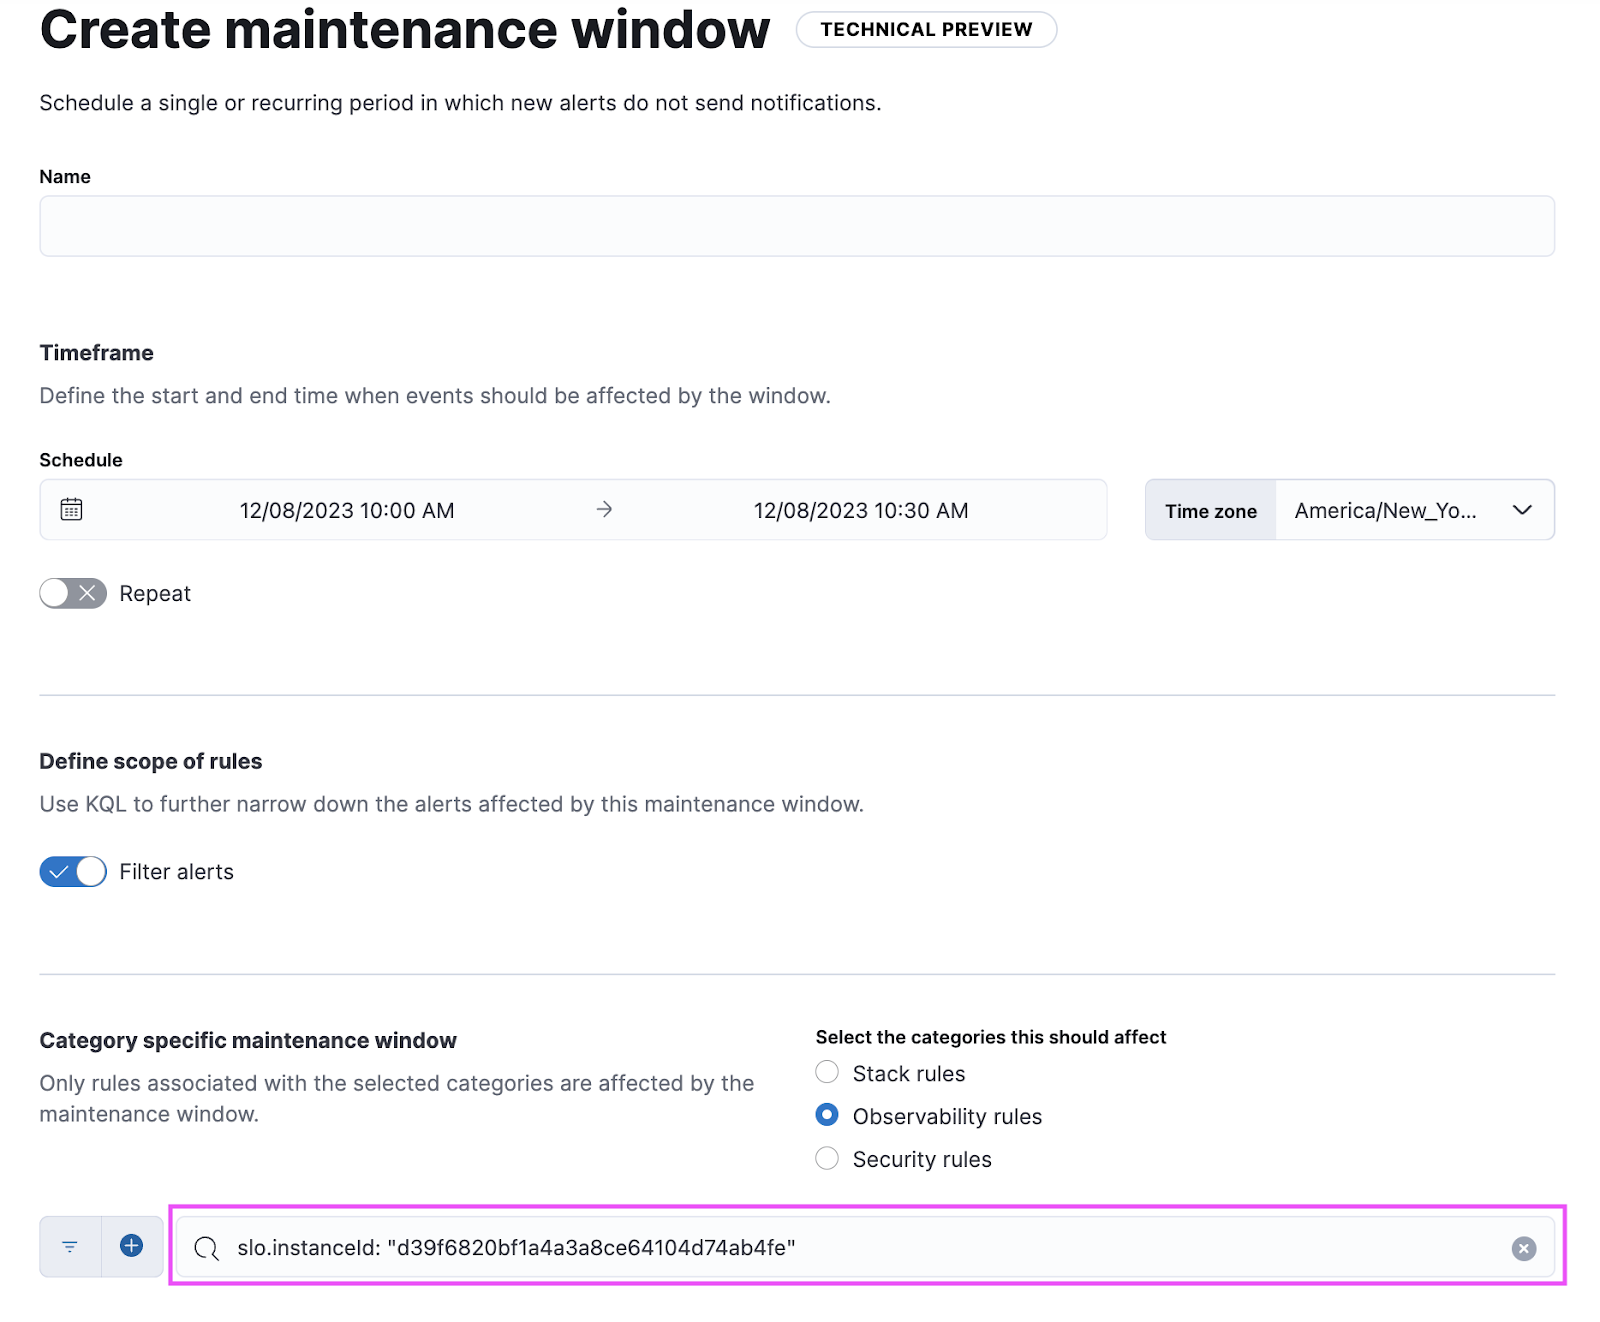
Maintenance windows
Schedule single or recurring maintenance windows to reduce alert noise and suppress notifications. For example, if you have a planned outage or event, a maintenance window prevents false alarms during this period. With this release, users will be able to create and define windows based on time and set query based alerts.
For example: as a user I want to suppress alerts on each Monday morning 9:00 a.m. to 10:00 a.m. and just for alerts that matches this query: App: “Billing” and cluster: “X123” and project: “Prod”
Connector improvements
PagerDuty alert action is now supported by two new fields: links and custom_details.
ServiceNow ITSM alert action allows users to define incident resolution when an alert is recovered to ensure bi-directonal sync between Elastic Alerts and ServiceNow Incidents.
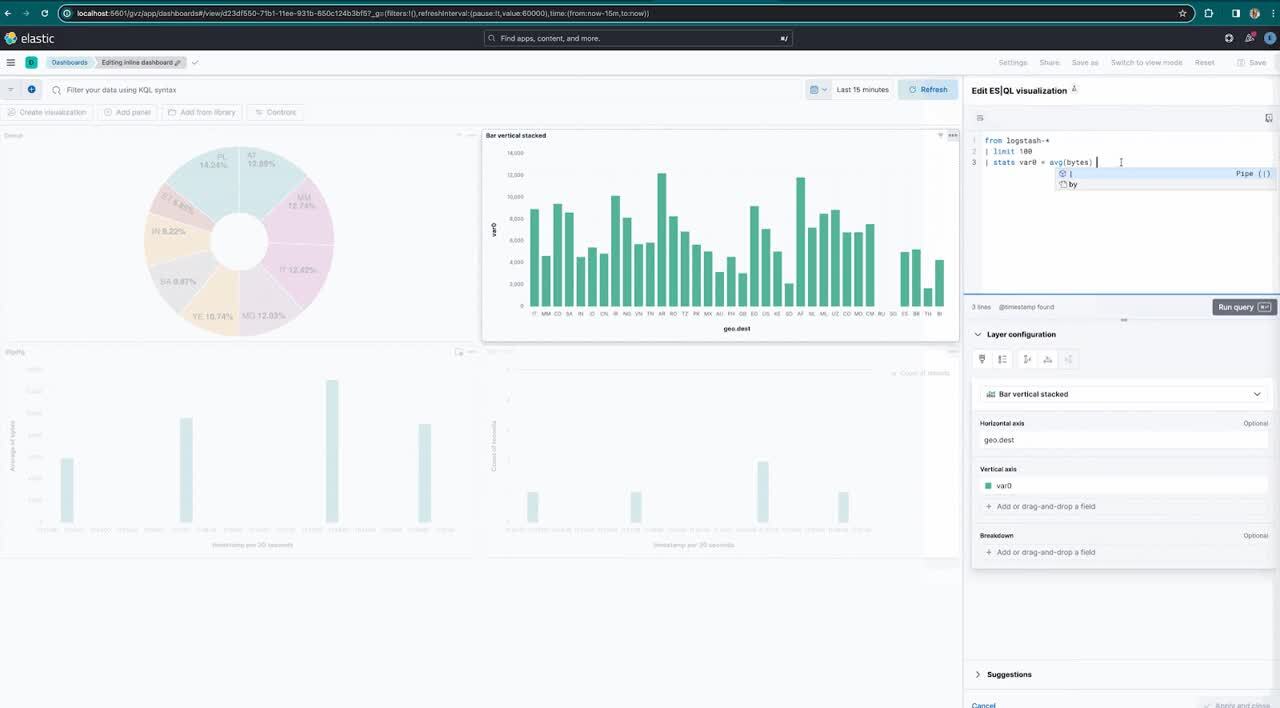
Edit ES|QL queries in a dashboard
We are introducing the ability to edit ES|QL queries directly via the dashboard. This view allows users to select among different chart suggestions, too. This is quite powerful since users don’t need to go back to the Discover page to edit the query and recreate the chart — they can simply adjust the query right there on a dashboard!
Elastic Stack 8.12 is a big release. Scalar quantization, Fused Multiply-Add (FMA), and other Lucene 9.9 enhancements add up to reduced costs and query latency, while delivering faster vector search performance. The introduction of kNN vector search as a query makes for better developer experience. Advancements in query parallelization cut query latency by speeding up various search and aggregation functions. For ES|QL users, the new query editing capability directly within Dashboards makes for a simpler user experience, empowering seamless adjustments without navigating away. These upgrades, combined with improvements in geo search, ingest pipeline simulation, remote search status access, and connector enhancements, all add up to make Elastic Stack 8.12 worthy of a quick upgrade!
Try it out
Read about these capabilities and more in the release notes.
Existing Elastic Cloud customers can access many of these features directly from the Elastic Cloud console. Not taking advantage of Elastic on cloud? Start a free trial.
The release and timing of any features or functionality described in this post remain at Elastic's sole discretion. Any features or functionality not currently available may not be delivered on time or at all.
Share
- Share on Twitter
Share on Twitter
- Share on LinkedIn
Share on LinkedIn
- Share on Facebook
Share on Facebook
- Share by Email
Share by Email
- Print this page
Print