Improved IT performance
The company can better anticipate incidents and ensure greater availability of its ERP systems and databases with Elastic Observability.
Saved hundreds of employee hours
Cuts resolution times from one hour to less than 30 seconds by automating many incident processes, saving as much as 160 employee hours per month.
Reduced business costs
Employees no longer need to work overtime to resolve issues that are now automated, lowering payroll costs.
This Global 2000 energy company is one of the largest businesses in Brazil with thousands of gas stations and giant gas containers that dominate the country’s ports. It was founded in the early 1900s and today has more than 16,000 employees, with operations that include fuel distribution, storage, and specialty chemicals production.
The scale of the company’s IT infrastructure, which supports operations in Brazil and eight other countries, reflects the size of the business. The expansive infrastructure includes over 750 applications, including enterprise resource planning (ERP) applications that enable day-to-day operations such as financials, sales, and inventory. These applications run mostly on Oracle databases that require constant monitoring to maximize availability and resolve incidents before they impact business.
Reducing overtime, increasing efficiency
Monitoring application and infrastructure across countries and organizations presents a number of challenges. As the company grew, it deployed a complex array of monitoring tools and integrations, but this created many potential points of failure. Small issues could sometimes crash the entire system.
Incident reporting was also inconsistent. In some cases, the IT team only became aware of a problem when an employee reported it. Team members often worked overtime to fix issues, which prevented them from focusing on work that added value to the business.
One IT Manager at the company responsible for the health of the company’s information systems, was determined to improve the monitoring process as well as the collaboration between the AIOps and DevOps teams. In addition to accelerating incident resolution, he wanted to reduce the pressure on his team caused by a steady influx of incident tickets. "Our first goal was to improve observability by finding new ways to identify anomalies and take action to correct them," says the IT Manager. "Another was to reduce manual work, using automated processes to solve certain problems, which would reduce the burden on the DevOps team as well as lower costs."
Supporting the new normal of remote work
A complete rethink of the monitoring architecture was needed. The IT Manager and several members of his team were already familiar with Elastic from previous roles and quickly agreed to deploy Elastic Observability for application and infrastructure monitoring. The configuration includes Elasticsearch for data storage and search, plus Kibana for visualization.
Currently, the Elasticsearch clusters contain 5.5 billion indexed documents and 5.2 TB of storage with index search latency below one millisecond.
"The performance is really impressive," says the IT Manager. "Our Logstash environment currently handles around 1,500 events per second. The latency rate of events is less than two milliseconds."
At the time of the Elastic deployment, most employees had begun working from home due to the Covid-19 pandemic, which also presented an observability challenge. The IT Manager decided to leverage Elastic to monitor the corporate VPN, including the health and performance of VPN apps and data transmission. This enabled the company to move more smoothly to a hybrid working environment while protecting business security and supporting employee productivity.
Elastic Observability has since been deployed to monitor dozens of other systems including the hundreds of Oracle databases that underpin the company’s ERP systems. Elastic also monitors the APIs that support integration between different business applications.
Elastic provides the IT Manager and his team with the flexibility to address all aspects of monitoring. "For some databases we just read the logs. For others we can execute a query inside the database. We can also monitor our infrastructure to collect health and performance data from servers, databases, and other components in our tech stack," he says.
The awesome power of automation
Elastic was also initially integrated with the company’s ServiceNow technical support management platform to open and assign incident tickets to the support team. Some of those processes are now automated using the Alert and Actions feature in Kibana. When a threshold is reached, Kibana invokes a Jenkins API to execute commands in the database and resolve anomalies without needing to open a ticket.
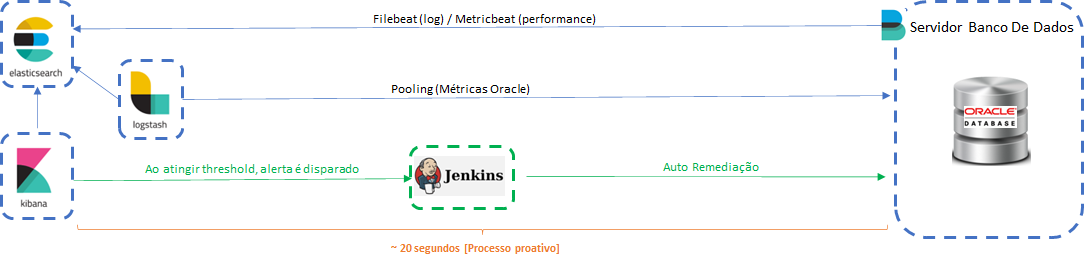
The company’s infrastructure management using Elasticsearch, Kibana, and Logstash
"With Elastic Observability, we have a much better understanding of systems behavior and accelerated detection of issues. Resolution is also faster and more effective, which helps increase overall operating efficiencies."
Another example of process automation is autoscaling, which automatically increases database storage before capacity is reached. Previously, database storage overruns resulted in about 150 incident tickets per month. An IT Architecture Analyst at the company explains that it could take a support agent an hour to resolve the issue. With Elastic, it now takes less than half a minute.
We are saving as much as 160 hours of manual work every month by using Elastic Observability. The system works 24/7, which has helped reduce employee overtime hours to lower stress on the team and save the company money.
The IT Architecture Analyst also cites a process automation example involving an invoicing application that would stop working due to activity lapses. Inactivity would lock the database and prevent access to data. "Prior to using Elastic Observability and its automation tools, inactivity locks had to be removed manually. Now they are detected and fixed automatically before they can impact operations," he says.
With automated monitoring capabilities, the IT team can get ahead of incidents by proactively resolving many issues before they become noticeable to users. The IT Managersays, "With Elastic, we have fewer tickets, better detection, faster resolution, and more satisfied colleagues. It’s the ideal outcome."
He also sees Elastic playing a role in the company’s digital transformation initiative. The company is making a significant investment in the modernization and consolidation of its IT systems to increase efficiency and productivity while expanding growth. "Elastic is an important part of our digital strategy," says the IT Manager. "It’s helping us to reduce IT incidents, manual work, and overtime costs, which bring significant benefits to the overall organization."