Why am I seeing bulk rejections in my Elasticsearch cluster?
Elasticsearch supports a wide range of use-cases across our user base, and more and more of these rely on fast indexing to quickly get large amounts of data into Elasticsearch. Even though Elasticsearch is fast and index performance is continually improved, it is still possible to overwhelm it. At that point you typically see parts of bulk requests getting rejected. In this blog post we will look at the causes and how to avoid it.
This is the second installment in a series of blog posts where we look at and discuss your common questions. The first installment discussed and provided guidelines around "How many shards one should aim to have in an Elasticsearch cluster?"
What happens when a bulk indexing request is sent to Elasticsearch?
Let’s start at the beginning and look at what happens behind the scenes when a bulk indexing request is sent to Elasticsearch.
When a bulk request arrives at a node in the cluster, it is, in its entirety, put on the bulk queue and processed by the threads in the bulk thread pool. The node that receives the request is referred to as the coordinating node as it manages the life of the request and assembles the response. This can be a node dedicated to just coordinating requests or one of the data nodes in the cluster.
A bulk request can contain documents destined for multiple indices and shards. The first processing step is therefore to split it up based on which shards the documents need to be routed to. Once this is done, each bulk sub-request is forwarded to the data node that holds the corresponding primary shard, and it is there enqueued on that node’s bulk queue. If there is no more space available on the queue, the coordinating node will be notified that the bulk sub-request has been rejected.
The bulk thread pool processes requests from the queue and documents are forwarded to replica shards as part of this processing. Once the sub-request has completed, a response is sent to the coordinating node.
Once all sub-requests have completed or been rejected, a response is created and returned to the client. It is possible, and even likely, that only a portion of the documents within a bulk request might have been rejected.
The reason Elasticsearch is designed with request queues of limited size is to protect the cluster from being overloaded, which increases stability and reliability. If there were no limits in place, clients could very easily bring a whole cluster down through bad or malicious behaviour. The limits that are in place have been set based on our extensive experience supporting Elasticsearch for different types of use-cases.
When using the HTTP interface, requests that results in at least a partial rejection will return with response code 429, 'Too many requests'. The principle also applies when the transport protocol is used, although the protocol and interface naturally is different. Applications and clients may report these errors back to the user in different ways, and some may even attempt to handle this automatically by retrying any rejected documents.
How can we test this in practice?
In order to illustrate the practical impact of this behaviour, we devised a simple test where we use our benchmarking tool Rally to run bulk indexing requests against a couple of Elastic Cloud clusters with varying number of data nodes. Configuration and instructions on how to run Rally is available in this gist.
The same indexing workload was run against three different Elastic Cloud clusters. We have been indexing with one replica shard configured wherever possible. The clusters consisted of one, two and three data nodes respectively, with each data node having 8GB RAM (4GB heap for Elasticsearch, 4GB native memory). Invoking the GET /_nodes/thread_pool API we could see that each data node by default had a fixed bulk thread pool size of two with a queue size of 200:
%> curl -XGET http://<es_url>:<es_port>/_nodes/thread_pool</es_port></es_url>
"bulk": {
"type": "fixed",
"min": 2,
"max": 2,
"queue_size": 200
}
During the test we indexed into a varying number of shards (2, 4, 8, 16, and 32) using a varying number of concurrent clients (8, 16, 24, 32, 48, and 64) for each cluster. For every combination of shard and client count we indexed 6.4 million documents with a batch size of 100 documents and another 6.4 million documents with a batch size of 200 documents. This means that in total we attempted to index 384 million documents per cluster.
For this test we treat the clusters as a black box, and perform the analysis from the client’s perspective. To limit the scope we will also not look at the impact of various configurations on performance as that is a quite large topic on its own.
All the generated, detailed metrics were sent to a separate Elastic Cloud instance for analysis using Kibana. For each request Rally measures how many the documents in the bulk request were rejected and successful. Based on this data we can classify each request as successful, partially rejected, and fully rejected. A few requests also timed out, and these have also been included for completeness.
Unlike Beats and Logstash, Rally does not retry failed indexing requests, so each has the same number of requests executed but the final number of documents indexed varied from run to run depending on the volume of rejections.
How bulk rejection frequency depend on shard count, clients count, and data node count?
Bulk rejections occur when the bulk queues fill up. The number of queue slots that get used depends both on the number of concurrent requests, and the number of shards being indexed into. To measure this correlation we have added a calculated metric, client shard concurrency, to each run. This is defined as the number of shards being indexed into, multiplied by the number of concurrent indexing threads, and indicates how many queue slots would be needed to hold all bulk sub-requests.
In the graph below, we show how the percentage of requests that result in partial or full rejections, depends on the client shard concurrency for the three different clusters.
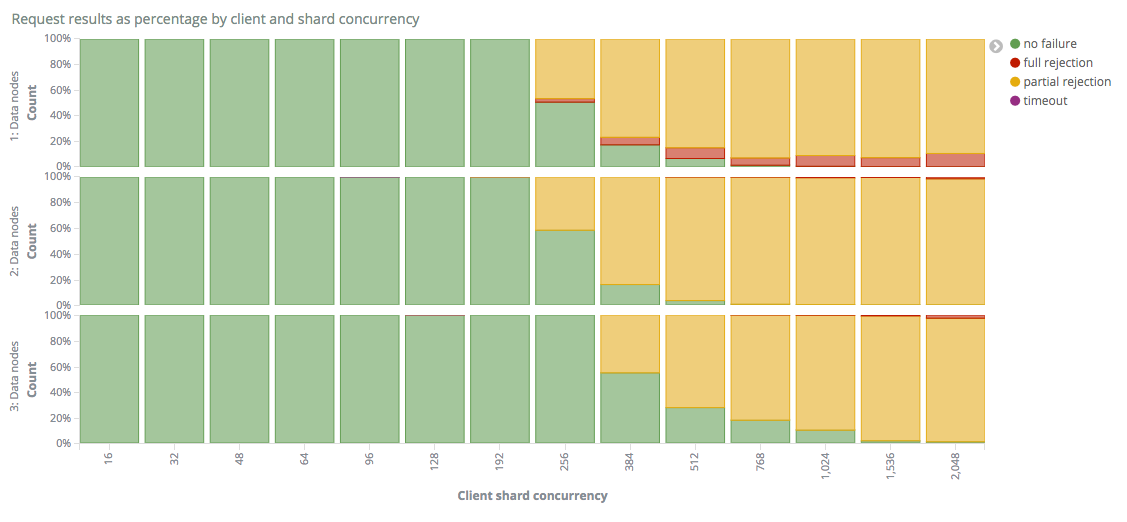
For clusters with one or two nodes we can see that appearance of bulk rejections start when the client shard concurrency level is somewhere between 192 and 256. This makes sense as each node has a bulk queue size of 200. For the cluster with 3 nodes we can see that it is able to handle even higher level of client shard concurrency without any bulk rejections appearing.
Once we get over this limit, we start seeing partial bulk rejections, where at least one sub-request has managed to get queued and processed. A relatively small portion of requests also result on full rejections as the concurrency level increases, especially for the single node cluster.
When we compare the single and two node clusters, we can see that the percentage of fully successful requests increases slightly and that there are fewer full rejections. This is expected, as the total bulk queue across the cluster is twice as large and requests are sent to all data nodes. Even though the total bulk queue size is twice as large across the cluster, the 2 node cluster does not appear able to handle twice the client shard concurrency of the single node cluster. This is likely due to the fact that distribution is not perfect and that the introduction of replica shards have resulted in each indexing operation requiring more work and being slower as a result. An important thing to note is also that all partial rejections are treated as equals in this graph. The number of rejected documents is not shown and does indeed vary depending on the cluster size, but we will shortly look at that in greater detail.
When we go to three data nodes, we see a more marked improvement, and receive requests without any rejections at high levels of concurrency. We also only see full rejections for the highest concurrency levels.
If we instead plot the average portion of rejected documents per request as a function of shard and client count for the three clusters, we get the following graphs.
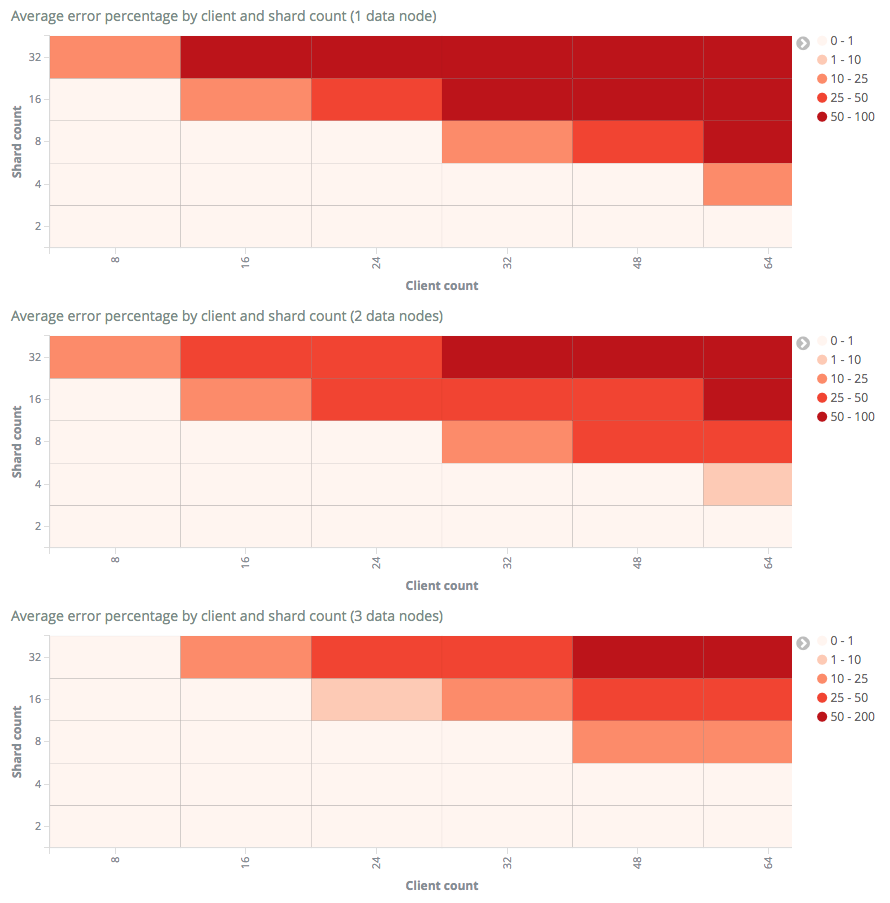
Here we can see that the percentage of rejected events grows with increased concurrency levels for all cluster sizes. We can also see that the rejection levels drop across the board with the more data nodes we add, which is expected.
Earlier we saw that partial rejections started at approximately the same time for both one and two node clusters. If we now look at these graphs, we can see that the portion of rejected documents grows faster for the single node cluster compared to the one with two data nodes. This means that even though we saw a similar level of partially rejected requests, the larger cluster had more documents indexed per request.
Can’t I just get around this by increasing the bulk queue size?
One of the most common reactions when faced with bulk rejections is to increase the size of the bulk queue. Why not set it to a really large value so you do not have to worry about this again?
Increasing the size of the queue is not likely to improve the indexing performance or throughput of your cluster. Instead it would just make the cluster queue up more data in memory, which is likely to result in bulk requests taking longer to complete. The more bulk requests there are in the queue, the more precious heap space will be consumed. If the pressure on the heap gets too large, it can cause a lot of other performance problems and even cluster instability.
Adjusting the queue sizes is therefore strongly discouraged, as it is like putting a temporary band-aid on the problem rather than actually fixing the underlying issue. So what else can we do improve the situation?
Can coordinating only nodes help?
By introducing coordinating only nodes, the data nodes will be able to focus on processing sub-requests, as the request itself will not take up a slot on their bulk queue. This is generally good, but the actual benefit of this arrangement is likely to vary from use-case to use-case. In many use cases it does relatively little difference, and we see lots of successful indexing heavy use cases that do not use dedicated coordinating nodes.
What conclusions can we draw?
As always, there is not necessarily any good one-size-fits-all solution, and the way to address bulk rejections will vary from use-case to use-case. If you see bulk rejections, try to understand why they are taking place and whether it is a single node or the whole cluster that is affected.
If the cluster is unable to cope with the load, ensure that all nodes are sharing the load evenly. If this does not help, it may be necessary to scale the cluster out or up. This will increase capacity and make it less likely that queues are filled up. Increasing the bulk queue size is only likely to postpone the problems, and may actually make them worse.
Also remember that rejected requests do not always mean that all documents were unsuccessful. Make sure you inspect the full response and retry the appropriate documents. Logstash and Beats already do this by default.
We hope this has given you a better understand of how it works. If you have any further questions, there are many ways to engage with us, including through our forum.