How Elastic Maps can be used to track the devastating eruption of a volcano, or any natural event


 Share on Twitter
Share on Twitter

 Share on LinkedIn
Share on LinkedIn

 Share on Facebook
Share on Facebook

 Share by Email
Share by Email

 Print this page
Print
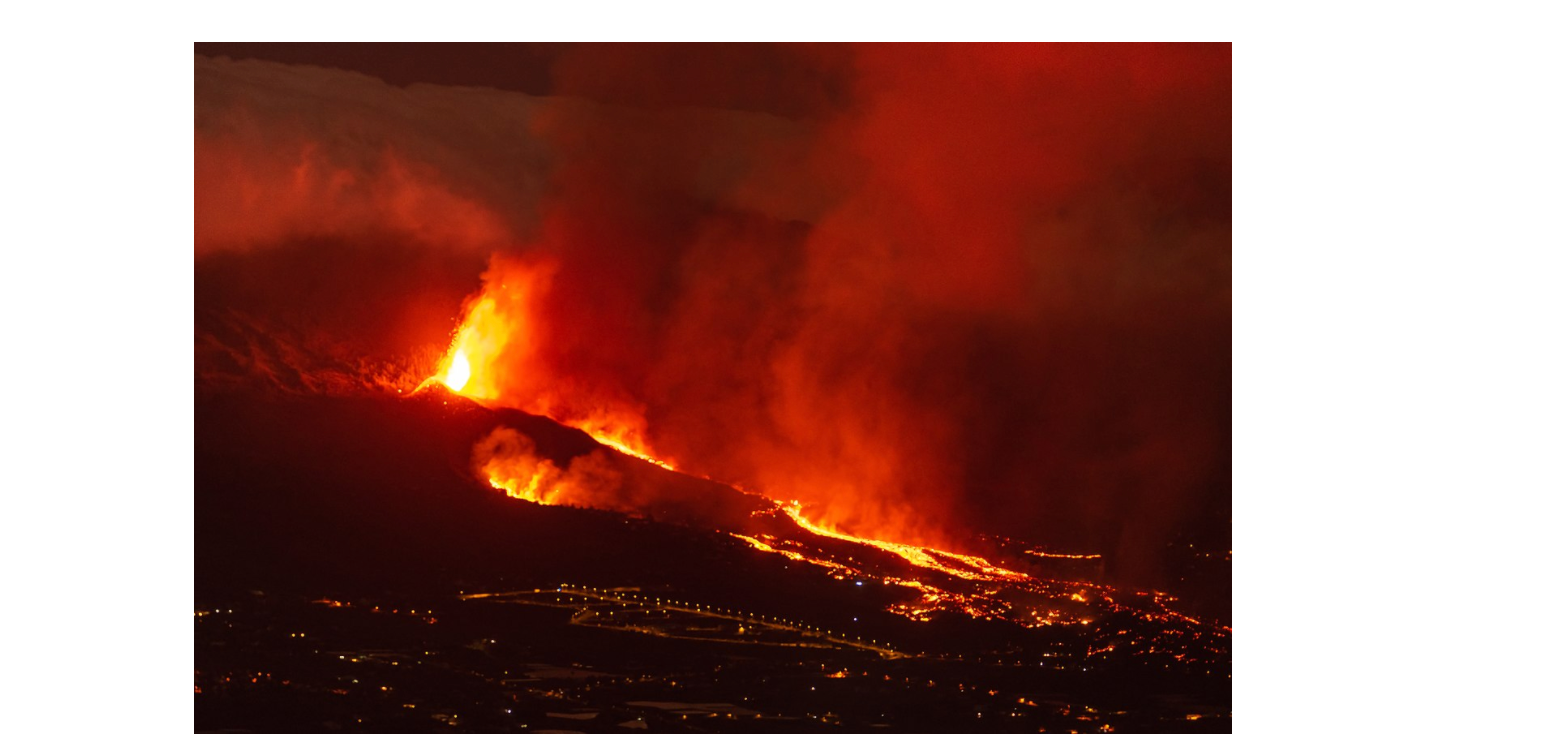
It began with an earthquake swarm. More than 22,000 seismic events were recorded, at up to 3.5 on the Richter scale, beginning on September 11th, 2021. Just 8 days later, the first eruption on La Palma since 1971, and the largest in recorded history, commenced. For three months, lava ran out of the Cumbre Vieja volcano, pouring into the Atlantic Ocean surrounding the Canary Islands.
The eruption destroyed more than 3,000 homes in a torrent of fire and liquid rock and caused untold impact on the islands’ fragile ecosystem and economy. Mercifully, only one death has been linked to this devastating event.
To track the path of destruction so that experts could raise awareness of the ongoing impact of the geothermal event, employees at Elastic used Elastic Maps’ time slider feature, which was introduced in Kibana 7.14. The feature allows users to animate datasets and create visualizations to show change over time.
This post will examine how Elastic Maps was leveraged to understand the effect of the Cumbre Vieja eruption. We will also show how Elastic Maps features like imagery layers played a role in the storytelling of this historic natural event.
The Cumbre Vieja eruption
Before getting into the technical aspects of this post, let's begin with the human element. On September 19th, 2021, the Cumbre Vieja volcano woke up and started spitting lava and toxic gas. The area affected by the eruption is over 2,500 acres. The eruption displaced more than 8 thousand people from their homes and decimated crucial farmland on La Palma island, home to over 85,000 people.
Information is critical in natural disasters to plan the appropriate response. The Canary Islands government, the Spanish National Mapping Agency (IGN), and other administrations have gone above and beyond to provide accurate and real-time data. This data is helping to relocate families, fix basic land facilities like roads and irrigation systems, and much more.
Gathering the data into the Elastic Stack
New drone surveys of the lava footprints were carried out daily and published in the La Palma Open Data portal as individual polygon entries (example from 2021-11-17). On this portal, there's also a large dataset with all the buildings on the island. They also have a website with seismic information. Anyone can export a CSV file with earthquake activity between a date range and a box defined by latitude and longitude ranges.Uploading all this data to an Elastic cluster is a combination of an automated process using the Elasticsearch Python client and the Elastic Maps GeoJSON upload. We use the Python SDK for real-time data and Elastic Maps for static datasets.
Setting up the map and time slider
With this data, anyone using Elastic can design a map and the dashboard that will contain it. The map includes the seismic and lava data, and leverages Elastic Maps’ capabilities to render alternative basemaps. A volcano eruption is one of the few natural disasters that can quickly alter the landscape of large geographic areas. With current drone technology it is possible to gather, process, and publish highly detailed imagery surveys in hours in order to stay up to date on changes made to landscapes post-eruption in almost real-time.
La Palma Open Data portal publishes these imagery surveys. We can add to our map the initial state of the land and subsequent layers with the evolution of the lava footprints as they cover the area between the Cumbre Vieja volcano and the west shoreline of the island.
We can add the volcano craters to locate the origin of the event and the Earthquakes dataset. Elastic Maps’ data-driven rendering allows representing Earthquakes by magnitude. We can easily discern two sets of events based on their magnitude directly related to the eruption start. We see many events of low magnitude and depth near the craters.
This group of events is supposed to be related to the magma's ascent from the Earth's mantle through the crust. As the magma starts flowing from the volcano, this group of quakes stop, and a new series of more significant earthquakes start rising from the southeast of the island. The best way to see this evolution is, of course, using a time slider.
We can improve this visualization by adding a runtime field to the Index Pattern with a single constant. This constant enables the data to load again using the Top Hits per Entity layer type. Now we will only see the last footprint of our time filter, which makes the time slider easier to visually comprehend by only showing one polygon at a time.
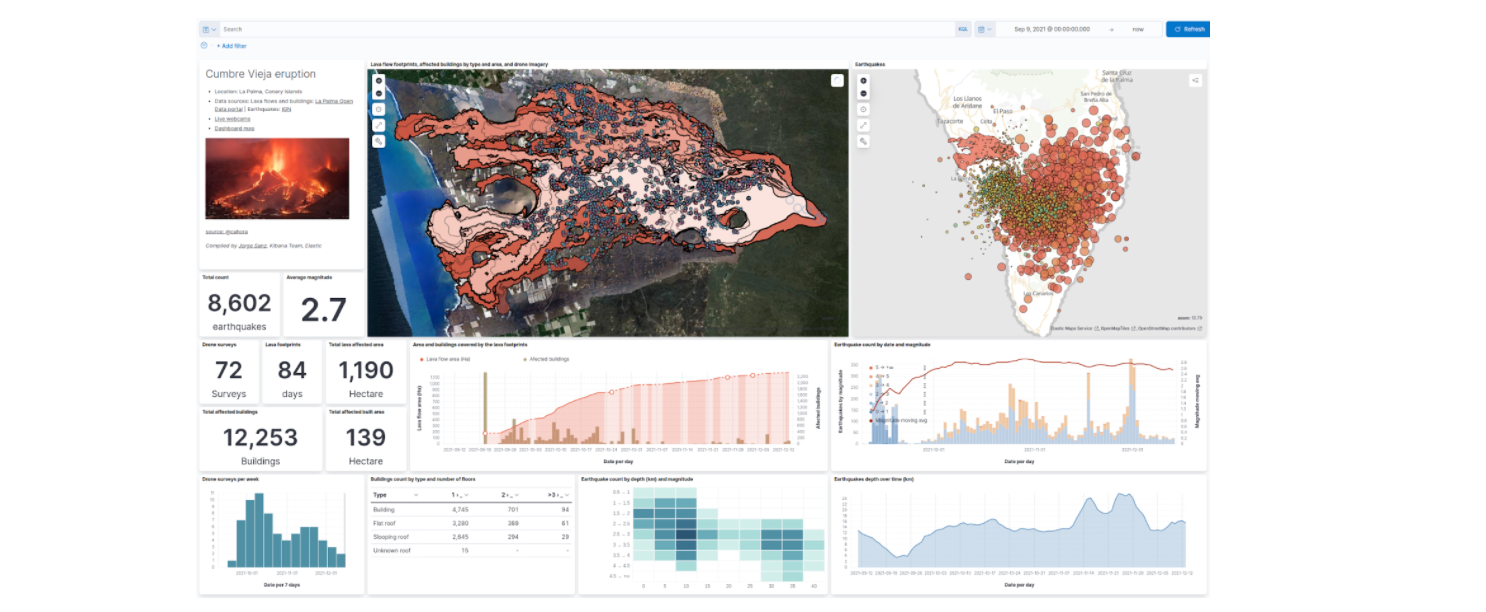
Finally, we can put all this data in a dashboard to explore all the data at once with ease.
Kibana offers a broad range of visualizations, not only maps, to explore this natural disaster. We can understand how the development of the lava flow covers the land, the number of buildings affected, and the magnitude and depth of earthquakes as a proxy to estimate the end of the eruption.
Elastic Maps’ time slider is an excellent tool to visualize dynamic geospatial events. As unfortunate as this natural disaster has been, learning about it through data using Elastic Maps and Kibana to explore time and space can give authorities and experts crucial insights that can help them prepare for and even predict how future events might impact people, land, and the economy..
If you want to explore the dashboard and the map yourself, feel free to access https://ela.st/cumbre-vieja-eruption and https://ela.st/cumbre-vieja-eruption-map and explore the visualizations yourself.
Finally, if you’re ready to begin crafting similar maps and dashboards, create an Elastic Cloud trial account, download a zip file with the footprints and the earthquakes as GeoJSON files, and give them a spin.
Share
- Share on Twitter
Share on Twitter
- Share on LinkedIn
Share on LinkedIn
- Share on Facebook
Share on Facebook
- Share by Email
Share by Email
- Print this page
Print