Tracking Down Native Memory Leaks in Elasticsearch
We've spent a lot of time lately tracking down various memory issues in the Elastic Cloud service. One in particular hit small clusters with relatively little activity and needed quite a bit of digging to figure out. The following applies to version 5.1.1 of the Elastic Stack, and has been fixed in newer versions.
Each node gets a set amount of memory and we reserve about half of that for heap. The rest is used by the JVM and file caches. Normally the memory used by the JVM is constant, but we saw some instances where the total memory used by Elasticsearch kept slowly increasing without bounds until it hit the total limit. Sometimes it took days, but it was constantly climbing. When reaching the limit, the node runs out of memory and is rebooted.
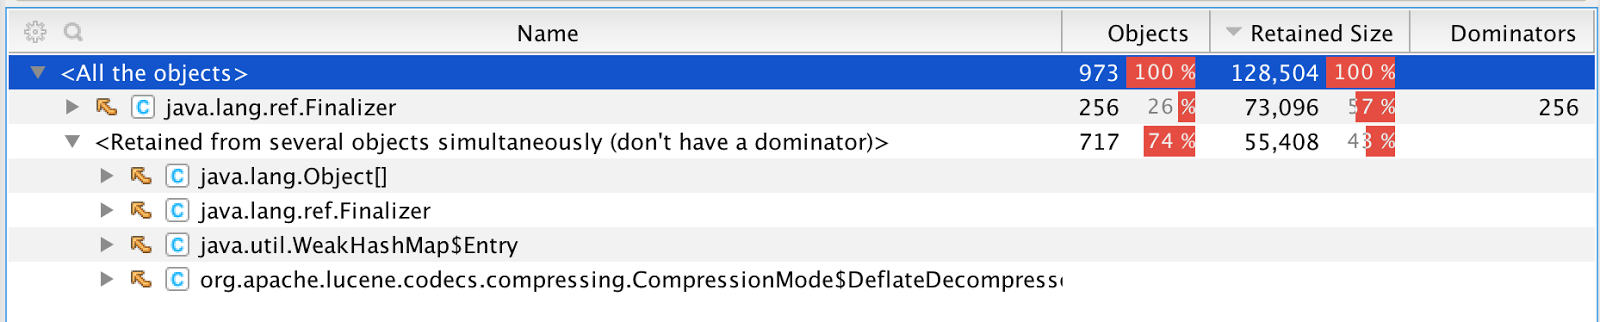
So that's a pretty clear sign of a memory leak. We analysed Elasticsearch with tools like Yourkit, MAT, etc., but we couldn't find anything in the heap that would explain this, but the RSS (resident set size) memory of the Elasticsearch process was increasing and increasing. We tried turning on Native Memory Tracking and saw that the memory increase was not in the heap at all.
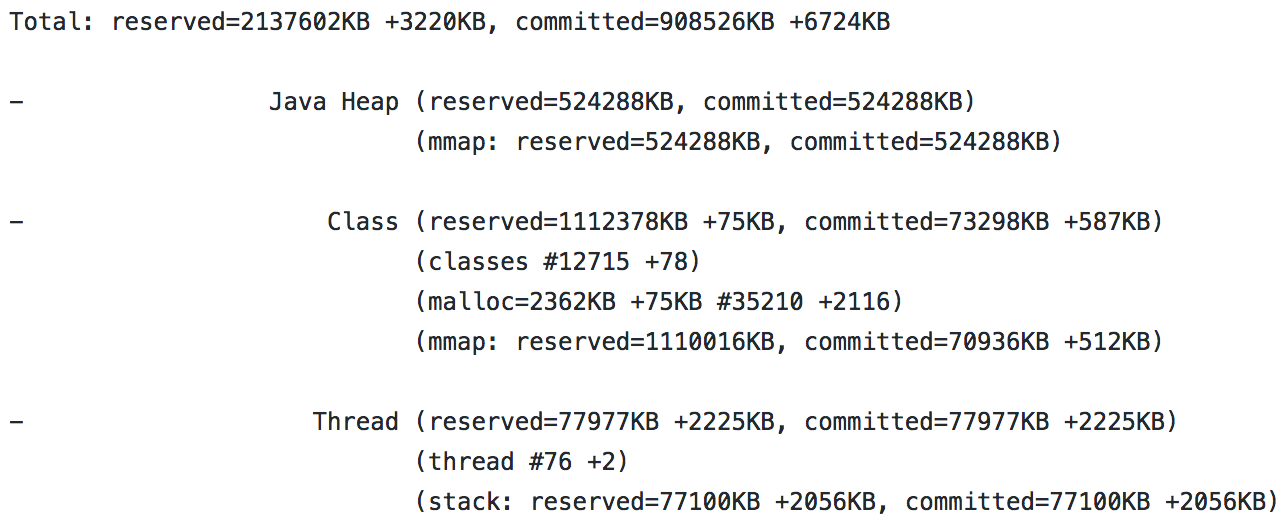
Native Memory Tracking (NMT) is a feature in the JVM which provides a way to look into the memory usage inside the JVM. It tracks all memory allocations, and groups it by usage. This provides both an overview of where memory goes and also details to where allocations happen.
A report from NMT looks like this:
However, even after analyzing the Elasticsearch process over a long time with NMT, the memory usage as measured by the OS was increasing a lot faster than NMT reported. This showed that the memory leak was outside of the JVM's tracking capabilities. We have a native memory leak!
Enter tools to track down native memory allocations. Fortunately someone has described one way to do that with jemalloc.
Here are the steps I followed to run it with Elasticsearch:
git clone https://github.com/jemalloc/jemalloc
cd jemalloc ./autoconf.sh --enable-perf
make dist
make
sudo make install
Then I added these env variables before starting Elasticsearch:
export LD_PRELOAD=/usr/local/lib/libjemalloc.so
export MALLOC_CONF=prof:true,lg_prof_interval:30,lg_prof_sample:17,prof_final:true
I was running version 5.1.1 of Elasticsearch with X-Pack, which exhibited the memory leak, and I also enabled X-Pack monitoring features just to get some light indexing going. Then I ran it overnight, because we've seen that this leak happens slowly.
Afterwards, the following output was generated with:
jeprof --show_bytes --gif /usr/lib/jvm/java-8-oracle/jre/bin/java jeprof*.heap > /tmp/app-profiling.gif
The output looked like this (scroll to the bottom):
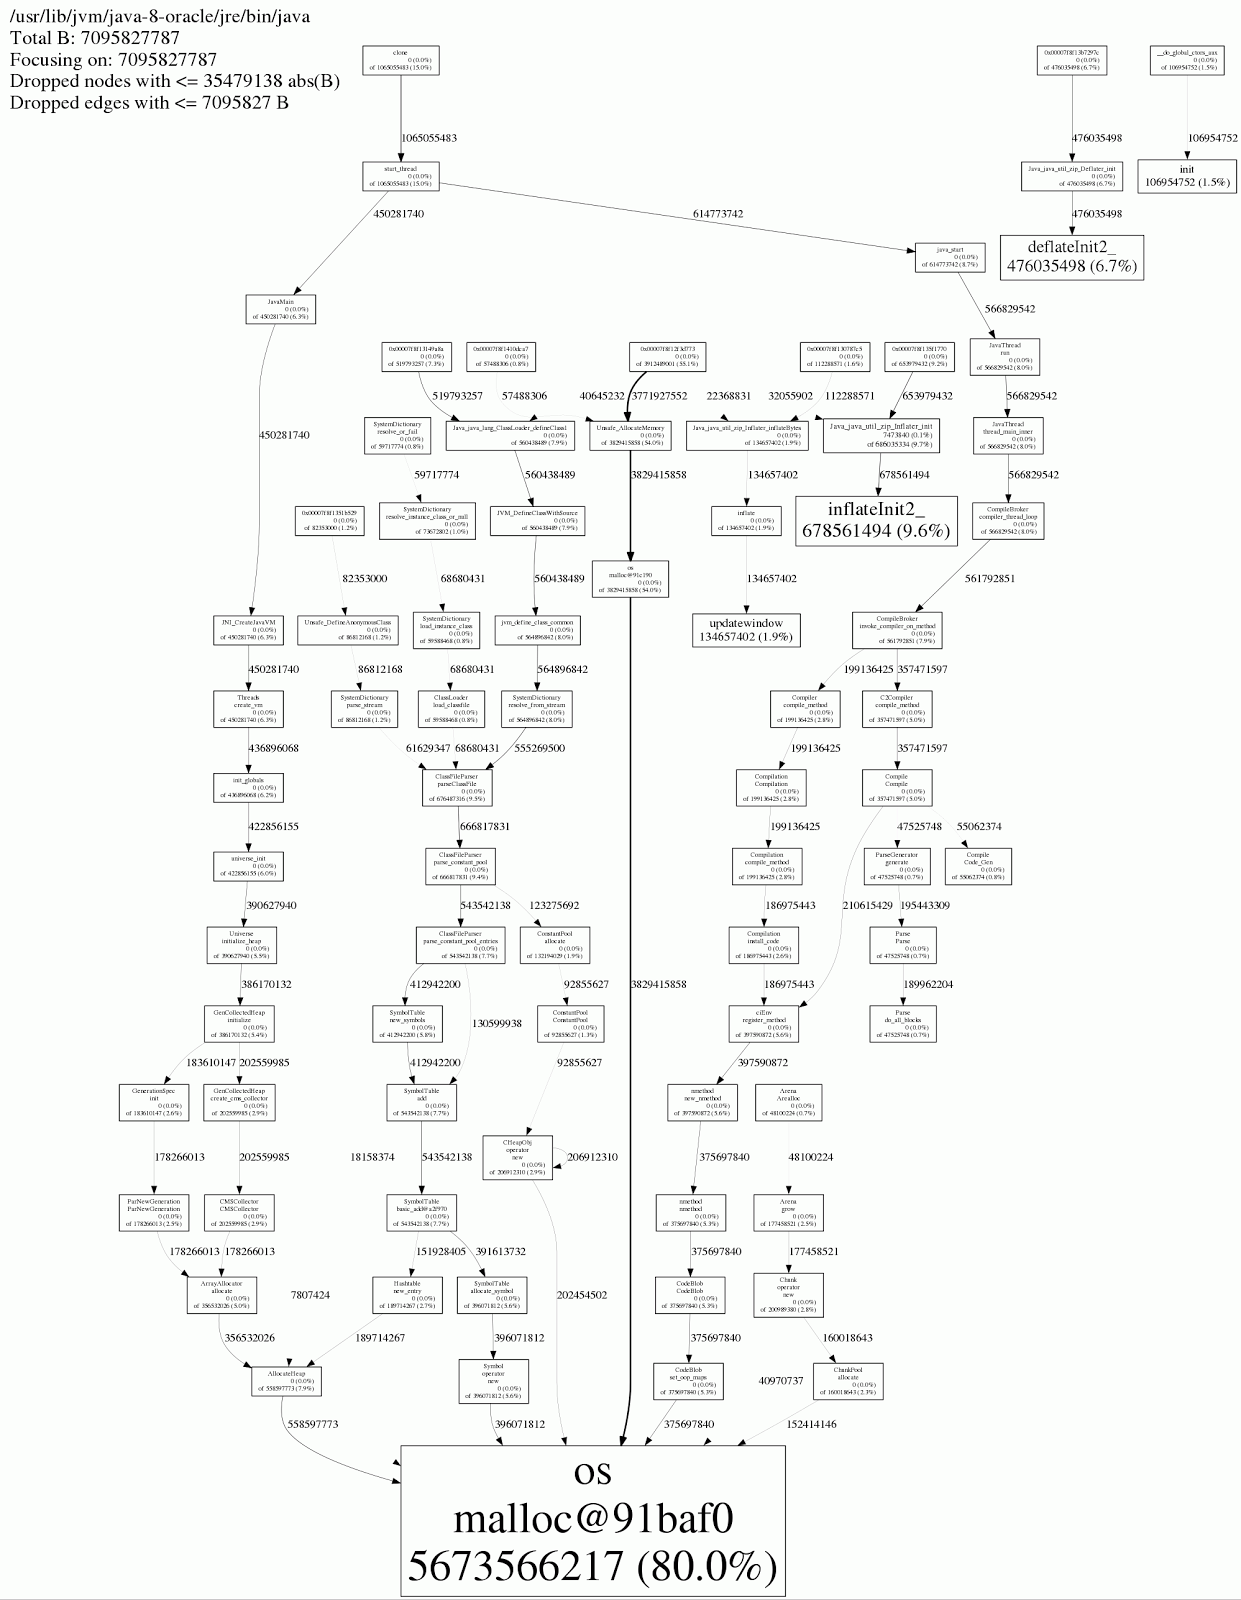
On the bottom it says that only 80% of the memory is actually referenced by the JVM, so somehow we “lost” 20%. This is after running for 24 hours. When I started the process this was 97%, so the loss kept growing.
In the details, you can see which method allocated memory. The biggest offenders seemed to be java.util.zip.Inflater and java.util.zip.Deflater which accounted for 18.2% of the "missing" memory.
Inflater and Deflater are implemented using native functions, which allocates memory for buffers. If you forget to call end() on them, the memory is never freed. However, it implements a finalizer, which is supposed to run end() for you if you forget. But finalizers are only called on full garbage collection, and when all references are gone. Clusters with light usage almost never do Full GC, so in practice they never got cleaned up.
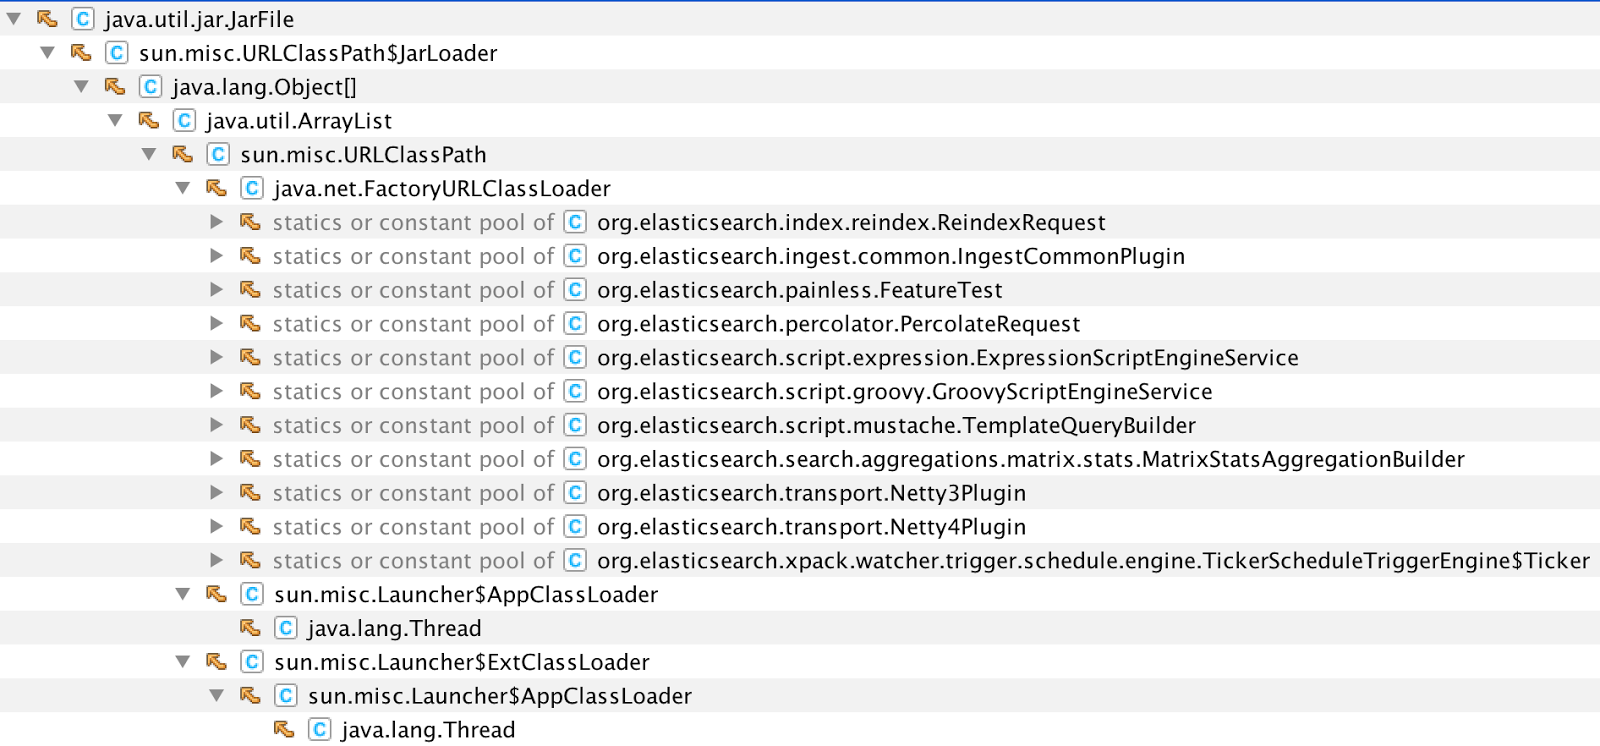
We went through our usages of Inflater and Deflater using Yourkit and found some places that could potentially be forgetting to close them:
Not all of those are actual leaks, they could still be in use, but we investigated them. This investigation lead to various fixes in both Lucene and Elasticsearch:
https://issues.apache.org/jira/browse/LUCENE-7647
https://github.com/elastic/elasticsearch/pull/22711
And one issue in X-Pack watcher.
These fixes were released in Elastic Stack version 5.2.1.
To verify that we had caught all cases, we made a small tool that records when we allocate an Inflater, and when we call end() on it. It is implemented as an agent which instruments the Inflater class. We ran the tool on Elasticsearch 5.1.1, and it showed exactly the places that needed to be fixed, and with 5.2.1 it showed none of them (except a few that are expected due to jar caching).
We've seen that when normal memory profiling tools fail to identify a memory issue, it might be outside of the JVM. When this is the case, we need to peek inside it. And since the JVM is just an "ordinary" C++ program, we can use well known tools and techniques for profiling it.