Practical CPU time performance tuning for security software: Part 1
“Wasting other people’s time is tantamount to robbery and murder, and wasting one’s own time is tantamount to chronic suicide.” - Lu Xun
Software performance issues come in all shapes and sizes. Therefore, performance tuning includes many aspects and subareas, and has to adopt a broad range of methodologies and techniques. Despite all this, time is one of the most critical measurements of software performance.
In this multi-part series, I’ll focus on a few of the time-related aspects of software performance — particularly for security software. Each post in this series will focus on a single topic, including how to identify performance issues, how to fix them, and how to avoid them in future.
%CPU
Let’s start by diving into a high %CPU usage example on macOS. I wrote a demo program called checkCSInfoObserveCPU to demonstrate how system API may introduce unexpected performance overhead. The source code can be downloaded here. While the sample program only runs on macOS, the general approach we’ll cover here is common for all operating systems.
Monitor CPU
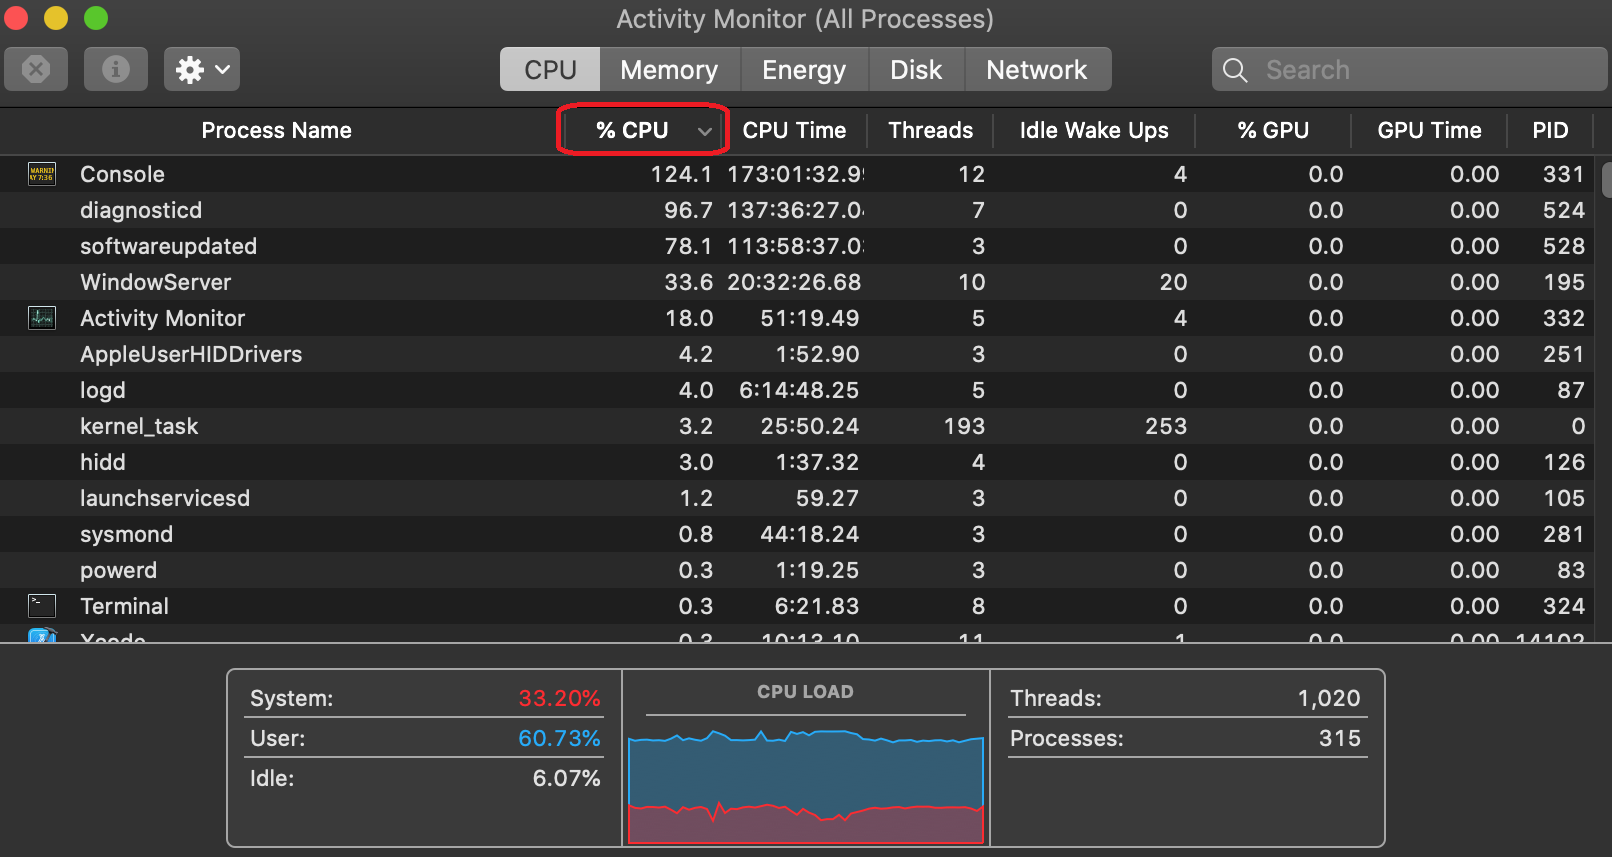
First, you’ll need a tool to monitor %CPU usage. There are many choices for such tools. My favorite tool on macOS is Activity Monitor, because it comes with each macOS installation and has a nice graphic interface. top is also a popular tool — available both on macOS and Linux — and can be used for %CPU monitoring. On Windows, Windows Task Manager is a good choice for such tasks.
The following picture shows the Activity Monitor. Note the area enclosed with a red circle. Select that dropdown in descending order so that the %CPU column is ordered from highest to lowest.
Next, I compile my sample program, checkCSInfoObserveCPU, from source code into binary(debug build by default). I double click it to run while closely monitoring the changes shown by Activity Monitor.
Note: Make sure the Console program is not running on your macOS. This is to eliminate the impact of logging on the running speed of your program.
Soon after the program was launched, %CPU usage of checkCSInfoObserveCPU jumped over 300% on my test machine. The program ran for about two minutes, and its %CPU was pegged between 100-600% until the program exited.
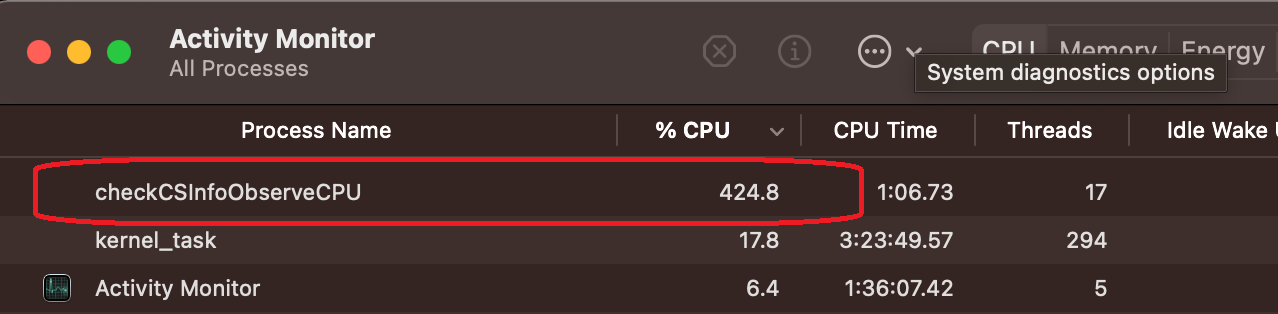
Depending on the hardware spec, if you run the same program on different machines, you may get a different %CPU range. For example, on my physical MacBook Pro with eight cores, the program costs 100-600% CPU. But on my virtual machine with four cores, the same program costs 100~200% CPU and takes a longer time to finish. Generally speaking, if the program consistently costs more than 100% CPU for a prolonged period of time, it’s a sign that the program isn’t optimized.
Find the hot spot
Now that we’ve established that the program checkCSInfoObserveCPU is consuming abnormally high %CPU, we’ll want to find out why and understand which part of the code is causing it (aka find the bottleneck, or hot spot).
macOS provides a profiling tool called spindump, which is perfect for this job. It profiles the entire system during a time interval (10 seconds by default), so you can analyze the execution of your program during that interval and identify the hot spots in your program. The spindump needs to be run while the high CPU is happening so it can capture the smoking gun. For detailed information about spindump, please run “man spindump” in Terminal. Apple also provides an article that shows how to invoke spindump from Activity Monitor.
I’ve collected the spindump output while my sample program was running as an example. In the output, we can find a list of threads that were running inside of checkCSInfoObserveCPU when the spindump was taken. It also shows lots of useful information, such as the threads’ CPU time and their callstacks. The top two most CPU-consuming call stacks inside of the program are:
  Thread 0x849d4f    DispatchQueue "com.apple.main-thread"(1)    1001 samples (1-1001)    priority 31-46 (base 31)    cpu time 7.782s (18.1G cycles, 28.8G instructions, 0.63c/i)
  1001  start + 1 (libdyld.dylib + 89917) [0x7fff2044df3d]
    1001  main + 122 (main.m:27,9 in checkCSInfoObserveCPU + 15498) [0x10308ac8a]
      1001  -[checkStaticCSInfo checkStaticCSInfoOnPath:withRequirement:] + 427 (checkStaticCSInfo.m:65,14 in checkCSInfoObserveCPU + 14811) [0x10308a9db]
        1001  SecStaticCodeCheckValidityWithErrors + 187 (Security + 1673198) [0x7fff224517ee]
          1001  Security::CodeSigning::SecStaticCode::staticValidate(unsigned int, Security::CodeSigning::SecRequirement const*) + 2714 (Security + 1716598) [0x7fff2245c176]
  Thread 0x849d7e,0x849dfe,0x849e39,0x849eef,0x849ef7,0x849ef9,0x84a00d,0x84a00e,0x84a1b0,0x84a1b2,0x84a1b3,0x84a1b1,0x849ffc,0x84a1be,0x84a1b4,0x84a1af    DispatchQueue "com.apple.root.default-qos"(10)    3062 samples (1-1001)    priority 31-46 (base 31)    cpu time 19.152s (45.1G cycles, 49.4G instructions, 0.91c/i)
  3062  start_wqthread + 15 (libsystem_pthread.dylib + 9363) [0x7fff2042e493]
    3062  _pthread_wqthread + 244 (libsystem_pthread.dylib + 13434) [0x7fff2042f47a]
      3062  _dispatch_worker_thread2 + 92 (libdispatch.dylib + 77648) [0x7fff20297f50]
        3062  _dispatch_root_queue_drain + 326 (libdispatch.dylib + 75768) [0x7fff202977f8]
          3056  _dispatch_queue_override_invoke + 1035 (libdispatch.dylib + 24347) [0x7fff2028af1b]
            3054  _dispatch_client_callout + 8 (libdispatch.dylib + 14310) [0x7fff202887e6]
              3039  _dispatch_call_block_and_release + 12 (libdispatch.dylib + 9731) [0x7fff20287603]
                3035  invocation function for block in Security::Dispatch::ExceptionAwareEnqueuing::enqueueWithDispatcher(void (void () block_pointer) block_pointer, void () block_pointer) + 30 (Security + 2802612) [0x7fff225653b4]
                  3032  invocation function for block in Security::CodeSigning::LimitedAsync::perform(Security::Dispatch::Group&, void () block_pointer) + 36 (Security + 1772422) [0x7fff22469b86]
                    3002  invocation function for block in Security::CodeSigning::SecStaticCode::validateResources(unsigned int) + 612 (Security + 1704213) [0x7fff22459115]
                      2223  Security::CodeSigning::SecStaticCode::validateResource(__CFDictionary const*, std::__1::basic_string<char, std::__1::char_traits<char>, std::__1::allocator<char> >, bool, Security::CodeSigning::SecStaticCode::ValidationContext&, unsigned int, unsigned int) + 4319 (Security + 1708977) [0x7fff2245a3b1]
                        2175  Security::CodeSigning::CodeDirectory::multipleHashFileData(Security::UnixPlusPlus::FileDesc, unsigned long, std::__1::set<unsigned int, std::__1::less<unsigned int>, std::__1::allocator<unsigned int> >, void (unsigned int, Security::DynamicHash*) block_pointer) + 626 (Security + 1762824) [0x7fff22467608]
                          1448  Security::CodeSigning::scanFileData(Security::UnixPlusPlus::FileDesc, unsigned long, void (void const*, unsigned long) block_pointer) + 160 (Security + 1761985) [0x7fff224672c1]
                            1433  read + 10 (libsystem_kernel.dylib + 7486) [0x7fff203fdd3e]
In the first call stack, we find that the program checkCSInfoObserveCPU stepped into Apple’s security framework function SecStaticCodeCheckValidityWithErrors and never stepped out during the whole sampling time period. Now it’s time to go back to the source code and confirm our findings. The source code shows that the program does indeed call SecStaticCodeCheckValidityWithErrors once to check up on the code object of Xcode.
However, in the source code, the program doesn’t call any of the functions shown in the second stack. It also doesn’t create threads shown in the second call stack. So then where do the threads come from? In fact, they are helper threads created by the security framework in serving the request from SecStaticCodeCheckValidityWithErrors. That’s why even though in the source code we didn’t explicitly start any helper threads, we still found multiple threads within the running program, and they made the CPU even busier.
Now we find the function SecStaticCodeCheckValidityWithErrors is the culprit here. SecStaticCodeCheckValidityWithErrors is a system library function implemented by Apple. Does it mean the function implementation is bad and we should report a bug to Apple? Not in this case. Validating code signature is a computing-intensive task — especially when the target to validate is a large bundle such as Xcode, high CPU consumption is expected.
Fixing high %CPU
Fixing your high %CPU usage will vary depending on the specific issue, the function of your product, and many other factors. Our sample here is used to demonstrate that calling SecStaticCodeCheckValidityWithErrors on a large bundle is CPU-intensive. However, SecStaticCodeCheckValidity* is a very convenient API — security software often needs to call this API to collect signature information of other programs. If you cannot avoid using such APIs, it’s best to be really careful choosing the circumstances where it is used. Generally speaking, using it on small bundles is still affordable.
For this particular sample, we could easily fix the high %CPU usage by changing one line of code here, as shown below:
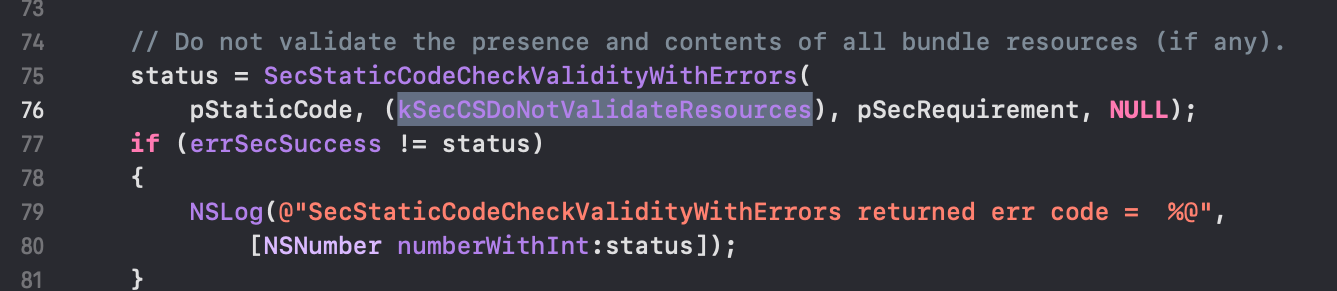
This fix changes the input parameter SecCSFlags from kSecCSDefaultFlags to kSecCSDoNotValidateResources, which tells the API to not validate the presence and contents of all bundle resources (if any). After this change, the sample program checkCSInfoObserveCPU finished instantly without consuming significant %CPU and other resources.
However, in this fix, the API caller sacrificed the overall bundle security in exchange for less %CPU consumption. Therefore, when fixing performance issues, nothing comes free. We should carefully evaluate all kinds of tradeoffs and choose the fix that best suits our needs.
Wrapping up
In the next post of this series, we’ll discuss another time-related performance topic that's more unique to security software. Stay tuned.
In the meantime, you can install the latest version of Elastic Security on Elastic Cloud, and be sure to take advantage of our quick start training to set yourself up for success.