Monitoring Java Applications with Metricbeat and Jolokia
The Java Virtual Machine (JVM) features a complete framework for operational management and monitoring. In this post we will see what JMX (Java Management eXtensions) is, how to explore the information it exposes and how to take advantage of it with Jolokia and the Elastic Stack. If you know about JMX and Jolokia, you can skip the first part and go directly to learn more about related Metricbeat features.
JMX and JConsole
JMX is a technology that defines a complete architecture and a set of design patterns to monitor and manage Java applications. It is based on managed beans, better known as MBeans, classes that are instantiated by dependency injection that represent resources in a JVM. These representations can be used to manage certain aspects of the application or, more frequently, to collect statistics about the use of these resources. In the core of JMX is the MBean Server, an element that acts as an intermediary between the MBeans, the applications in the same JVM, and the outer world. Any interaction with the MBeans is done through this server. In general, only Java code can directly access the JMX API, but there are adaptors that translate this API to standard protocols, for example Jolokia translates it to HTTP.
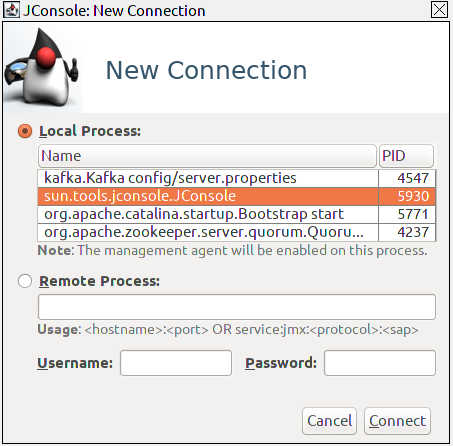
A useful tool to work with JMX is JConsole, which is included in the usual distributions of the Java Runtime. When you open it, it welcomes you with the list of Java processes running in your machine. If you don’t have any, you see at least JConsole itself.
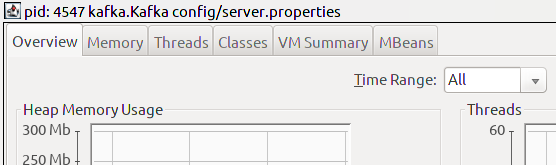
When connecting to any of these processes, a window opens with different tabs with generic monitoring information about different aspects of the processes like memory or threads. There is also a tab with an MBeans browser.
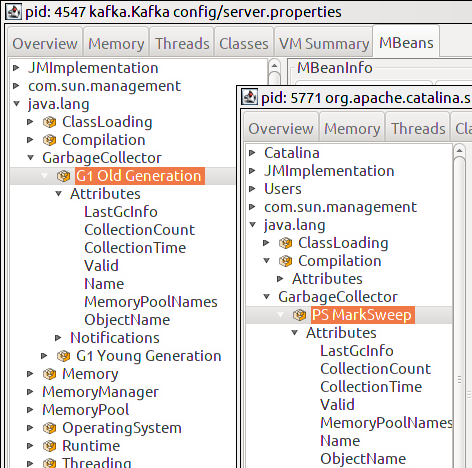
In the browser, you can find the list of MBeans of the process grouped by namespaces. Some of them, like the ones under java.lang namespace, can be found on any JVM, while others are specific to the application. For each MBean, you can see different categories for attributes, operations and notifications. For monitoring, we will focus on attributes. There are some MBeans that despite being different, they implement the same interface. For example, it is common to find that different applications like Tomcat or Kafka use different garbage collectors depending on the use case, but in JMX they are objects of the same type, only with different names.
Being able to discover all this information is really nice, but when monitoring infrastructure something like JConsole is not usually available. Additionally, you may also need to aggregate information from different processes that may be in different servers. Fortunately, this can be handled by Metricbeat and Jolokia.
Collecting JMX metrics with Metricbeat and Jolokia
Metricbeat can collect information from different servers, ship it to Elasticsearch, and from there it can be visualized in a variety of ways with Kibana. But as we have seen before, JMX can only be consumed with Java applications, there is when Jolokia enters into the game. Jolokia is an agent that can be deployed on JVMs to expose their MBeans through a REST-like HTTP endpoint, making all this information easily available to non-Java applications running on the same host. It can be deployed as a normal JVM agent, as a WAR for Java EE environments, or as OSGI or Mule agents.
To deploy Jolokia as an agent, the -javaagent flag has to be used when launching the Java application. When using the java command directly, it can be passed as an argument, but some applications can have their own startup scripts and may advise different ways to do it in their documentation. For example, when using Kafka with its own startup scripts, you may need to make use of the KAFKA_OPTS environment variable:
export KAFKA_OPTS=-javaagent:/opt/jolokia-jvm-1.5.0-agent.jar=port=8778,host=localhost
./bin/kafka-server-start.sh ./config/server.properties
To deploy Jolokia as a WAR, the agent has to be installed in the Java EE server. For example, in Tomcat this is done by copying the WAR file to its webapps directory. For each application, it is recommended to check their documentation for the best way to run Java agents. It is also recommended to look at Jolokia documentation to see what agents are available and what their options are. For cases where it is not possible to deploy Jolokia in the same JVM, Jolokia also has a proxy mode that can be used to query JMX from another JVM.
Once the Jolokia agent is running in the JVM of an application, it is pretty straight-forward to collect JMX metrics with Metricbeat using the JMX metricset of the Jolokia module introduced in Metricbeat 5.4. This module has to be configured with the host and port of the Jolokia agent and a set of mappings between JMX metrics and Metricbeat event fields. Let’s see it with an example.
Example: Monitoring a Java application with Metricbeat and Jolokia
Suppose that we have Jolokia listening on localhost, port 8778, as would be the case with the previous example with Kafka. We can use JConsole to look for the MBeans and attributes that we want to monitor. By selecting the MBean, we can see its name, which we can copy directly to the configuration file.
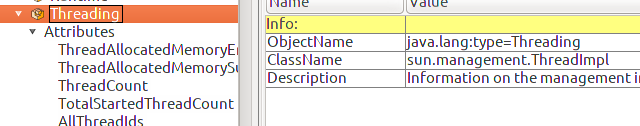
For this example, we are going to monitor the number of threads from the java.lang:type=Threading MBean and heap memory usage from java.lang:type=Memory. The configuration would be like this:
- module: jolokia
  metricsets: ["jmx"]
  hosts: ["localhost:8778"]
  period: 10s
  namespace: "jvm"
  jmx.mappings:
  - mbean: "java.lang:type=Memory"
    attributes:
    - attr: "HeapMemoryUsage"
        field: "memory.heap"
    - attr: "NonHeapMemoryUsage"
        field: "memory.nonheap"
  - mbean: "java.lang:type=Threading"
    attributes:
    - attr: "ThreadCount"
        field: "thread.count"
    - attr: "DaemonThreadCount"
        field: "thread.daemon"
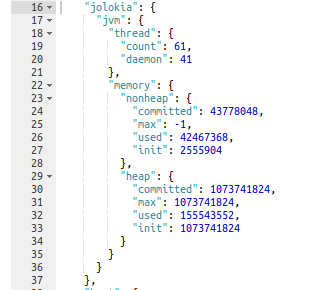
Metricbeat collects the information periodically and ships the events with the four values. You may have noticed in JConsole that memory usage attributes are not plain values like the thread counts, they are objects that contain four fields each. Metricbeat takes care of restructuring the data in the event, so at the end it contains ten fields under the jolokia.jvm namespace:
More advanced configurations
You may want to have your fields in different events. Starting with Metricbeat 6.3, JMX mappings can also define how fields must be grouped using the event setting. Two events with the same value will be grouped together. For example the following configuration would generate two different events, one for memory fields, and another one for thread fields:
  jmx.mappings:
  - mbean: "java.lang:type=Memory"
    attributes:
    - attr: "HeapMemoryUsage"
        field: "memory.heap"
        event: "memory"
    - attr: "NonHeapMemoryUsage"
        field: "memory.nonheap"
        event: "memory"
  - mbean: "java.lang:type=Threading"
    attributes:
    - attr: "ThreadCount"
      field: "thread.count"
      event: "threads"
    - attr: "DaemonThreadCount"
      field: "thread.daemon"
      event: "threads"
Another new feature introduced in version 6.3 is the support of wildcards, this allows us to use a single mapping for multiple MBeans, which is useful when an application contains several instances of the same type, or when the specific name is unknown beforehand. For example, Tomcat has multiple thread pools, we could extend our previous mappings with an additional configuration to obtain also the number of threads and connections per pool:
  - mbean: "Catalina:name=*,type=ThreadPool"
    attributes:
    - attr: "currentThreadCount"
      field: "thread.count"
    - attr: "maxThreads"
      field: "thread.max"
    - attr: "connectionCount"
      field: "connection.count"
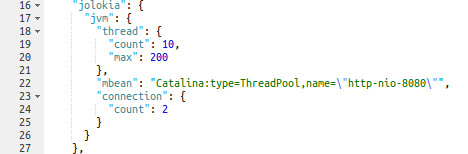
With this configuration, a new event is shipped for each matching mbean, containing the name of the mbean as a new field:
To complete the Jolokia support, in Metricbeat 6.4 we will add proxy mode thanks to a contribution from the community, and also an implementation of Jolokia Discovery, which will allow monitoring Java applications in more dynamic environments.
Jolokia Discovery is a technology based on UDP multicast that allows Jolokia agents to announce their endpoints along with some additional information about the service they are attached to. Our implementation is powered by the autodiscover framework that we already use for Kubernetes and Docker, and brings full featured dynamic configuration based on templates. If we wanted to take advantage of Jolokia Discovery for the previous examples, we could do something like this (reduced to collect only thread count):
metricbeat.autodiscover:
  providers:
  - type: jolokia
    templates:
    - condition:
        contains:
          jolokia.agent.version: "1.5.0"
      config:
      - module: "jolokia"
        metricsets: ["jmx"]
        hosts: ["${data.jolokia.url}"]
        namespace: "jvm"
        jmx.mappings:
        - mbean: "java.lang:type=Threading"
          attributes:
          - attr: "ThreadCount"
            field: "thread.count"
    - condition:
        contains:
          jolokia.server.product: "tomcat"
      config:
      - module: "jolokia"
        metricsets: ["jmx"]
        hosts: ["${data.jolokia.url}"]
        namespace: "jvm"
        jmx.mappings:
        - mbean: "Catalina:name=*,type=ThreadPool"
          attributes:
          - attr: "currentThreadCount"
            field: "thread.count"
This configuration consists of two templates, one of them will be applied to all discovered Jolokia instances, and the second one will only be applied to Tomcat instances. Notice how the configurations in the templates are mostly the same as before, but using a variable for the host.
Even though this feature has been created to be used with the JMX metricset, it is open to any other creative use with other modules, or even with filebeat. If you want to know more, please take a look at the Jolokia module and autodiscover documentation, or ask us any question on Discuss.