Indexing your CSV files with Elasticsearch Ingest Node
The idea of this article is to go over the capabilities of some of the features of Ingest node, which will be combined to parse a Comma Separated Value (CSV) file. We will go over what is an Ingest Node, what type of operations one can perform, and show a specific example starting from scratch to parse and display CSV data using the Elasticsearch and Kibana.
For that we will use an open catalog of community issues from New York, NY. This CSV file was updated in October 2015 and It consists of 32 fields which draws the complete railway station entrances and exits lists. The goal will be to use the Ingest feature of Elasticsearch in a cluster on Elastic Cloud to parse the data into a structured json, index the data, and use Kibana to build a Map of New York City that includes all this railway stations.
We will use the Ingest feature from Elasticsearch instead of Logstash as a way to remove the need of extra software/architecture setup for a simple problem that can be solved just with Elasticsearch.
With all this in place, we will be able to visualize the data and answer some questions such as “Where can we find a station with Elevators?”, “Where are most of the Stations located?”, “Which is the most dense area?” among others. Our data will come from a text file, and will turn into insights.
Cluster Setup
To start, we are going to use a small Elastic Cloud cluster with 2GB of Memory and 48GB of Disk. We will download the CSV file with this data from the Export to CSV feature included in the following website: https://data.ny.gov/NYC-Transit-Subway.
We will use a Linux script that is composed with a simple loop to iterate through the CSV lines and send it to our cluster on Elastic Cloud. Elastic Cloud will give us an endpoint for our Elasticsearch instance. In addition to this, we need to enable Kibana to use the Developer tools and also to build the Dashboard.
In order to be able to parse the file, we need to replace all double quotes with single quotes and delete the first line of the file (header) before processing it. This can be done with your prefered tool. Each entry should look like (please note the single quotes):
BMT,4 Avenue,25th St,40.660397,-73.998091,R,,,,,,,,,,,Stair,YES,,YES,FULL,,FALSE,,FALSE,4th Ave,25th St,SE,40.660323,-73.997952,'(40.660397, -73.998091)','(40.660323, -73.997952)'
Parsing to json
In order to be able to search and build dashboards, we need to parse the plain text into a structured json. For this, we will send the data to elasticsearch using the following script:
while read f1
do
   curl -XPOST 'https://XXXXXXX.us-east-1.aws.found.io:9243/subway_info_v1/station' -H "Content-Type: application/json" -u elastic:XXXX -d "{ \"station\": \"$f1\" }"
done < NYC_Transit_Subway_Entrance_And_Exit_Data.csv
This script will read the file (named NYC_Transit_Subway_Entrance_And_Exit_Data.csv), line by line, and send the following initial json to Elasticsearch:
{
   "station": "BMT,4 Avenue,59th St,40.641362,-74.017881,N,R,,,,,,,,,,Stair,YES,,YES,NONE,,FALSE,,TRUE,4th Ave,60th St,SW,40.640682,-74.018857,'(40.641362, -74.017881)','(40.640682, -74.018857)'"
}
The json contains just one field “station”, with a single line. Once the json is sent to Elasticsearch, we need to take the information and break the station field into multiple fields, each containing a single value of the unstructured line. It is highly recommended to use the simulate API from Elasticsearch to play and develop the pipeline before actually creating it. Initially you should just start with a document and an empty pipeline:
POST _ingest/pipeline/_simulate
{
 "pipeline": {},
 "docs": [
   {
     "station": "BMT,4 Avenue,59th St,40.641362,-74.017881,N,R,,,,,,,,,,Stair,YES,,YES,NONE,,FALSE,,TRUE,4th Ave,60th St,SW,40.640682,-74.018857,'(40.641362, -74.017881)','(40.640682, -74.018857)'"
   }
 ]
}
There are many processors available to process the lines, so you should consider all of them to choose which to use. In this case we will simply use the Grok Processor which allows us to easily define a simple pattern for our lines. The idea of the following processor is to parse using grok and finally remove the field containing the full line:
POST _ingest/pipeline/_simulate
{
 "pipeline": {
   "description": "Parsing the NYC stations",
   "processors": [
     {
       "grok": {
         "field": "station",
         "patterns": [
           "%{WORD:division},%{DATA:line},%{DATA:station_name},%{NUMBER:location.lat},%{NUMBER:location.lon},%{DATA},%{DATA},%{DATA},%{DATA},%{DATA},%{DATA},%{DATA},%{DATA},%{DATA},%{DATA},%{DATA},%{DATA:entrance_type},%{DATA:entry},%{DATA:exit_only},%{DATA:vending}"
         ]
       }
     },
     {
       "remove": {
         "field": "station"
       }
     }
   ]
 },
 "docs": [
   {
     "_index": "subway_info",
     "_type": "station",
     "_id": "AVvJZVQEBr2flFKzrrkr",
     "_score": 1,
     "_source": {
       "station": "BMT,4 Avenue,53rd St,40.645069,-74.014034,R,,,,,,,,,,,Stair,NO,Yes,NO,NONE,,FALSE,,TRUE,4th Ave,52nd St,NW,40.645619,-74.013688,'(40.645069, -74.014034)','(40.645619, -74.013688)'"
     }
   }
 ]
}
This pipeline will produce the following document with structured fields and ready to be indexed into Elasticsearch:
{
 "division": "BMT",
 "station_name": "53rd St",
 "entry": "NO",
 "exit_only": "Yes",
 "line": "4 Avenue",
 "vending": "",
 "location": {
   "lon": "-74.014034",
   "lat": "40.645069"
 },
 "entrance_type": "Stair"
}
Indexing the documents
Before indexing the document, we need to create an index template that will match the index name that we are going to use. In order to properly be able to do document filtering and geo-location styled queries and dashboard, it is required to setup certain field types which require a specific mapping definition. This can be done by explicitly creating the index in advance, but it is better to use an index template to make it flexible. New indices following this name will be created, automatically, with all this settings and mappings. The name of the index that we will use in this case, will start with subway_info followed by the version (v1 for example). For this, we should use the following template that will match such index name:
PUT _template/nyc_template
{
 "template": "subway_info*",
 "settings": {
   "number_of_shards": 1
 },
 "mappings": {
   "station": {
     "properties": {
       "location": {
         "type": "geo_point"
       },
       "entry": {
         "type": "keyword"
       },
       "exit_only": {
         "type": "keyword"
       }
     }
   }
 }
}
After creating the template, we need to take the ingest pipeline from the simulate step and put the pipeline itself into Elasticsearch, so that we can invoke it at indexing time. The command to put the ingest pipeline should look like the following:
PUT _ingest/pipeline/parse_nyc_csv
{
 "description": "Parsing the NYC stations",
 "processors": [
   {
     "grok": {
       "field": "station",
       "patterns": [
         "%{WORD:division},%{DATA:line},%{DATA:station_name},%{NUMBER:location.lat},%{NUMBER:location.lon},%{DATA},%{DATA},%{DATA},%{DATA},%{DATA},%{DATA},%{DATA},%{DATA},%{DATA},%{DATA},%{DATA},%{DATA:entrance_type},%{DATA:entry},%{DATA:exit_only},%{DATA:vending}"
       ]
     }
   },
   {
     "remove": {
       "field": "station"
     }
   }
 ]
}
Now, we just need to read the file and sent the data to Elasticsearch using the pipeline we created. The pipeline definition is configured in the URL:
while read f1
do
  curl -XPOST 'https://XXXXXXX.us-east-1.aws.found.io:9243/subway_info_v1/station?pipeline=parse_nyc_csv' -H "Content-Type: application/json" -u elastic:XXXX -d "{ \"station\": \"$f1\" }"
done < NYC_Transit_Subway_Entrance_And_Exit_Data.csv
Let it run for a while and it will create each document one at a time. Note that here we are using the index API and not the bulk API. In order to make it faster and more robust for production use cases, we recommend you use the bulk API to index these documents. At the end of the ingest process you will end up with 1868 stations in the subway_info_v1 index.
Building the Dashboard
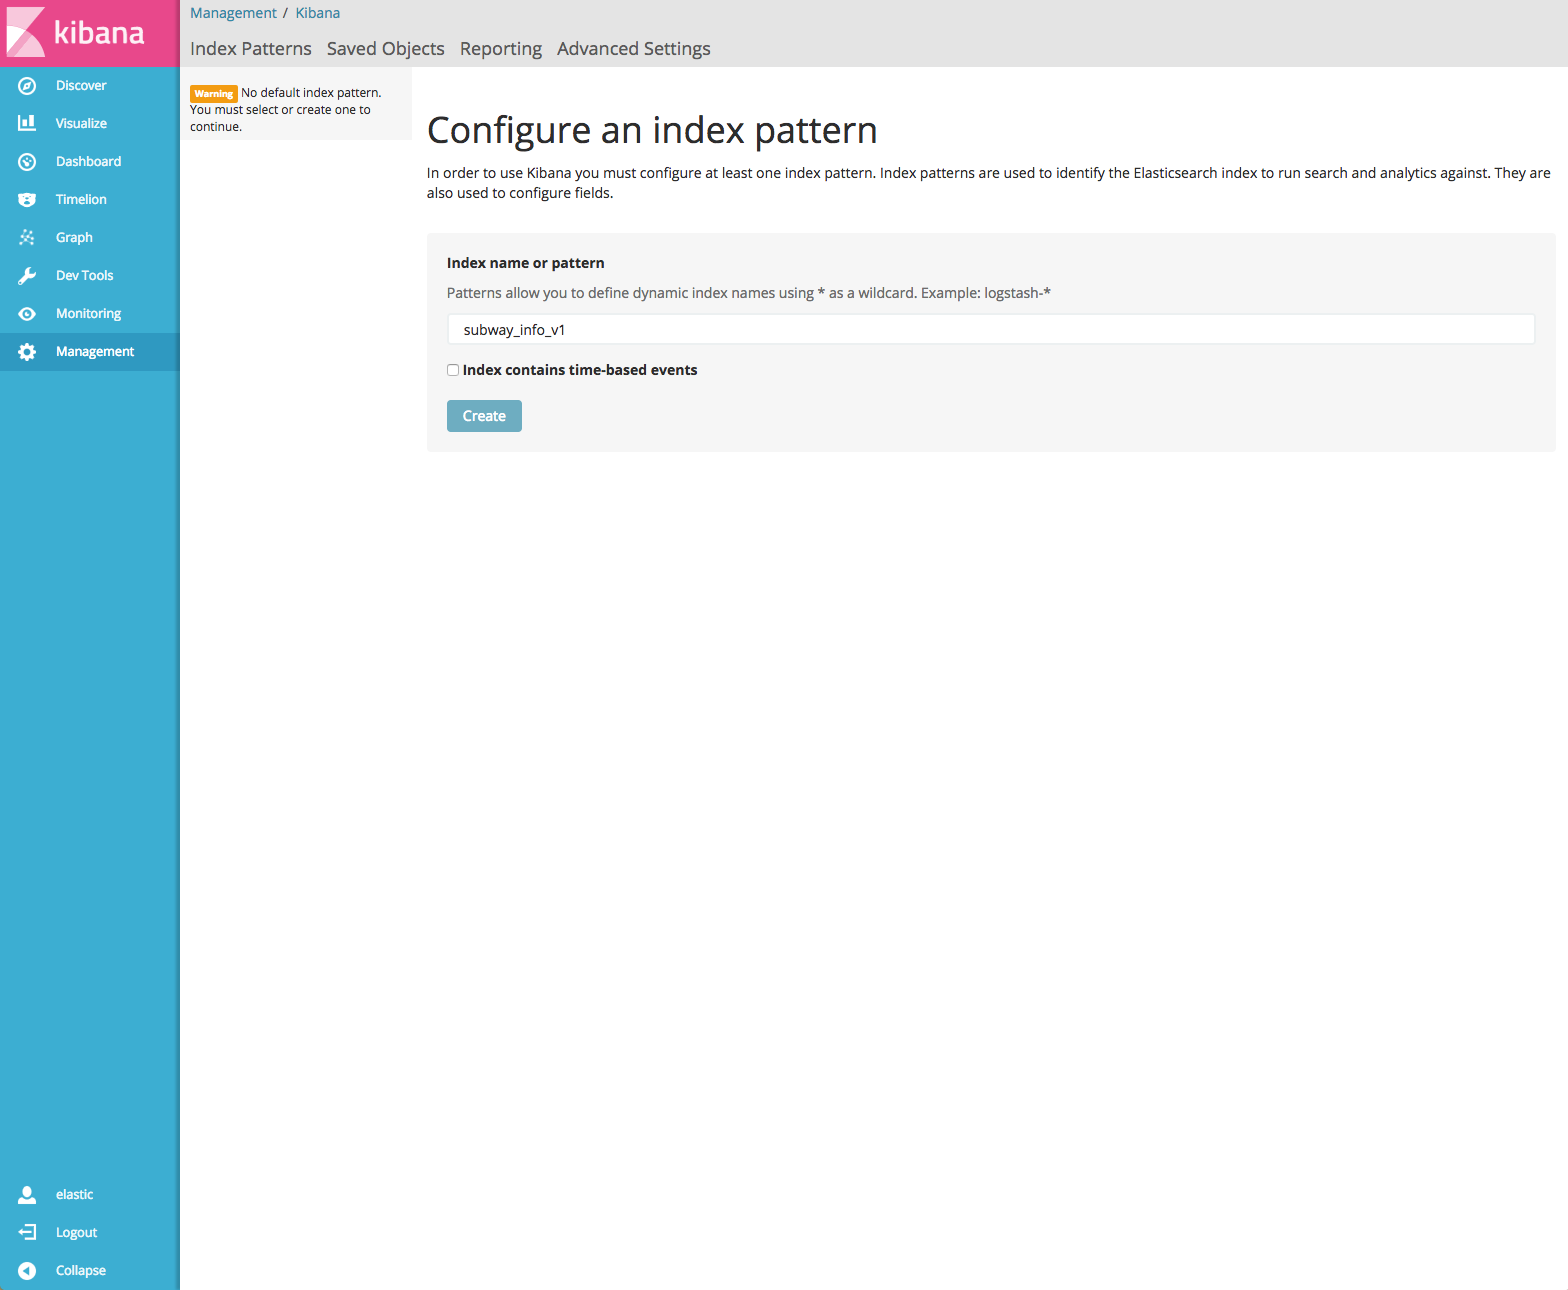
In order to build the dashboard, first we need to add the index pattern to Kibana. For that, just go to Management and add the index pattern subway_info_v1. You should unclick the “Index contains time-based events” option as it is not time series data (our data doesn’t contain a date-time field).
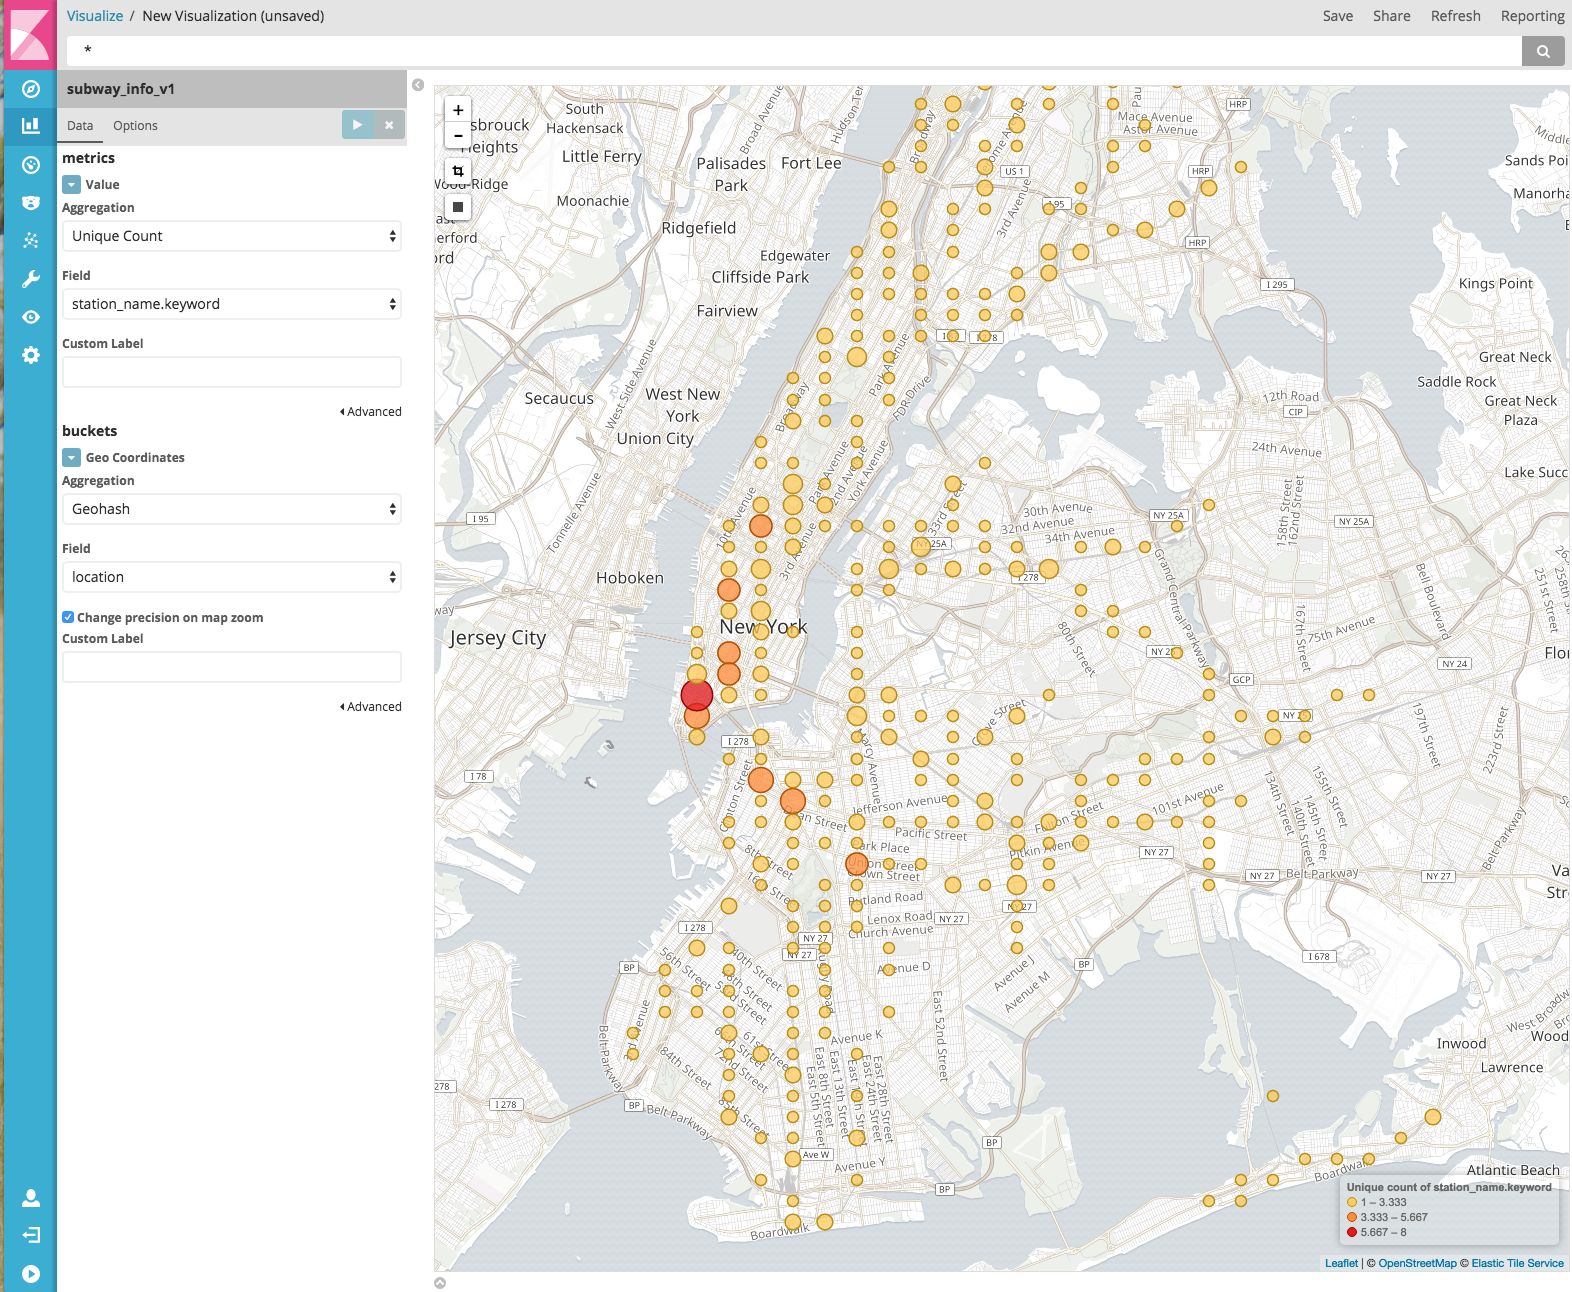
After this we can go and first create our Tile Map visualization showing all the subway stations that we have in this dataset for New York City. For that, we need to go to Visualizations and choose the Tile Map type. By choosing the geolocation field and the cardinality of the station name, we get an easy and quick view of the existing stations.
By adding some additional Visualizations, such as a Saved Search and type of entrance, we can easily build a tool to search for specific Subway stations in New York city.
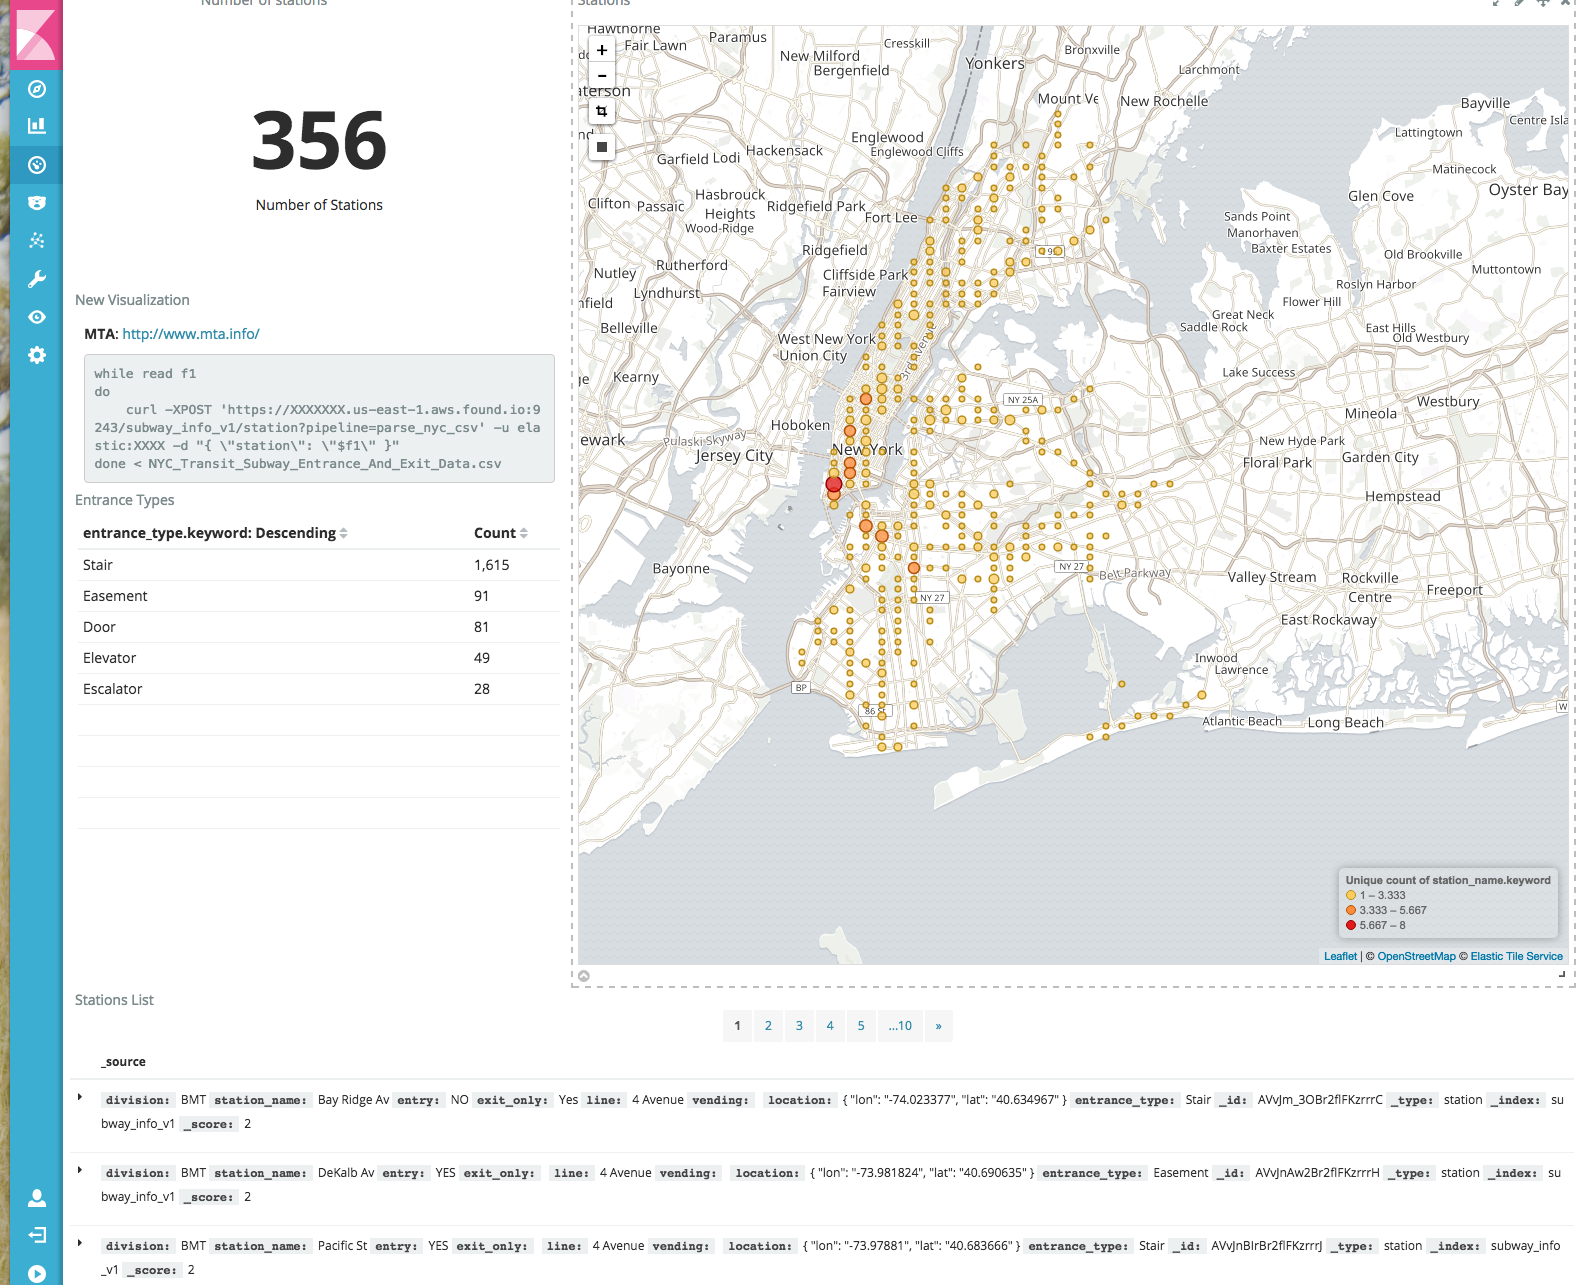
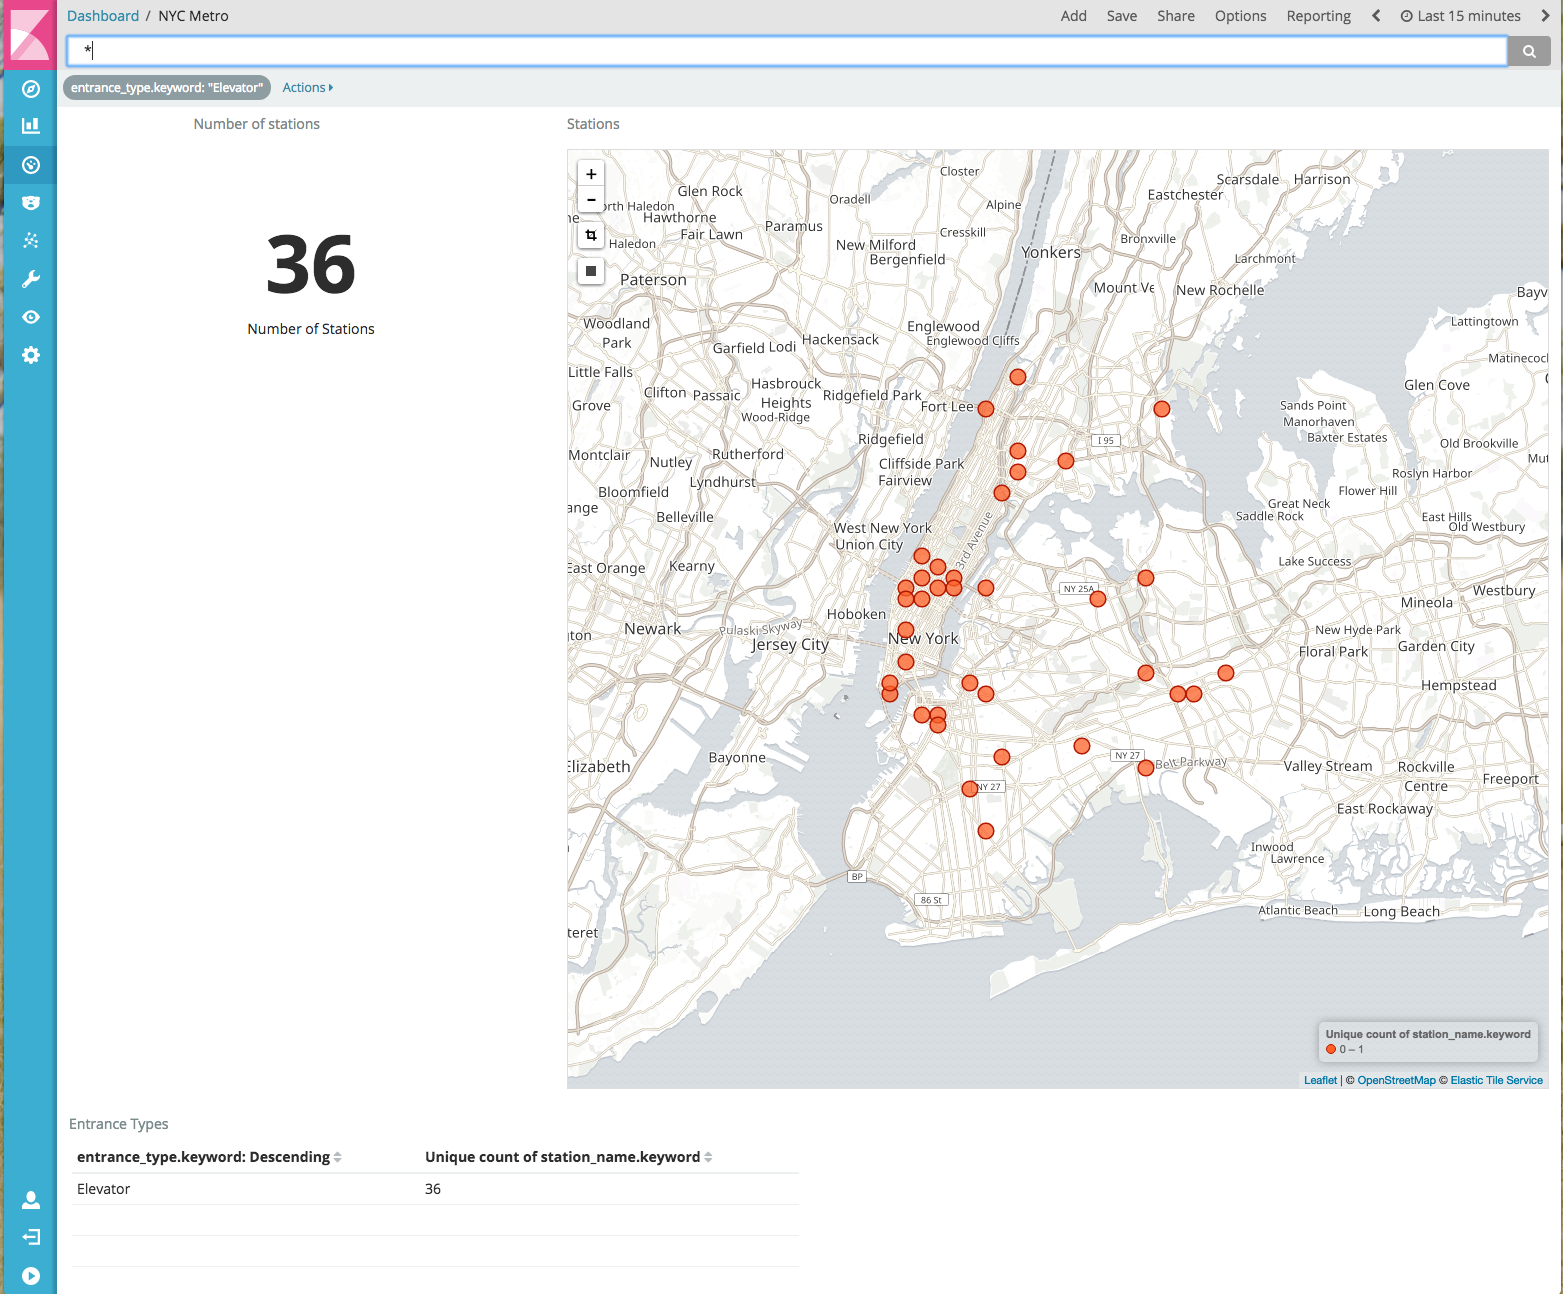
As we can see here, downtown Manhattan is the area with the most Subway Stations. With Kibana you can select a specific rectangle and also filter on a value such as “Elevator”. For example from the 356 Stations, around 200 are located in Manhattan, and 36 stations have elevators.
Try it out with your Dataset!
As you can see, starting from scratch with a CSV file is very simple. You can run a trial on an Elasticsearch Cloud (cloud.elastic.co) instance and ingest your data with just little work. Ingest Node is the tool that will allow you to convert unstructured data into structured data, and finally be able to create powerful visualizations with Kibana. Going from Zero to Hero in Elasticsearch, is as easy as spinning up a cluster. Try it for yourself!