Getting started with Elastic Cloud on Kubernetes: Deployment
Even though still in alpha, the recent announcement of Elastic Cloud on Kubernetes (ECK) has stirred up significant interest from both the Elasticsearch community and the Kubernetes community. Developed and supported by the creator of the Elastic Stack, ECK is the best way to deploy Elastic on Kubernetes. The goal of this series of two blogs is to walk you through the step-by-step process of:
- Deploying ECK into a Kubernetes cluster (Minikube or GKE)
- Deploying the Elastic Stack into ECK
- Scaling and upgrading Elasticsearch and Kibana inside ECK
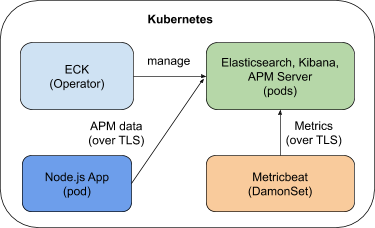
- Deploying a sample application instrumented with Elastic APM and sending APM data to the ECK-managed Elasticsearch cluster
- Deploying Metricbeat to Kubernetes as a DaemonSet and securely connecting Metricbeat to the ECK-managed Elasticsearch cluster
At the end of the blog, you will end up with a system as shown by the diagram below. In this first blog, we focus on deploying ECK and the Elastic Stack.
You can also refer to the quickstart page or the product page for more up-to-date information about ECK.
Create your k8s cluster
Before deploying ECK and your Elastic Stack, you must have a Kubernetes cluster ready. For the purpose of this blog, either Minikube or Google Kubernetes Engine (GKE) will do. We also support other Kubernetes distributions like OpenShift, Amazon EKS, and Microsoft AKS. Because we are going to deploy ECK, Elasticsearch, Kibana, APM Server, and a sample application, I recommend you give 16 GB of RAM and 4 cores to your cluster. You can also give 12 GB RAM to your Kubernetes cluster, but 16 GB will definitely give you a smooth experience.
Minikube
If you are going to use Minikube, follow the installation instructions to install it. Once installed, configure Minikube with the resources needed and start it up:
minikube config set memory 16384
minikube config set cpus 4
minikube start
The Kubernetes dashboard is extremely convenient for log monitoring and managing your Kubernetes cluster. You can enable the dashboard for Minikube with one command:
minikube dashboard
A browser window opens automatically with the Kubernetes dashboard displayed. That’s it — you are ready to go.
Google Kubernetes Engine (GKE)
If you are going to use GKE, follow the Google documentation to configure your cluster. My GKE cluster consists of one node of 15 GB RAM and 4 vCPUs. You can choose a smaller cluster, but nothing below 12 GB RAM. Also, to work with GKE, you need the gcloud command-line tool.
Once your GKE cluster is up and running, use the following commands to connect to your cluster and set the required privileges. With GKE, you must have cluster-admin permissions. Make sure you replace project name, zone name, cluster name, and user ID with yours:
gcloud config set project elastic-sa
gcloud config set compute/zone us-central1-a
gcloud config set container/cluster aquan
gcloud auth login
gcloud container clusters get-credentials aquan --zone us-central1-a --project elastic-sa
kubectl create clusterrolebinding cluster-admin-binding --clusterrole=cluster-admin --user=adam.quan@elastic.co
kubectl create clusterrolebinding adam.quan-cluster-admin-binding --clusterrole=cluster-admin --user=adam.quan@elastic.co
Finally, we will be using the Kubernetes command-line tool to interact with either Minikube or GKE. Follow the instructions to install kubectl. Make sure you have kubectl version 1.11+ installed.
The artifacts used for this blog can be downloaded from this GitHub repository.
Deploy the Elasticsearch operator
Would you believe that you only need one command to deploy ECK? It’s true — just run the following command to deploy the latest ECK 0.9.0 (as of this writing). Simple and easy.
kubectl apply -f https://download.elastic.co/downloads/eck/0.9.0/all-in-one.yaml
Once deployed, you can use the following command to monitor logs from the operator and make sure everything goes well. It just takes a few moments for ECK to be up and running.
kubectl -n elastic-system logs -f statefulset.apps/elastic-operator
Deploy the Elastic Stack
Now that ECK is running, we are ready to deploy the Elastic Stack, which also takes just one command. Check out apm_es_kibana.yaml and see how easy it is to configure Kibana and the APM server so that they can communicate with each other by using elasticsearchRef.
There are many ways to customize your deployment, such as:
- Pod template
- Node configuration
- Virtual memory
- Custom HTTP certificate
- Secure settings
Deploy the stack with the following command:
kubectl apply -f apm_es_kibana.yaml
Check the status of Elasticsearch, Kibana, and APM Server with kubectl or the Kubernetes dashboard and make sure all of them are green and ready:
kubectl get elasticsearch,kibana,apmserver
Once all three components become green, your Elasticsearch cluster is up and running and ready for data to come in. ECK performs many tasks for us. Before moving on, let’s take a look at what ECK has actually done for our cluster:
- Security is turned on for ECK. All Elastic Stack resources deployed by ECK are secured by default. The built-in basic authentication user elastic was provisioned, and network traffic to, from, and within your Elasticsearch cluster are secured with TLS.
- Certificates: By default, a self-signed CA certificate is used for each cluster. Custom HTTPS certificates can be configured.
- Default service exposure: A ClusterIP Service is automatically created for your cluster, and Kibana. You can obviously configure them to be LoadBalancer type if needed.
With Elasticsearch, Kibana, and APM Server running, let’s see it from Kibana.
Access Kibana
By default, Kibana is exposed as a service with a cluster IP accessible from within the cluster but is not exposed to the internet. However, you can use the following port forwarding command to make Kibana accessible from your laptop:
kubectl port-forward service/kibana-sample-kb-http 5601
Before we can log into Kibana, we need to get the default elastic user’s credentials. You can run kubectl get secrets and then inspect the secret to find the JSON path of the secret. Here is the correct secret and path for our case:
echo `kubectl get secret elasticsearch-sample-es-elastic-user -o=jsonpath='{.data.elastic}' | base64 --decode`
The password for the elastic user is displayed. Copy and save it into a notepad.
Now, open a browser and connect to https://localhost:5601. Since we are using a self-signed certificate, you will need to accept the browser’s security warning. Log into Kibana using the elastic user and the password you just retrieved. You’ll be taken to the homepage of Kibana. Our cluster is totally ready!
Scaling and upgrading
Scaling and upgrading your Elasticsearch cluster inside ECK is as simple as modifying the deployment configuration and applying it with kubectl.
Scaling
Modify your deployment manifest apm_es_kibana.yaml by changing the memory size of your elasticsearch container to 3 GB from 2 GB in the following section:
        containers:
          - name: elasticsearch
            resources:
              limits:
                memory: 3Gi
Save the file and scale your node with this command:
kubectl apply -f apm_es_kibana.yaml
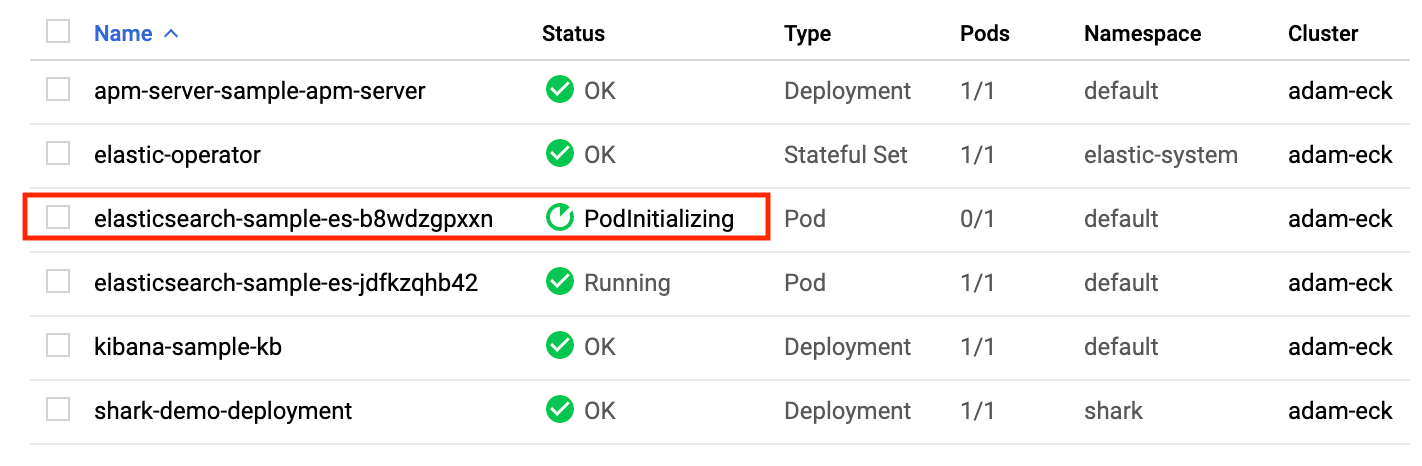
Immediately switch to your Kubernetes console, where you’ll see a new Elasticsearch pod being created. ECK is scaling your Elasticsearch node with zero downtime. In a few moments, you’ll see the new pod running, and the original pod will disappear. Data from the old pod was also seamlessly moved over.
You can obviously scale your cluster other ways, like adding more nodes to it. However you do it, it’s a simple kubectl apply command.
Upgrading
Now, let’s upgrade the cluster to 7.2.0 by simply changing the version for Elasticsearch, Kibana, and APM Server from 7.1.0 to 7.2.0 inside the deployment manifest file apm_es_kibana.yaml. Save and apply the upgrade with the following command:
kubectl apply -f apm_es_kibana.yaml
Similarly, from the Kubernetes console, you can see that ECK is seamlessly upgrading Elasticsearch, Kibana, and APM Server with no downtime.
Once the upgrading process is done, verify that you are now running version 7.2.0 of the Elastic Stack. Are you convinced that ECK is pretty powerful by now? I hope you are.
Summary
Hopefully you enjoyed this quick getting started experience with Elastic Cloud on Kubernetes and see how easy it really is. In part 2 of this blog, we will deploy a simple application instrumented with APM and have it send APM data to our ECK-managed cluster. We’ll also deploy Metricbeat into Kubernetes to send metrics data to the cluster.