Code coverage for eBPF programs


 Share on Twitter
Share on Twitter

 Share on LinkedIn
Share on LinkedIn

 Share on Facebook
Share on Facebook

 Share by Email
Share by Email

 Print this page
Print
I bet we all have heard so much about eBPF in recent years. Data shows that eBPF is quickly becoming the first choice for implementing tracing and security applications, and Elastic is also working relentlessly on supercharging our security solutions (and more) with eBPF.
That's why I sat down and wrote bpfcov: a tool to gather source-based coverage info for our eBPF programs running in the Linux kernel. Whether they are getting loaded via BPF_PROG_TEST_RUN or by other ordinary means. Until today, there was no simple way to visualize how the flow of your eBPF program running in the kernel was. Hopefully, there is one starting today.
Source-based code coverage for eBPF
Everyone reading this post probably knows what the code coverage is. Common line-level coverage gives us a sense of what line is executed. In some cases, it even tells us how many times a line got executed.
When building this tool, driven by my experience fighting with BPF, I knew I wanted something more. Line-level granularity is often too coarse. We do not want an approximation of what code actually executed.
We need something more precise to understand the execution path of our eBPF programs in the Linux kernel. We even want to know what part of an `if` conditional executed. Source-based code coverage is what I wanted for this reason.
Since it starts at code generation time in LLVM, it has the notion of regions of the code, branches, and so on. It even precisely counts things like short-circuited conditionals, thanks to the counter expression and arithmetics between them. It generates coverage summaries with very fined-grained code regions, helping us find grasps in the code and its execution flow.
So, given eBPF programs are usually written in C, couldn’t we just instrument them for source-based code coverage as we would commonly do with Clang for our C programs? I bet this is the first argument pumping into the head of many readers. It also was one of my thoughts when approaching this problem. Turns out that we definitely can, and we will do it. But it won’t work as is.
To understand why it won’t work, we need to keep in mind that BPF programs are compiled via Clang (thanks to the LLVM BPF target) to BPF ELF object files, containing instructions specific to the chosen BPF instruction set, which need to be later loaded in the Linux kernel via the bpf() syscall. Furthermore, it’s paramount to mention that the BPF programs will be verified by an in-kernel verifier and then executed by the BPF VM.
Such a lifecycle and environment imposes a set of constraints that make it infeasible to get them working with the plain instrumentation that LLVM applies to get source-based code coverage. In fact, when compiling a C program for source-based coverage with the -fprofile-instr-generate and -fcoverage-mapping Clang flags, LLVM instruments it with a bunch of global variables and, in some cases, functions.
Observing the LLVM IR of a C program after compiling it with the -fprofile-instr-generate flag, we can notice that, LLVM…
- defines the counters, in the form of
__profc_<function_name>private global arrays whose size is the number of counters needed to cover all the regions and branches of such a function - marks those counters to be into the `__llvm_prf_cnts` section of the ELF
- defines (and initializes)
__profd_<function_name>private global struct instances that contains an identifier of the function, the pointer to its counters, the pointer to the function itself, the number of the counters for the target function, and a bunch of other info needed to tie together the counters and the coverage mappings - marks the
__profd_globals to end up into the__llvm_prf_datasection of the ELF - defines (and initializes) a private constant (
__llvm_prf_nm) containing the names of the target functions - marks the names constant to end up in the
__llvm_prf_namessection of the ELF
The first issue to dismount here is that we can't have random ELF sections (like __llvm_prf_cnts, etc.) into valid BPF ELF files.
__profc_ ones, at least on recent Linux kernels. At the same time, we know it's not wise to have global structs like __profd_ or whatever loader for our eBPF programs we will write, as we'll need the struct definitions. Too clunky.-fprofile-instr-generate flag also generates a global constructor and a set of global functions, all prefixed with __llvm_profile, intended to set up the profiling runtime in the resulting binary so that when it dies or exits it will automatically generate a profraw file.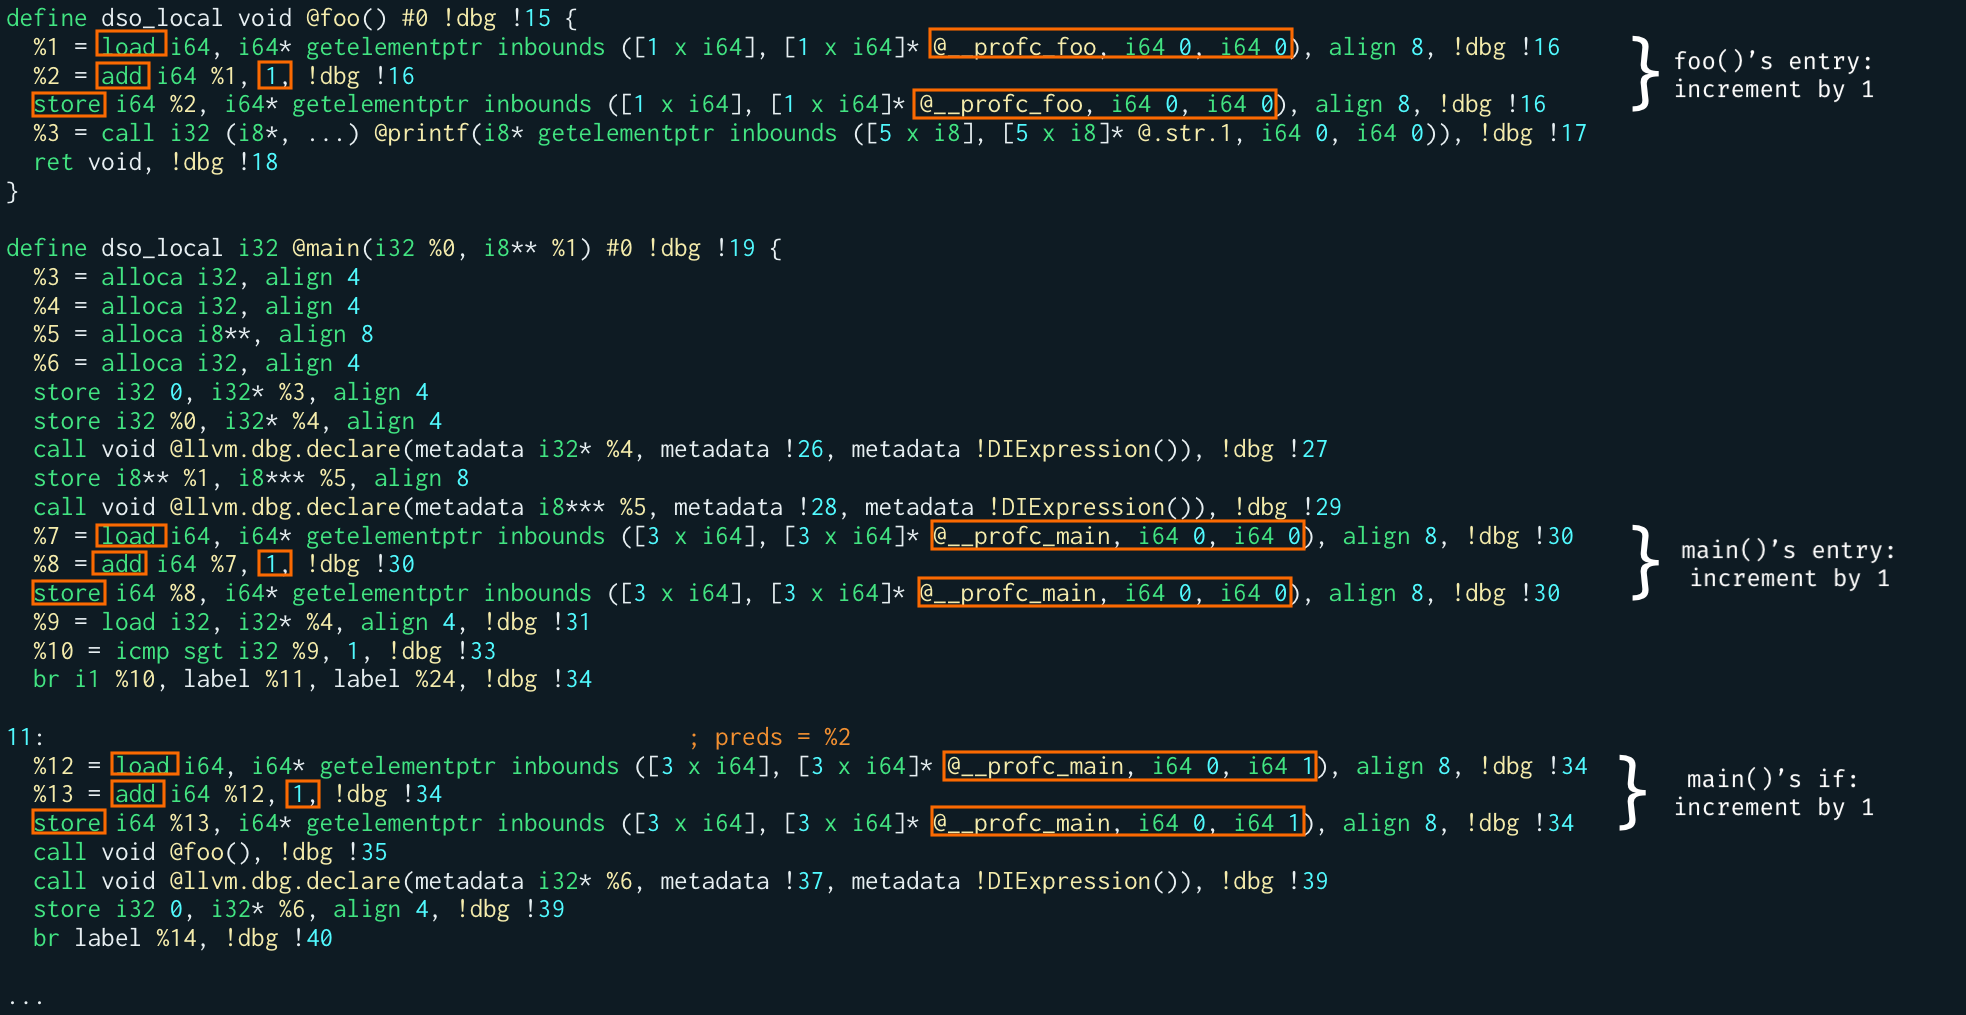
Instead, focusing on the -fcoverage-mapping Clang flag and inspecting the LLVM IR it outputs, we notice that it…
- defines (and initializes)
__covrec_global (constant) structs, most notably containing the same ID that the__profd_variables contain, and a LEB128 encoded string containing all the region, branches, and generally the coverage mapping info - defines (and initializes) a
__llvm_coverage_mappingfunction containing meta info about the coverage mapping format (eg., the version), and the source file names - marks the
__llvm_coverage_mappingvariable to be put into the__llvm_covmapsection of the ELF
In this case, we have the same category of issues mentioned before.
We need to keep at least the header of __llvm_coverage_mapping because it contains the coverage mappings version, which we need for generating a valid profraw file. Also, we need to put it in a BPF.
__covrec_ structs from the BPF ELF meant to be loaded in the kernel. We can keep them in a second BPF ELF that would be intended to be given to tools needing the coverage mappings for generating the coverage reports, just like llvm-cov does.
How it's done
libBPFCov.so - A LLVM pass
By analyzing the resulting LLVM IR for source-based coverage instrumented programs, we should now have a better understanding of what we need to do for having it on eBPF programs running in the Linux kernel. We now know what to completely get rid of and do differently, and what we need to patch to make it loadable and usable by the BPF VM in the kernel.
The plan is simple: get Clang to instrument a BPF LLVM intermediate representation for source-based code coverage, then patch it to model it into a valid representation for BPF ELF. How do we need to transform it?
First of all, we are so lucky we don’t have to mess with the actual BPF instructions — namely the counters increments. We can keep them the way they are. This is a huge win because we let LLVM keep track of the global state of the registers and we avoid a lot of work this way.
But for sure we have to strip any profile initialization stuff that Clang creates, things like __llvm_profile_runtime and __llvm_profile_init - when present - are no good for the BPF VM in the kernel.
We also want to ensure the global variables, whether constants or not, have the right visibility (ie., dso_local) and linkage, to have them in the libbpf skeletons if we plan to use them.
For the global structs that we need for generating the profraw files, namely the __profd_ variables, we just transform them into different and single global variables, one for each field.
For example, this is what I did for the __profd_* variables which originally are a struct with 7 fields. For other global structs like the __covrec_ ones, we can just strip them from the BPF ELF that is meant to be loaded in the kernel.
Anyway, the report generation phase (ie., llvm-cov or bpfcov out) will need them for knowing at which line and column a code region or a branch starts. For this reason, I decided to give the LLVM pass an option (enabled with the strip-initializers-only flag) that keeps them, so we can later create a BPF ELF that is only meant for this phase and not for loading.
This BPF ELF will have .bpf.obj as an extension, rather than .bpf.o.
Finally, we know that libbpf supports (on recent Linux kernels) eBPF global variables, which are simply eBPF maps with one single value, and we are planning to use them. But, as already mentioned, it does not accept or recognize the ELF sections that the Clang instrumentation injects in the intermediate representation.
So we need our LLVM pass to change them to custom eBPF sections. The eBPF custom sections are in the form of .rodata.* or .data.* made to contain static and/or global data. We can change the section of the counters to be .data.profc. The section of the __llvm_prf_nm from _llvm_prf_names to .rodata.profn, and so on. You can find all this logic summarized in these bits of code.
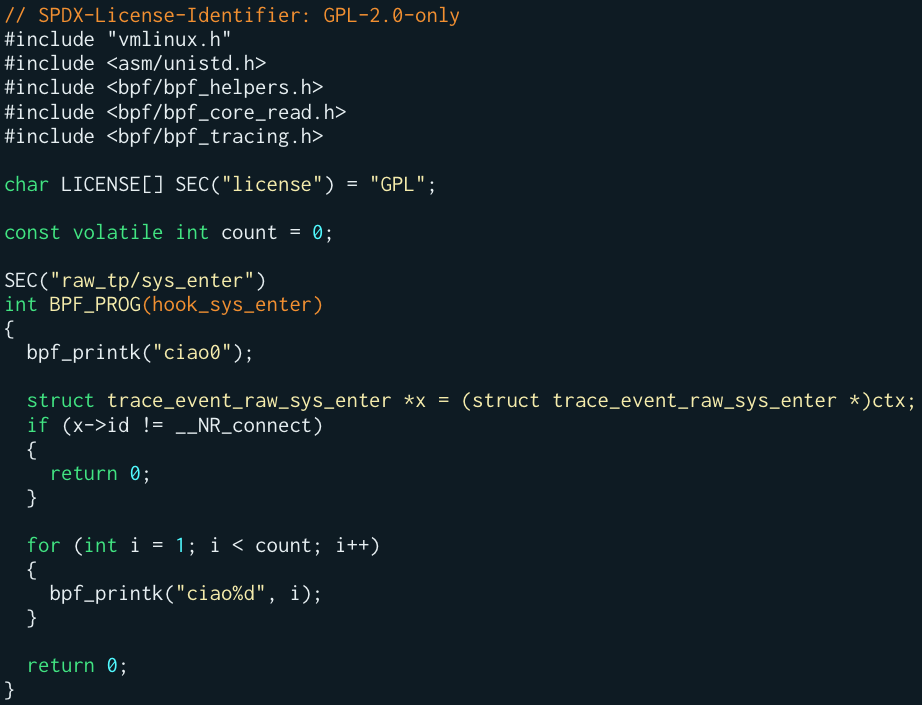
So, assuming the following dummy eBPF program:
libBPFCov.so LLVM pass:
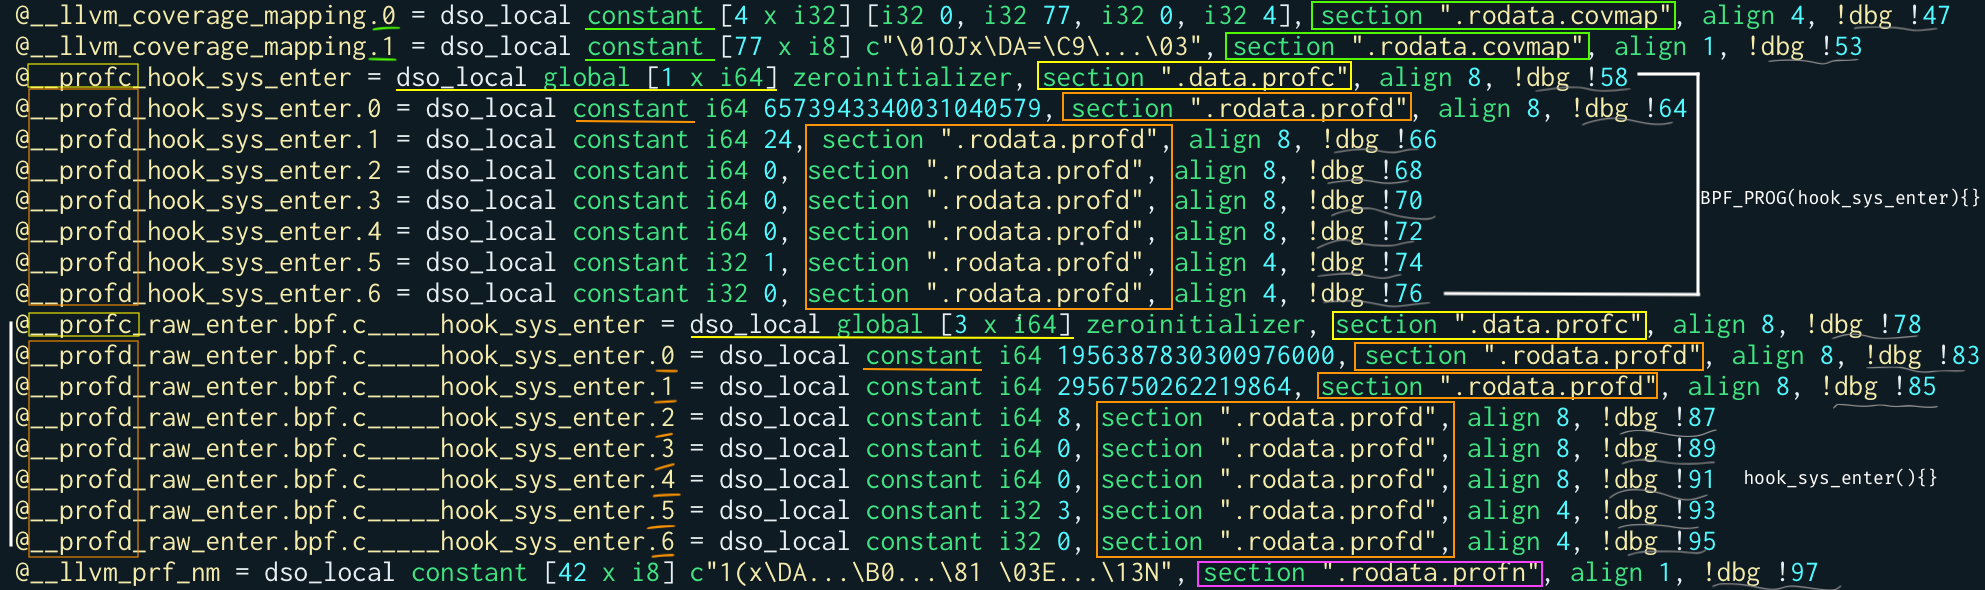
For example, you may notice that we have 2 __profc_ counters.
The first is for the BPF_PROG macro that expands to a function, the second for the actual BPF raw tracepoint program hook_sys_enter. This one has size 3. That’s because the hook_sys_enter function has 3 main regions: the entry of the function, the if conditional, and the for cycle.
You may also notice that the LLVM pass, for each one of the 2 functions we have, split the __profd_ global structs into 7 different global variables in the .rodata.profd section.
Someone who has an eye for it may also have noticed that the third field of __profd_ — now __profd_something.2 — does not contain anymore the address of its counters. I didn’t want (nor I could) to expose kernel addresses, so I put here the offset of the counters in their section (.data.profc).
Finally, you can also see that, as anticipated before, we completely deleted the __covrec_ global constant structs from this IR that’s meant to generate a valid and loadable BPF ELF. While the instructions incrementing the counters in the correct spots are not touched at all. So we don’t need another screenshot to show them!
The only missing moving part is how to generate a valid profraw file. We stripped any logic for doing it. We know that for generating it we need all the globals we left in this LLVM intermediate representation. But we have no sane way to hook the exit or the stop of an eBPF program in the Linux kernel.
Suddenly, inspiration came: let’s pin the globals to the BPF file system so that we can decouple the process of generating the profraw file from the running (and exiting) of the instrumented eBPF application!
And that’s what the bpfcov CLI does.
Before moving to the next section, I suggest you go to the bpfcov repository and start building the pass to obtain libBPFCov.so. You can find the instructions on how to build it here.
Instrument your eBPF program
libBPFCov.so we can finally take action!
Instrumenting an eBPF program for source-based coverage is not that different than compiling it normally with Clang and the BPF target.
The only difference is that we ask Clang to output LLVM IR (either in textual or binary form), run the libBPFCov.so pass on it (with opt), and finally compile it (with llc) to a BPF ELF.
bash
clang -g -O2 \
  -target bpf \
  -D__TARGET_ARCH_x86 -I$(YOUR_INCLUDES) \
  -fprofile-instr-generate -fcoverage-mapping \
  -emit-llvm -S \
  -c raw_enter.bpf.c -o raw_enter.bpf.ll

opt -load-pass-plugin $(BUILD_DIR)/lib/libBPFCov.so -passes="bpf-cov" \
    -S raw_enter.bpf.ll -o raw_enter.bpf.cov.ll

llc -march=bpf -filetype=obj -o cov/raw_enter.bpf.o raw_enter.bpf.cov.llYou can see in the Makefile inside the examples/src directory of the bpfcov GitHub repository how to automate those steps.
We now have a valid and coverage instrumented BPF ELF: cov/raw_enter.bpf.o.
From now on, you can instruct your loader and userspace code to use it, so to obtain a binary (eg., /cov/raw_enter) that is your eBPF application.
Use it
bpfcov run + bpfcov gen
What's left to do? Just three steps:
- Run our eBPF application with the bpfcov CLI run command
- Generate its
profrawfile - Generate beautiful source-based coverage reports
So, let's run our eBPF application with:
bash
sudo ./bpfcov -v2 run cov/raw_enterThis command acts similar to strace. It will detect the bpf() syscalls with the BPF_MAP_CREATE command.
Meaning that it will detect the eBPF globals in the .profc, .profd, .profn, and .covmap custom eBPF sections and pin them to the BPF file system, as you can see in the following screenshot.
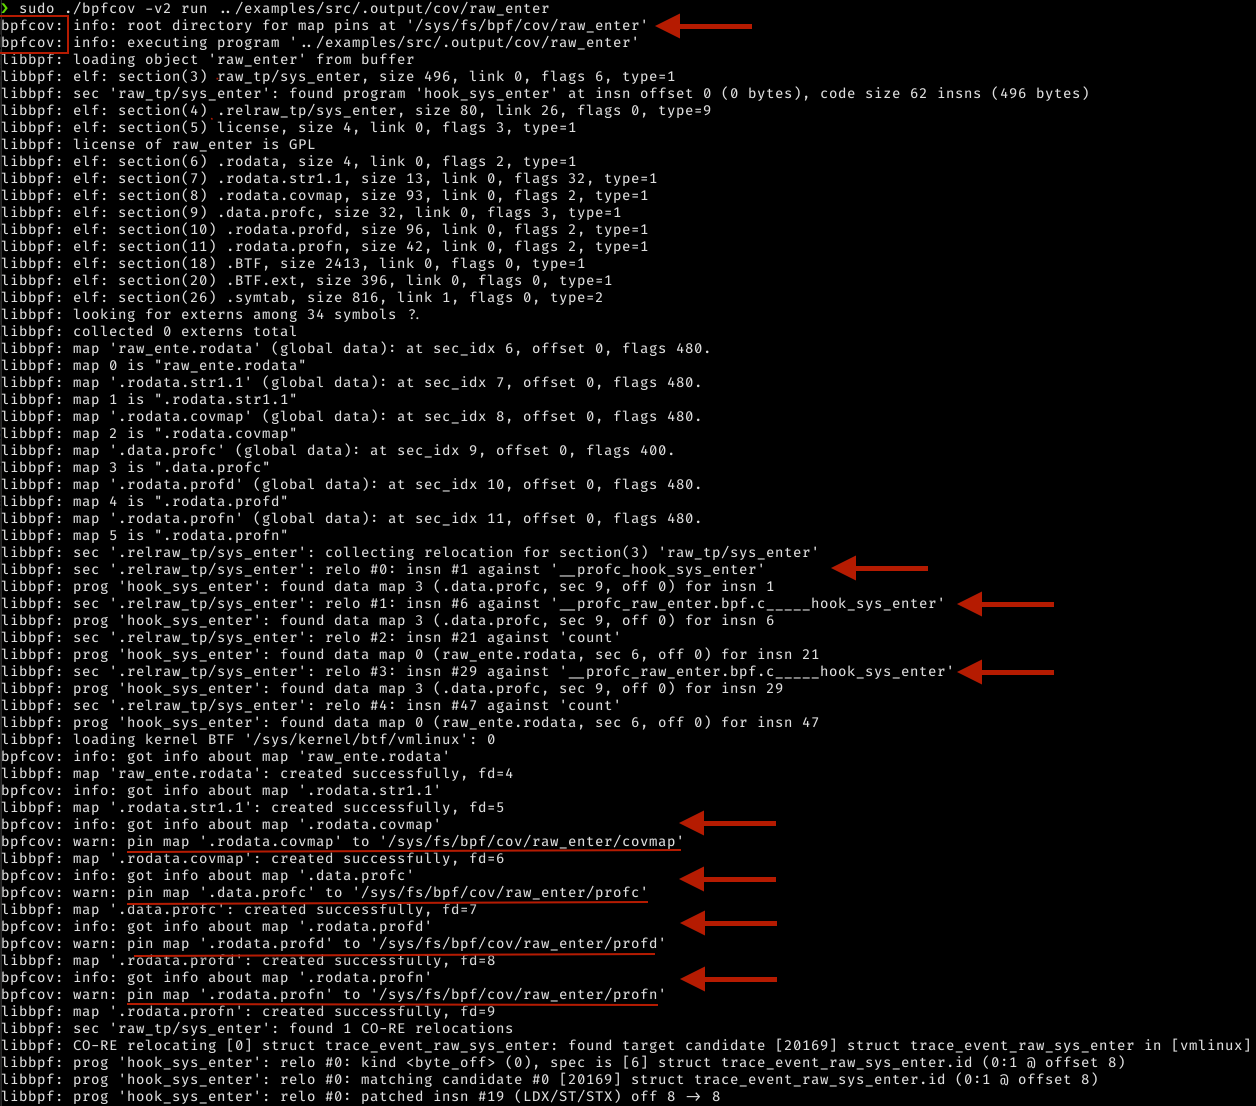
You may also notice that - since the LLVM pass annotated the counters correctly - libbpf can collect relocations for them…
At this point, whether we stopped our eBPF application or it exited… We have eBPF maps pinned to our BPF file system. Let’s check it:
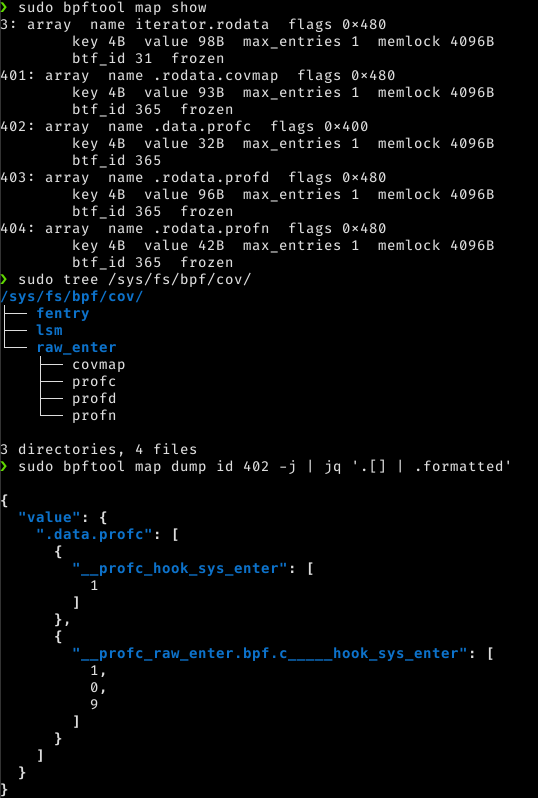
Wonderful, we already know that the hook_sys_enter function executed one time, the if condition did not evaluate to true, while the for iterated nine times!
It’s time to put the counters, the function names, the functions data, in a profraw file now.
This is why I created the bpfcov gen command exists: to dump the pinned maps in a profraw file.
shell
sudo ./bpfcov -v2 gen –unpin cov/raw_enter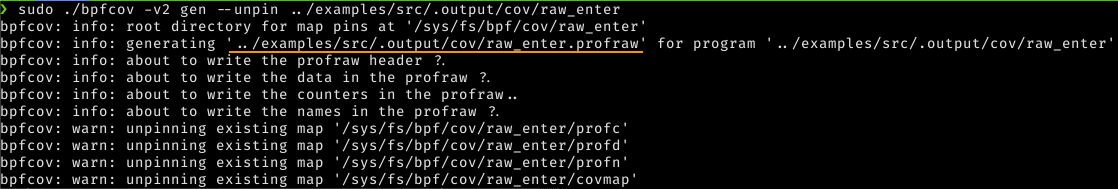
And this is the resulting profraw file for our instrumented eBPF program!
You can see it’s made of four parts: a header, .rodata.profd, .data.profc (ie., the counters!), and the names (.rodata.profn), plus some padding for alignment…
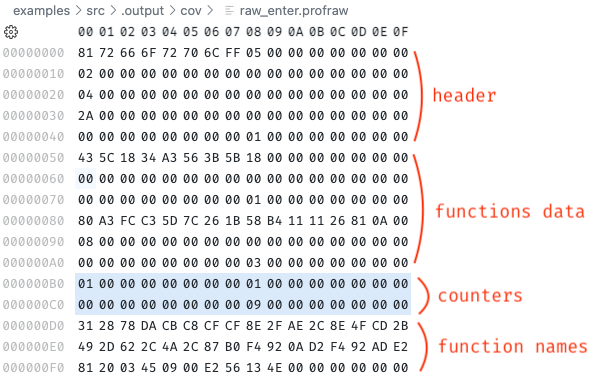
We can now either use the existing LLVM tools (llvm-profdata and llvm-cov) with it or simply use the out subcommand.
The bpfcov out command is an opinionated shortcut to generate HTML, JSON, or LCOV coverage reports even from multiple eBPF programs and their profraw files.
It is very convenient because it avoids us having to generate profdata from the profraw, calling llvm-cov with a bunch of long and different options. And it even works with multiple profraw files coming from different eBPF applications…
shell
./bpfcov out -o yey –f html \
cov/raw_enter.profraw …It outputs a very nice HTML directory whose index file gives us summaries not only about function and line coverage but also and notably about region and branch coverages for our eBPF applications.
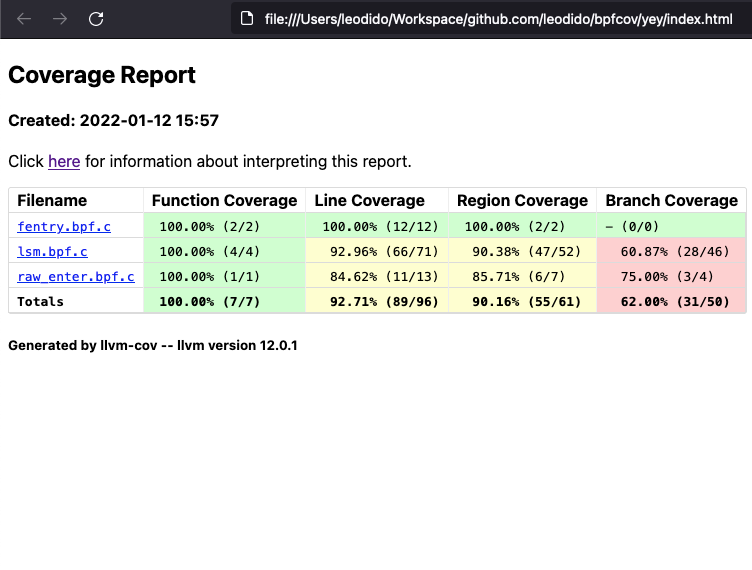
By clicking on any item in the table we end up visualizing very fine-grained, source-based coverage. A good example is the one in the following image:
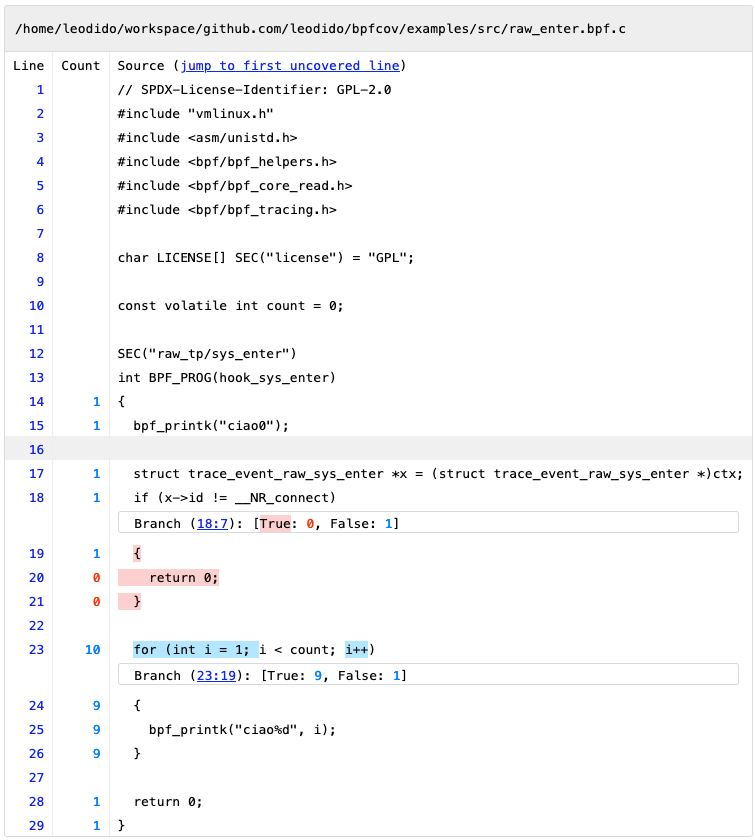
Furthermore, it does work also on very complicated and real-life eBPF programs. For example, the following screenshot is a part of the coverage report obtained for a BPF LSM test (progs/lsm.c, loaded by prog_tests/test_lsm.c) living in the Linux kernel.
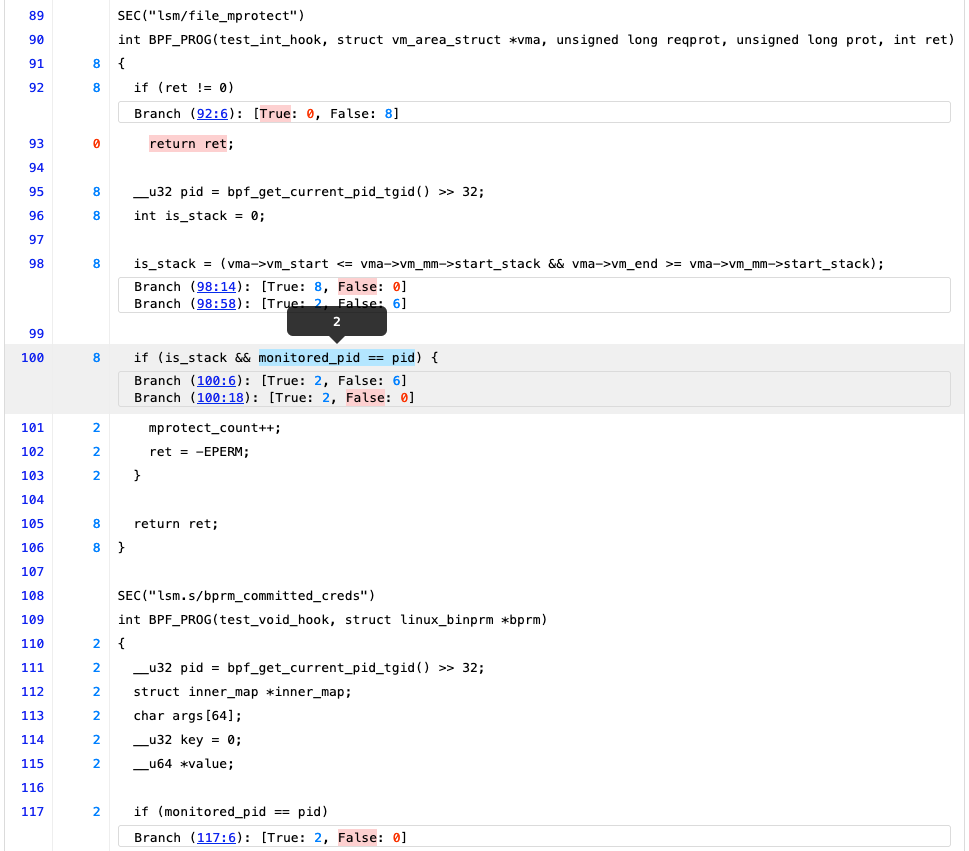
Thanks to this tool I can finally understand that over a total of eight executions of the lsm/file_mprotect BPF LSM program on my kernel, its is_stack variable was true two times out of eight, because six times the vma->vm_end >= vma->vm_mm->start_stack branch condition (98:58) evaluated to false.
Line 100, using is_stack in another condition, confirms that it was indeed true two times out of six. And that, for this reason (first operand - 100:6 - is_stack being false six times), the following check (100:18) on monitored_pid was short-circuited and evaluated (to true, by the way) only two times.
We finally have a tool helping us write and understand the way our eBPF programs run in the Linux kernel. I can’t stress enough how this is something I dreamt of so many times during the past few years I’ve been working with BPF…
Hope that the eBPF community and ecosystem will find bpfcov useful and cool the same way I do.
Bits on the future
The bpfcov tool is open-source, and it will stay that way. It is still in its early days so it will probably need a bit more tests, examples, and fixes. Just like any new software out there.
I will soon publish another project showcasing the coverage of the kernel BPF selftests, using this tool. This means there are a lot of contribution opportunities. I’d invite you to take a look at its source code and send patches! :)
Also, in case you want to start using it on your eBPF applications and repositories, feel free to contact me for support. I’d love to help you to use it.
From a technical perspective these are the topics that are on top of my mind for its future:
- A project like bpfcov must have a logo!
- Write
llvm-littests for thelibBPFCov.soLLVM pass - Support newer LLVM versions
- Workaround solutions to have it working on Linux kernels where BPF does not support custom eBPF sections and eBPF globals
- Create a versioning and release process
- Publish artifacts on GitHub (
libBPFCov.so, bpfcov CLI binary) - Add more examples
- Publish HTML reports of the example eBPF applications via GitHub pages
Come see bpfcov at FOSDEM 2022
In case you made it to the end, and you still want to hear more details on building source-based coverage for eBPF, or you want to ask questions to its author, please join this talk at FOSDEM 2022 on Feb 5.
You can already take a look at the talk’s deck (while here you can find the slides in PDF and markdown format if you prefer).
While at elastic/bpfcov you can take a look at the project. Don't forget to star it, if you don’t mind! :)
Share
- Share on Twitter
Share on Twitter
- Share on LinkedIn
Share on LinkedIn
- Share on Facebook
Share on Facebook
- Share by Email
Share by Email
- Print this page
Print