Categorize your logs with Elasticsearch categorize_text aggregation


 Share on Twitter
Share on Twitter

 Share on LinkedIn
Share on LinkedIn

 Share on Facebook
Share on Facebook

 Share by Email
Share by Email

 Print this page
Print
How does categorize_text aggregation work?
categorize_text reads the text from the document _source and creates tokens with a custom tokenizer, ml_standard, built specifically for general machine-generated text. In fact, many of the same options provided in anomaly detection are available in categorize_text. Once the text is analyzed, the tokens are clustered together with a modified version of the DRAIN algorithm. DRAIN builds a token tree and considers earlier tokens as more important. We have modified the algorithm slightly to allow merging tokens earlier in the text when building categories. In essence, tokens with high variability are removed, while more consistent ones form the category definitions.
Text categorization example
Here is how categorize_text parses the following NGINX log lines.
{"message": "2018/11/26 18:09:45 [error] 8#8: *4781 open() \"/etc/nginx/html/wan.php\" failed (2: No such file or directory), client: 154.91.201.90, server: _, request: \"POST /wan.php HTTP/1.1\", host: \"35.246.148.213\""},
{"message": "2018/11/20 17:26:36 [error] 8#8: *3672 open() \"/etc/nginx/html/pe.php\" failed (2: No such file or directory), client: 139.159.210.222, server: _, request: \"POST /pe.php HTTP/1.1\", host: \"35.246.148.213\""}With default settings, it would make the following category:
error open * failed No such file or directory client server request * hostThe common tokens are included in the category definition, and the variable tokens, the url file path, in this case, are elided with the * value.
Now that we know how it works at a high level, how could it be used?
Examples for visualizing log categories
Let’s examine three use cases for the categorize_text aggregation that could help you out as a system administrator: identifying problems by category over time, surfacing top error categories, and category trend visualization. The following examples all use Kibana Vega for visualizing log categories at query time.
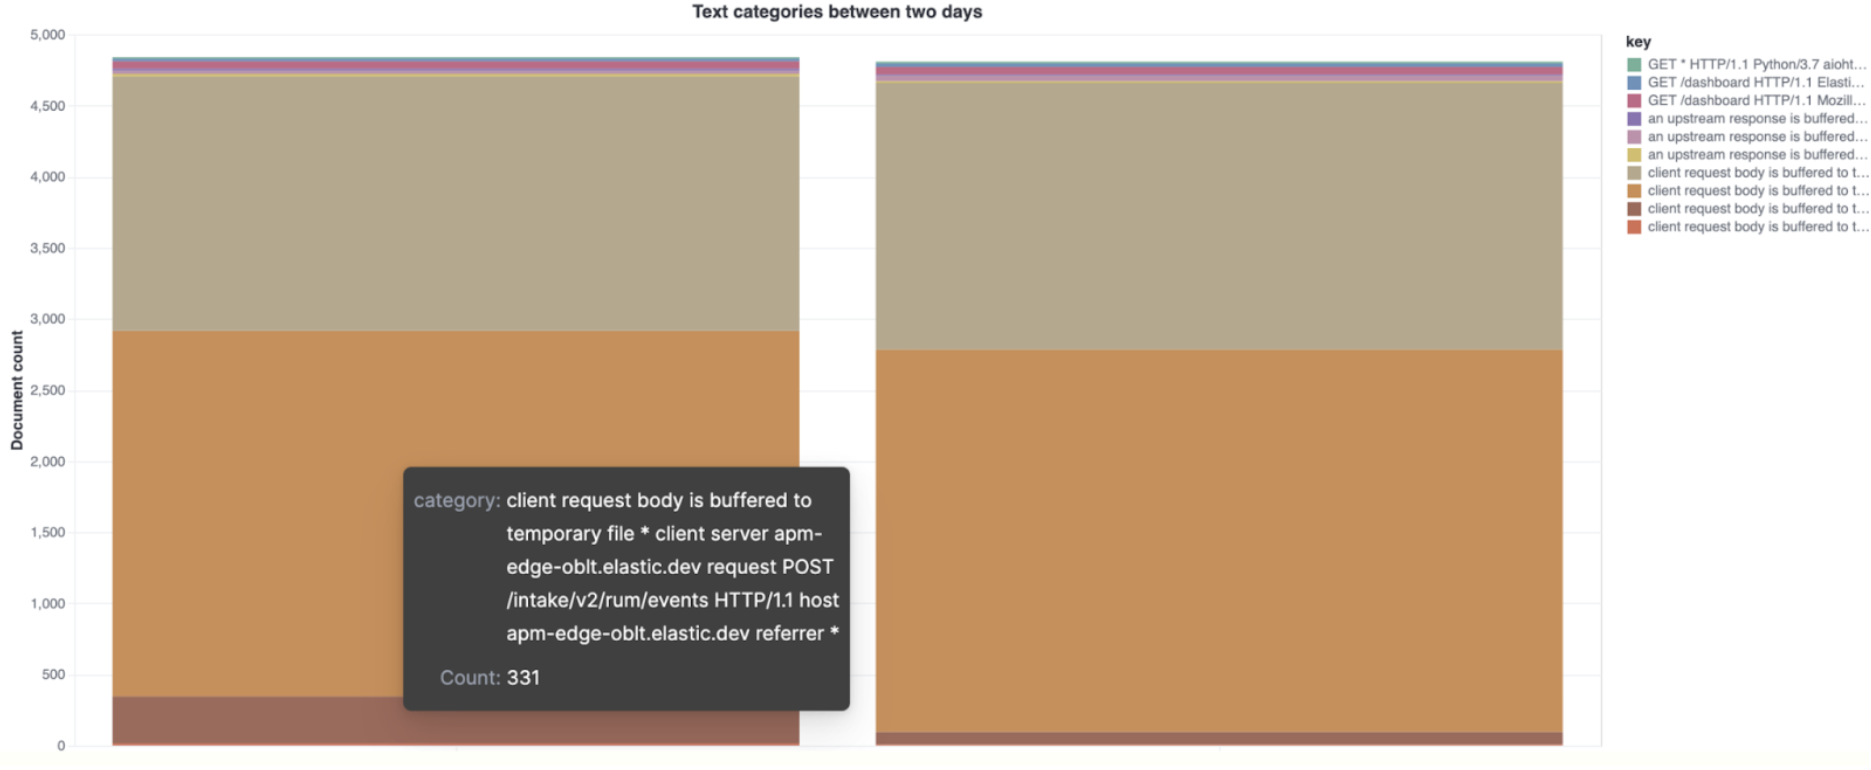
Comparing top categories between different days
The following example shows the different top categories for NGINX errors between two days. This is useful when comparing a previously known “good day” with a day where the system behavior was erratic.
{
  "$schema": "https://vega.github.io/schema/vega-lite/v5.json",
  "title": "Text categories between two days",
  "data": {
    "url": {
      "index": "filebeat-*",
      "body": {
        "size": 0,
        "query": {
          "bool": {
            "filter": [
              {"term": {"event.dataset": "nginx.error"}},
              {
                "bool": {
                  "should": [
                    {
                      "range": {
                        "@timestamp": {
                          "gte": "2021-02-25T00:00:00.000Z",
                          "lte": "2021-02-25T12:00:00.000Z"
                        }
                      }
                    },
                    {
                      "range": {
                        "@timestamp": {
                          "gte": "2021-02-26T00:00:00.000Z",
                          "lte": "2021-02-26T12:00:00.000Z"
                        }
                      }
                    }
                  ],
                  "minimum_should_match": 1
                }
              }
            ]
          }
        },
        "aggs": {
          "sample": {
            "sampler": {"shard_size": 5000},
            "aggs": {
              "categories": {
                "categorize_text": {
                  "field": "message",
                  "similarity_threshold": 20,
                  "max_unique_tokens": 20
                },
                "aggs": {
                  "time_buckets": {
                    "filters": {
                      "filters": {
                        "first": {
                          "range": {
                            "@timestamp": {
                              "gte": "2021-02-25T00:00:00.000Z",
                              "lte": "2021-02-25T12:00:00.000Z"
                            }
                          }
                        },
                        "second": {
                          "range": {
                            "@timestamp": {
                              "gte": "2021-02-26T00:00:00.000Z",
                              "lte": "2021-02-26T12:00:00.000Z"
                            }
                          }
                        }
                      }
                    }
                  }
                }
              }
            }
          }
        }
      }
    },
    "format": {"property": "aggregations.sample.categories.buckets"}
  },
  "transform": [
    {
      "fold": [
        "time_buckets.buckets.first.doc_count",
        "time_buckets.buckets.second.doc_count"
      ],
      "as": ["subKey", "subValue"]
    }
  ],
  "mark": "bar",
  "encoding": {
    "x": {"field": "subKey", "type": "ordinal", "axis": {"title": null}},
    "y": {
      "field": "subValue",
      "type": "quantitative",
      "axis": {"title": "Document count"}
    },
    "color": {"field": "key"},
    "tooltip": [
      {"field": "key", "type": "nominal", "title": "category"},
      {"field": "subValue", "type": "quantitative", "title": "Count"}
    ]
  },
  "layer": [{"mark": "bar", "encoding": {"color": {"field": "key"}}}]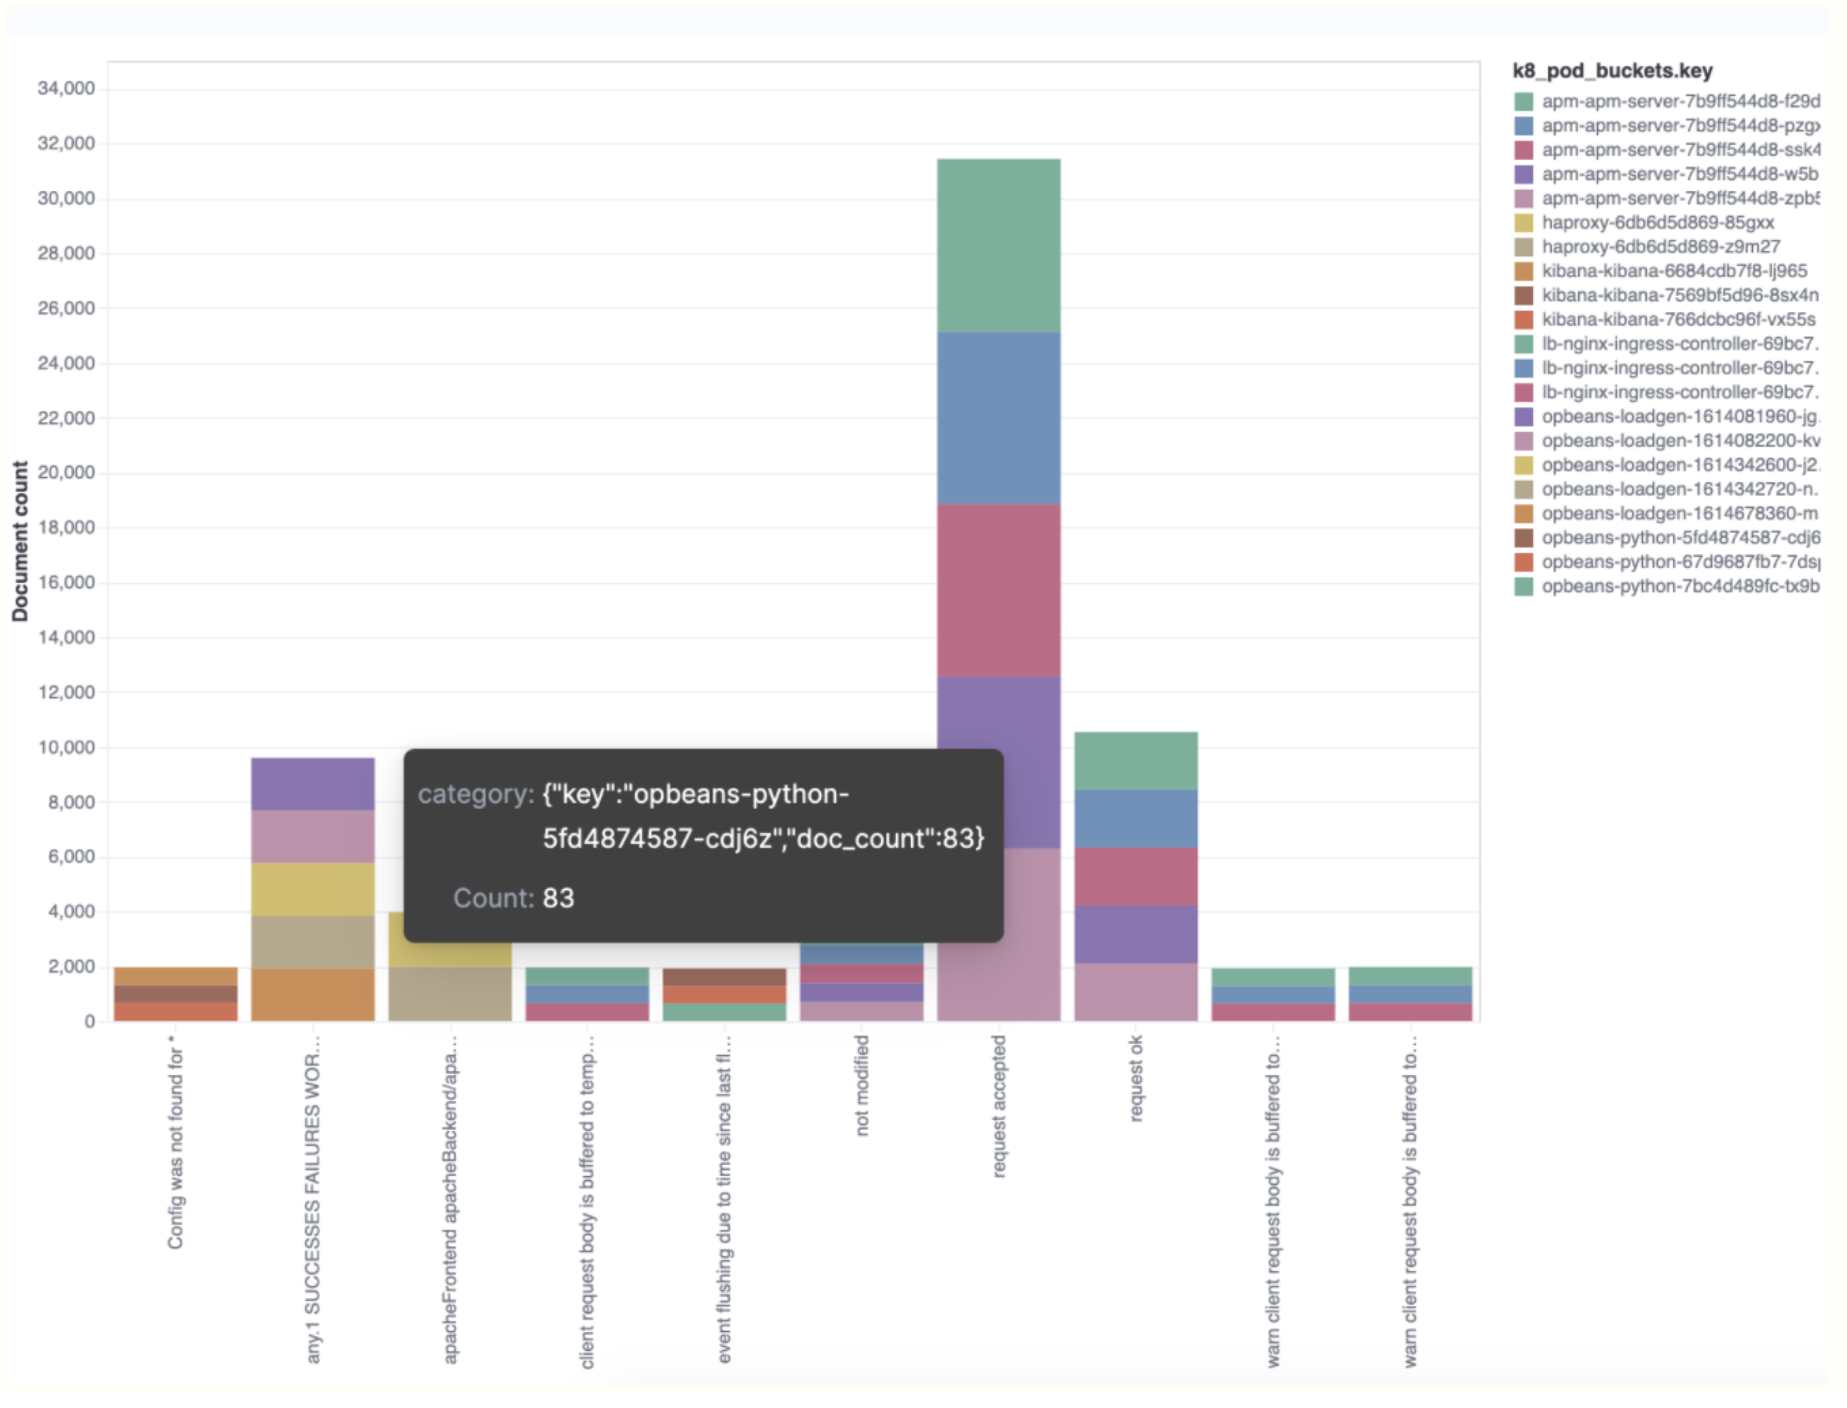
}Gathering the top categories over a terms aggregation
This terms aggregation example shows which term values are most prevalent for each category. In this particular scenario, the
Kubernetes pod is the term used.
{
  "$schema": "https://vega.github.io/schema/vega-lite/v5.json",
  "title": "Event counts from all indexes",
  "data": {
    "url": {
      "%context%": true,
      "%timefield%": "@timestamp",
      "index": "filebeat-8.0.0-*",
      "body": {
        "aggs": {
          "sample": {
            "sampler": {"shard_size": 5000},
            "aggs": {
              "categories": {
                "categorize_text": {
                  "field": "message",
                  "similarity_threshold": 20,
                  "max_unique_tokens": 20
                },
                "aggs": {
                  "k8_pod": {
                    "terms": {"field": "kubernetes.pod.name", "size": 5}
                  }
                }
              }
            }
          }
        },
        "size": 0
      }
    },
    "format": {"property": "aggregations.sample.categories.buckets"}
  },
  "transform": [
    {"flatten": ["k8_pod.buckets"], "as": ["k8_pod_buckets"]}
  ],
  "mark": "bar",
  "encoding": {
    "x": {"field": "key", "type": "ordinal", "axis": {"title": false}},
    "y": {
      "field": "doc_count",
      "type": "quantitative",
      "axis": {"title": "Document count"}
    },
    "color": {"field": "k8_pod_buckets.key"},
    "tooltip": [{
      "field": "k8_pod_buckets",
      "type": "nominal",
      "title": "category"
    }, {
      "field": "k8_pod_buckets.doc_count",
      "type": "quantitative",
      "title": "Count"
    }]
  }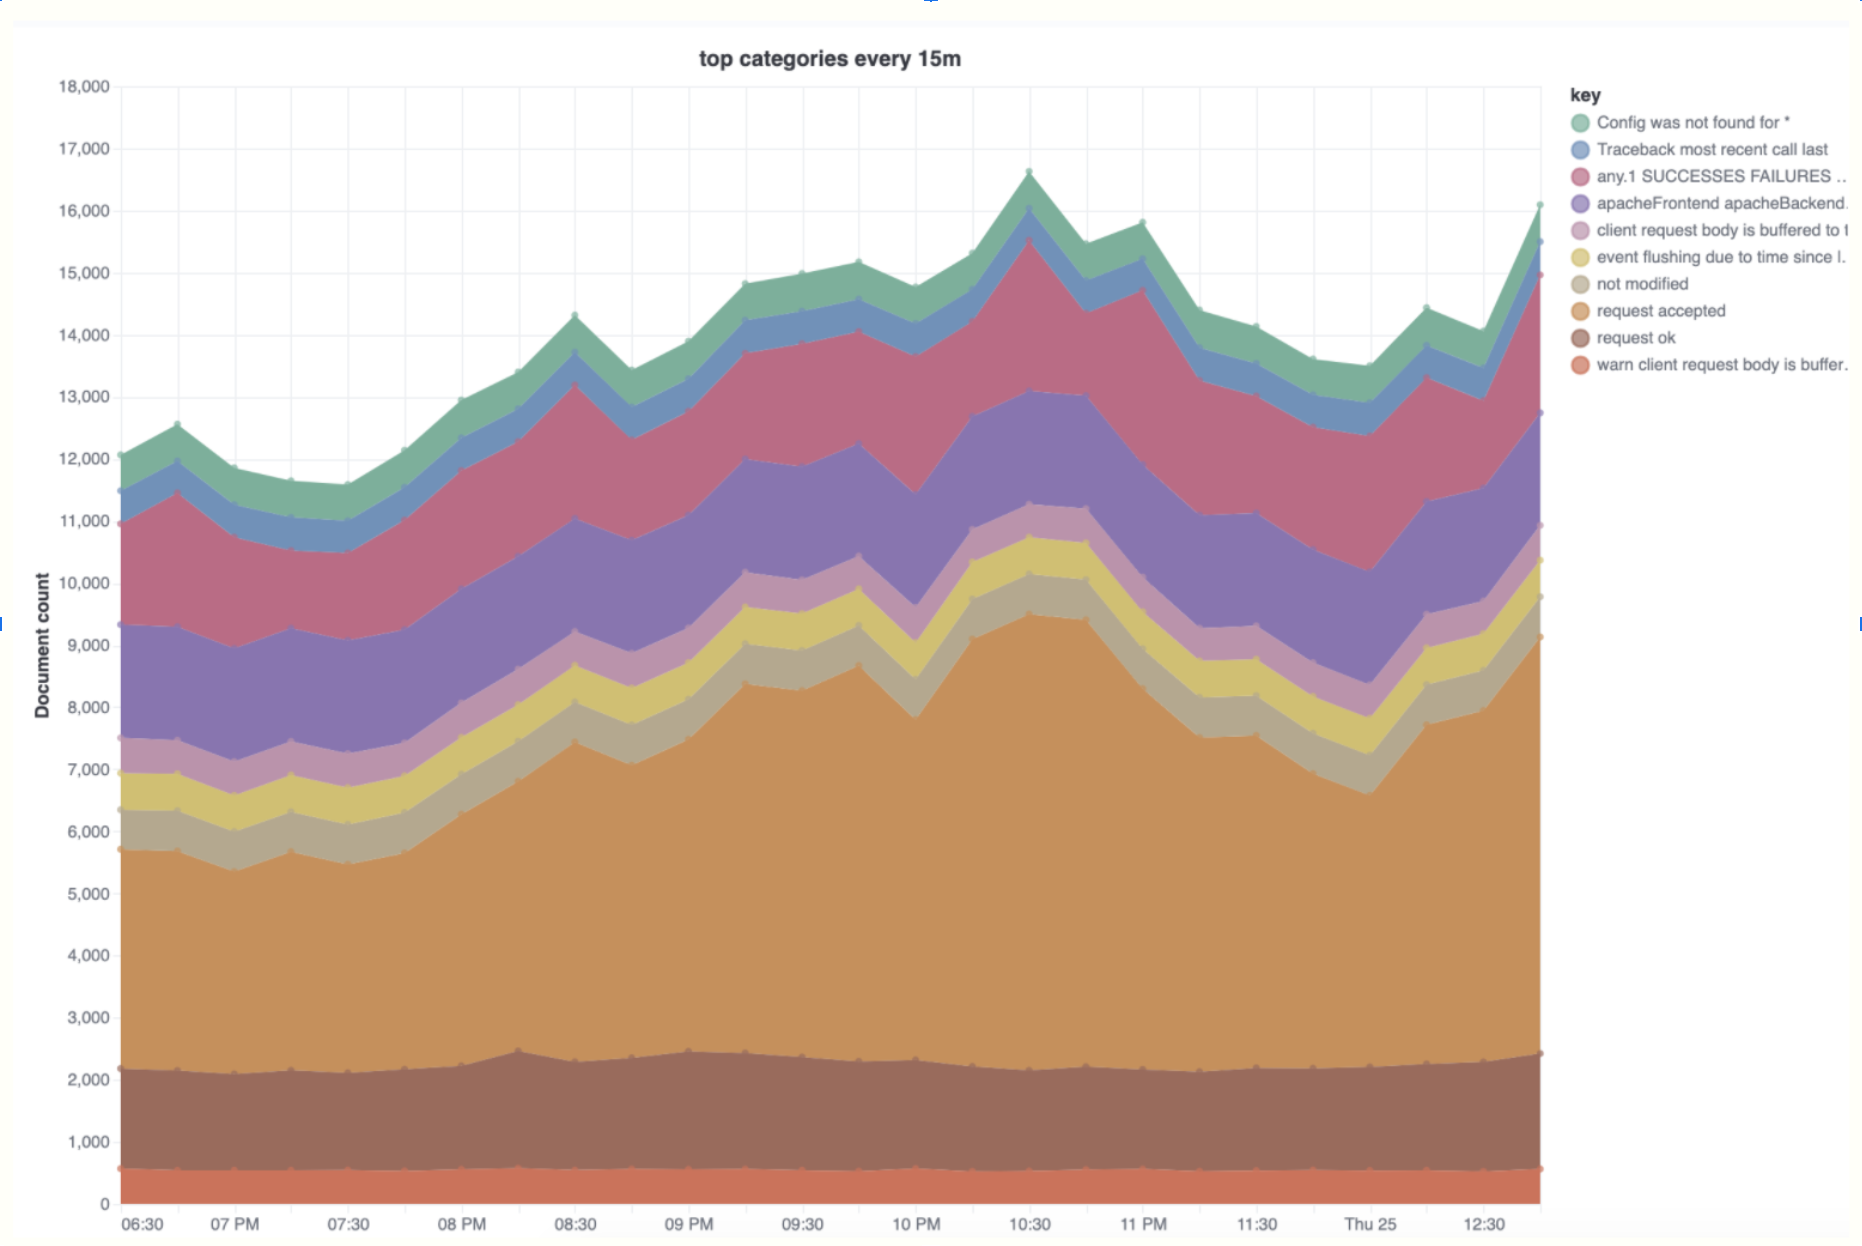
}Visualizing category trends over time
This analysis can be used to explore strange logging spikes and to help identify which categories contribute the most to spikes.
{
  "$schema": "https://vega.github.io/schema/vega-lite/v5.json",
  "title": "top categories every 15m",
  "data": {
    "url": {
      "%context%": true,
      "%timefield%": "@timestamp",
      "index": "filebeat-8.0.0-*",
      "body": {
        "aggs": {
          "categories": {
            "categorize_text": {
              "field": "message",
              "similarity_threshold": 20,
              "max_unique_tokens": 20
            },
            "aggs": {
              "time_buckets": {
                "date_histogram": {
                  "field": "@timestamp",
                  "interval": "15m",
                  "min_doc_count": 1
                }
              }
            }
          }
        },
        "size": 0
      }
    },
    "format": {"property": "aggregations.categories.buckets"}
  },
  "transform": [{"flatten": ["time_buckets.buckets"], "as": ["buckets"]}],
  "mark": "area",
  "encoding": {
    "tooltip": [
      {"field": "buckets.key", "type": "temporal", "title": "Date"},
      {"field": "key", "type": "nominal", "title": "Category"},
      {"field": "buckets.doc_count", "type": "quantitative", "title": "Count"}
    ],
    "x": {"field": "buckets.key", "type": "temporal", "axis": {"title": "category"}},
    "y": {
      "field": "buckets.doc_count",
      "type": "quantitative",
      "stack": true,
      "axis": {"title": "Document count"}
    },
    "color": {"field": "key", "type": "nominal"}
  },
  "layer": [
    {"mark": "area"},
    {
      "mark": "point",
      "selection": {
        "pointhover": {
          "type": "single",
          "on": "mouseover",
          "clear": "mouseout",
          "empty": "none",
          "fields": ["buckets.key", "key"],
          "nearest": true
        }
      },
      "encoding": {
        "size": {
          "condition": {"selection": "pointhover", "value": 100},
          "value": 5
        },
        "fill": {"condition": {"selection": "pointhover", "value": "white"}}
      }
    }
  ]
}Try it out
These examples are only the beginning of what is possible with the categorize_text aggregation released in technical preview in 7.16. Categorizing machine-generated text and the powerful aggregation framework in Elasticsearch gives you abundant opportunities for log and data exploration. Spin up an Elastic Cloud cluster today and give it a whirl. We’d love to hear your feedback — join the conversation about machine learning in Elastic in our Discuss forums or community Slack channel.
Share
- Share on Twitter
Share on Twitter
- Share on LinkedIn
Share on LinkedIn
- Share on Facebook
Share on Facebook
- Share by Email
Share by Email
- Print this page
Print