Why your Elasticsearch cluster is hitting disk watermarks: 14 real-world causes explained
Learn how Elasticsearch disk watermarks work, why they trigger, and how to diagnose 14 of the most common scenarios Support encounters, from index bloat to ILM stalls.
Elasticsearch's disk watermark system is more than an alarm: it actively responds on your behalf, stopping shard allocation at 85%, moving shards off nodes at 90%, and blocking all ingest at 95%. When it triggers, the root cause is rarely obvious. This post covers the 14 most common scenarios Support sees across index data growth, cached disk usage and ILM stalls, with the specific API calls and reasoning to diagnose each one.
How Elasticsearch disk watermark allocation works
Elasticsearch assumes all nodes within a data tier share the same hardware profile. This enables its allocation feature to distribute index shards across target nodes. Allocation sequentially computes from cluster-level settings and filters, and then an individual node's disk watermark, and finally from shard awareness.
Within these logical prerequisites, allocation runs a desired balancer component to then manage nodes' available disk through a calculation of weights of its data stream write loads, node total shard counts, nodes disk usage, and index shard distributions. Allocation and its desired balancer component calculate the next step from the current cluster state. Shards are then rerouted to asynchronously recover to target nodes which have been determined to improve the cluster's overall balancing.
Elasticsearch documentation highlights that it’s both normal for nodes to temporarily exceed the high watermark and for nodes to be using very different amounts of disk space, including within a data tier. This may happen, for example, during ingest spikes, force merge events, or between a large index’s ILM rollover, shrink, or migrate actions. Or it may happen due to large differences in shard sizes.
Elasticsearch administrators may need to review their cluster nodes' disk usage. This most commonly surfaces from Elasticsearch's health API, usually as watermark errors or from common sub-reasons of stagnant ILM indices.
# GET _health_report?filter_path=indicators.disk.status,indicators.ilm.status
{
  "indicators": {
    "disk": {
      "status": "yellow"
    },
    "ilm": {
      "status": "yellow"
    }
  }
}
Elastic recommends enabling monitoring to be alerted on these issues before the host disk fills.
Elasticsearch provides a disk watermark feature to avoid full disk issues. This feature is more than just a disk alarm, which is common in the industry, as the allocation will automatically begin responding on behalf of administrators to keep from exhausting the available disk. The default disk watermark thresholds with their summary impacts are:
Low at
85%: Allocation stops allocating more shards but still ingests into the node.High at
90%: Allocation moves shards off of the node but still ingests into the node.Flood stage at
95%: Allocation stops all ingest into the node by setting its indices to read-only. The read-only write block mode auto-unsets after node recovers off high watermark.
Note: The Elastic Cloud Hosted (ECH) deployment UI gives a red warning banner at 75%, but Elasticsearch takes no action at this time.
Disk watermark settings appear under cluster settings:
# GET _cluster/settings?include_defaults&filter_path=*.cluster.routing.allocation.disk.watermark
{ "defaults": {"cluster": {"routing": {"allocation": {"disk": {"watermark": {
    "flood_stage.frozen.max_headroom": "20GB",
    "flood_stage": "95%",
    "high": "90%",
    "low": "85%",
    "flood_stage.frozen": "95%",
    "flood_stage.max_headroom": "100GB",
    "low.max_headroom": "200GB",
    "high.max_headroom": "150GB"
} } } } } } }
How to diagnose Elasticsearch disk usage with CAT allocation
The Elasticsearch Dev team has created a single endpoint (CAT allocation) to summarize disk information to act as a single entry point in your investigations. Current disk stats report under node stats (or via mapping to CAT allocation).
Using column names as reported by the CAT allocation, the following screenshot (from a related data enhancement request) outlines the interpretation:
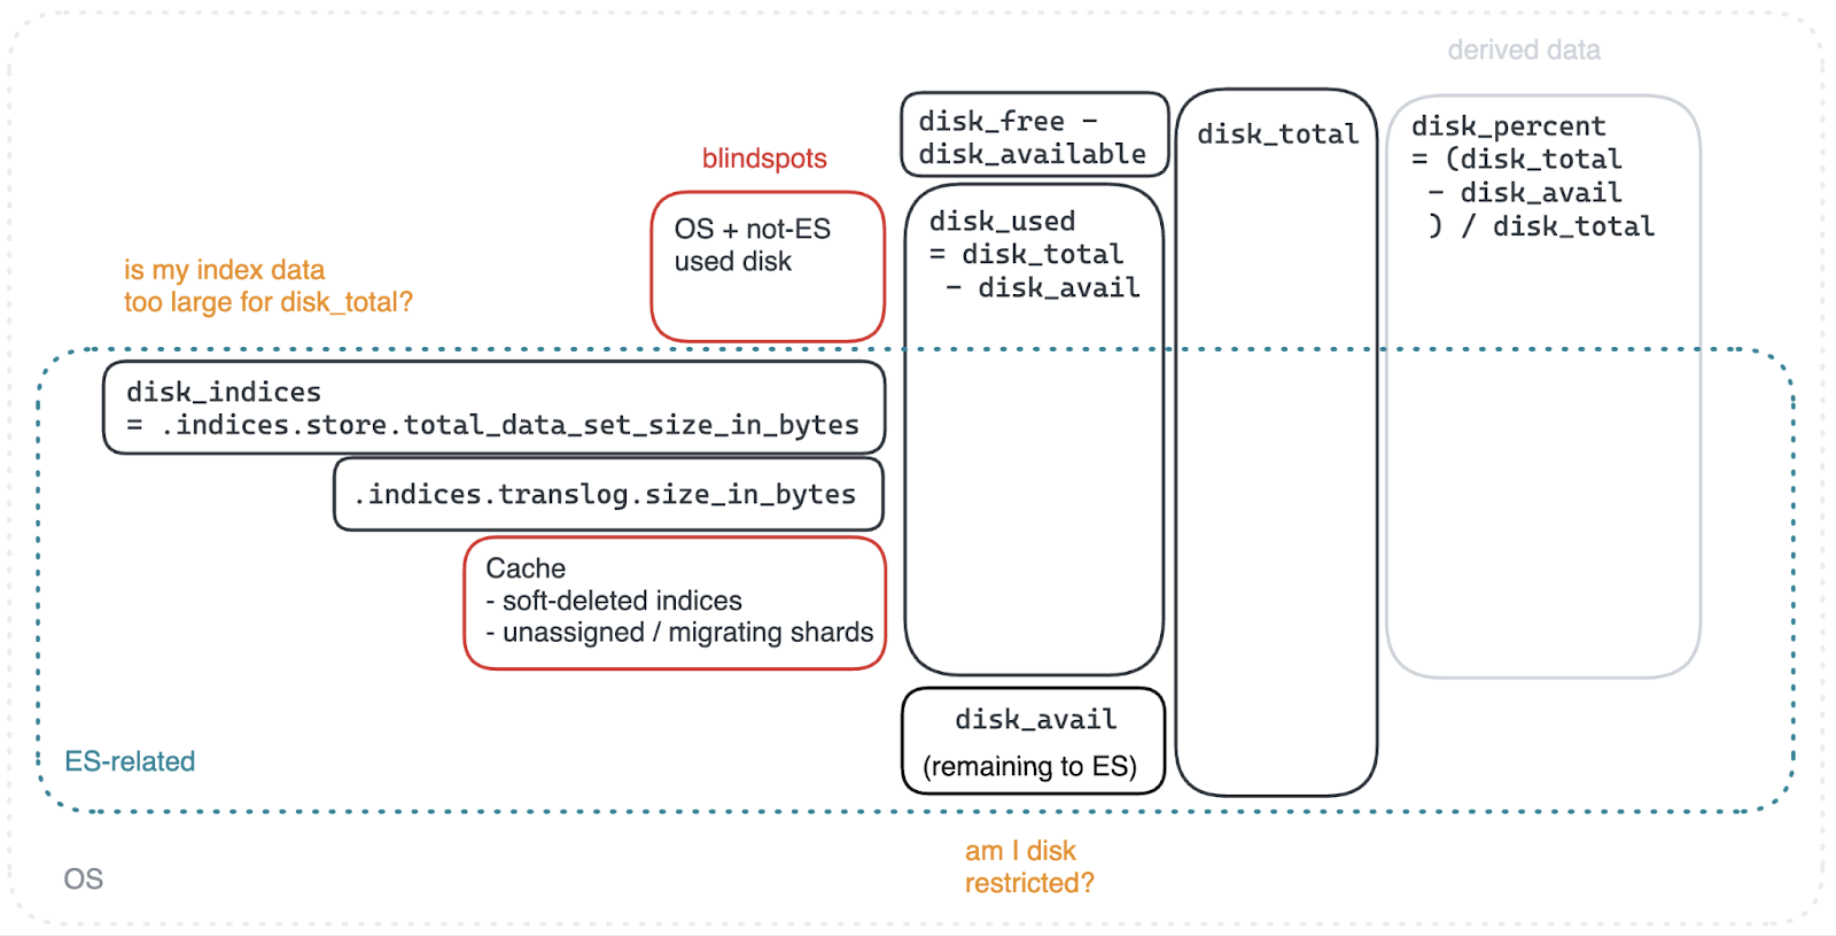
For this output, we begin problem boxing by checking for:
1. A difference in disk.total per node role within a data tier. If encountered, this cluster’s hardware isn’t evenly configured.
2. Shards marked as UNASSIGNED. If encountered, see red or yellow health status.
3. A hot-spotted node within a data tier or an entire data tier sitting above low watermark disk.percent thresholds.
Note that it’s expected for the frozen tier to report
disk.indices: 0gbwith adisk.percent: 95, since its partial searchable snapshots purposely sit in the disk cache and self-manage to not overfill the disk. This is also part of why Elasticsearch recommends dedicated frozen nodes.
4. Large differences between disk.indices and disk.used for one or more nodes.
Disk watermark issues may:
Surface from the available disk being used up via:
A separate service on the operating system (OS).
Elasticsearch service having improperly set logging retention.
Elasticsearch index data.
Elasticsearch data cache.
Either be false positive or false negative from:
Unexpected Elasticsearch disk watermark settings.
Disk watermark settings not aligned to XFS quotas (disk usage restriction tool), which surfaces via low
disk.availablewithout highdisk.used_percent.
However, we’ll focus on Elasticsearch index data and data cache inducing flood-stage disk watermark errors as the root cause of the vast majority of high severity support cases encountered in the last year. ILM is split into its own section, since it can surface under both situations. Examples are ordered by descending frequency.
Common Elasticsearch disk watermark scenarios
Disk watermark issues caused by index data
This occurs per node when CAT allocation reports disk.indices as near the watermark threshold. Default flood-stage watermark is 95%, and ECH doesn’t surface XFS quotas to Elasticsearch, so this is also when disk.indices nears disk.total for a node. Let’s consider some examples with these assumptions.
A. Index usage
For our first example, let’s review a single node cluster:
# GET _cat/allocation?v&s=node&h=node,disk.*,shards
node            	disk.indices disk.used disk.total disk.percent shards
UNASSIGNED                                                           2
instance-0000000000    11.5gb    11.8gb       12gb           96     36
This represents the classic “database almost full” disk scenario that occurs across the industry. The disk is so full that it’s refusing to allocate a newly created index’s two shards. The live index data is taking 11.5GB or 95% of the node’s 11.8GB disk storage space.
To avoid 100% disk, which, depending on OS, could show in Elasticsearch logs as no space left on the device, intervention should be performed soon. Options to consider for remediation include:
Vertically scaling (increasing disk available to node).
Horizontally scaling (increasing node counts).
Removing unneeded indices, potentially after snapshotting.
B. Index shards versus nodes
Let’s consider a second straightforward example. Now there are two nodes which are off by one shard, but one node reports 11GB more disk.indices than the other:
# GET _cat/allocation?v&s=node&h=node,disk.*,shards
node            	disk.indices disk.used disk.total disk.percent shards
instance-0000000001    11.5gb    11.8gb       12gb           96     11
instance-0000000000     0.5gb     0.8gb       12gb            0     10
To investigate, this scenario would be cross-checked against CAT shards. For this example, this occurred from an index having one primary (number_of_shards) by zero replicas (number_of_replicas) in its index settings (also written “1p0r”), which was 11gb by itself. There’s no way for Elasticsearch to balance the disk between nodes in this situation. To remediate this example, a team could consider updating index settings to add a replica which would balance disks; however, that would bring the other node into flood-stage watermark, so increasing disks needs to be considered regardless.
C. Large shard
Expanding on the previous example, let’s pretend the index’s one shard size had been 300GB. This situation surfaces more commonly to Support, where shard sizing falls outside of Elasticsearch Dev’s recommended 10–50GB sizing. Under this circumstance, Support would recommend right-sizing shards via one of the following, after ensuring disk space for index data copy:
Running split index to increase the number of primary shards.
Creating a destination index with corrected settings and then running Reindex.
For more information and caveats, see the linked guide. Ideally, this index would be fixed to target six primary shards across the two nodes to achieve the recommended maximum 50GB sizing. To force primaries to evenly distribute, you may need to set the total_shards_per_node setting.
D. Deleted docs
Expanding on this example again, for temporary relief, it may be worth investigating deleted docs. Elasticsearch periodically clears out docs.deleted from indices, as seen under CAT indices:
# GET _cat/indices?v&h=index,docs.*
index         	docs.count docs.deleted
my-index-000001       23791010      9192030
my-index-000002      187391903       	  0
While docs.deleted>0, these count toward CAT allocation’s disk.indices. Shards are immutable and, therefore, to trigger an early clean-out as desired, you may run forcemerge flagged with only_expunge_deletes, like:
POST my-index-000001/_forcemerge?only_expunge_deletes=trueE. Varied shard sizes
We’re including a historical example, since it continues to induce high Support volume until users can upgrade their stack versions. Before v8.6, Elasticsearch considered a cluster balanced if shard counts were even across a data tier, agnostic to shards’ sizing and high-ingest targets' shards-across-nodes distribution. So the cluster could end up with even shards but a widely different disk, like:
# GET _cat/allocation?v&s=node&h=node,disk.*,shards
node            	disk.indices disk.used disk.total disk.percent shards
instance-0000000002	     40.0gb    40.5gb     60.0gb         67      37
instance-0000000001	     40.1gb    40.5gb     60.0gb         67      37
instance-0000000000       1.5gb     0.8gb     60.0gb          2      37
This shows shards are balanced according to pre-v8.6 definition; however, these shard distributions may induce ingest hot spotting. Therefore, the Elasticsearch Dev team introduced desired balance in v8.6, which expanded cluster balancing heuristics to include both a data stream’s write load and each node’s disk usage. This update has mitigated most of Support’s related hot spotting case volume and has been a huge performance win.
By default, Support recommends that users upgrade to/past v8.6 when this is encountered. And, of course, Elastic generally recommends staying on the latest and greatest.
Until upgrading is possible, users may need to periodically manually intervene by:
Performing cluster reroutes to distribute high write indices across nodes.
Architecting sharding to evenly divide by ingesting node counts and then using the
total_shards_per_nodesetting.
See our index-level shard distribution section of our hot spotting guide for more context.
Disk watermark issues caused by cached data
Elasticsearch retains a data cache per node, which is seen via the difference between CAT allocation’s .disk.used - disk.indices. This cache is tracked per index and released once it has health .status:green. with no pending migration requests. So let’s review a handful of common situations.
F. Deleting an index
Deleting an index moves its used space from disk.indices to disk cache, which is then asynchronously cleared out by Elasticsearch. So, for an example 1p0r index, which is the only index on a node, deleting it would appear during sequential API polling:
# GET _cat/allocation?v&s=node&h=node,disk.*,shards
node            	disk.indices disk.used disk.total disk.percent shards
instance-0000000000	     40.0gb    40.5gb     60.0gb         67      1

# DELETE my-index-000001

# GET _cat/allocation?v&s=node&h=node,disk.*,shards
node            	disk.indices disk.used disk.total disk.percent shards
instance-0000000000	        0gb    40.5gb     60.0gb         67      0

# GET _cat/allocation?v&s=node&h=node,disk.*,shards
node            	disk.indices disk.used disk.total disk.percent shards
instance-0000000000	        0gb     0.5gb     60.0gb         0      0
Note that there may be a slight time delay for the asynchronous Elasticsearch clean-out process to trigger and complete, which is expected.
G. Replicating shard
Now let’s consider a replicating shard. While shards are recovering (for migrations or replications) as seen via CAT recovery, each node involved retains a copy until the final destination node confirms shard integrity. This lines up to when CAT indices start reporting index-level health:green.
This implies that if node instance-0000000000 was replicating to instance-0000000001 but experienced a failure and chose to try copying to instance-0000000002, all three nodes will retain a disk cache of that shard until instance-0000000002 confirms shard integrity against instance-0000000000.
Again, simplifying CAT allocation to only our index of interest for clarity, for example across time, this could appear:
# GET _cat/allocation?v&s=node&h=node,disk.*,shards
node            	disk.indices disk.used disk.total disk.percent shards
instance-0000000000       10.0gb   10.5gb     100.0gb          10      1
instance-0000000001        0.0gb    0.5gb     100.0gb           0      0
instance-0000000002        0.0gb    0.5gb     100.0gb           0      0

# GET _cat/indices?v&h=index,health,shards.*
index            health  pri rep
my-index-000001  yellow    1   1

# ( recover to instance-0000000001 )

# GET _cat/allocation?v&s=node&h=node,disk.*,shards
node            	disk.indices disk.used disk.total disk.percent shards
instance-0000000000       10.0gb   10.5gb     100.0gb          10      1
instance-0000000001        5.0gb    5.5gb     100.0gb           5      1
instance-0000000002        0.0gb    0.5gb     100.0gb           0      0

# ( shard replication failure )

# GET _cat/allocation?v&s=node&h=node,disk.*,shards
node            	disk.indices disk.used disk.total disk.percent shards
instance-0000000000       10.0gb   10.5gb     100.0gb          10      1
instance-0000000001        0.0gb    5.5gb     100.0gb           5      0
instance-0000000002        0.0gb    0.5gb     100.0gb           0      0

# ( recover to instance-0000000002 )

# GET _cat/allocation?v&s=node&h=node,disk.*,shards
node            	disk.indices disk.used disk.total disk.percent shards
instance-0000000000       10.0gb   10.5gb     100.0gb          10      1
instance-0000000001        0.0gb    5.5gb     100.0gb           5      0
instance-0000000002       10.0gb   10.5gb     100.0gb          10      1

# GET _cat/indices?v&h=index,health,shards.*
index            health  pri rep
my-index-000001  green     1   1

# GET _cat/allocation?v&s=node&h=node,disk.*,shards
node            	disk.indices disk.used disk.total disk.percent shards
instance-0000000000       10.0gb   10.5gb     100.0gb          10      1
instance-0000000001        0.0gb    0.5gb     100.0gb           0      0
instance-0000000002       10.0gb   10.5gb     100.0gb          10      1
In this situation, Elasticsearch is behaving as expected. When it’s noticed that a node’s CAT allocation shows disk.indices << disk.used, the first thing to check and resolve is cluster health to status:green and CAT indices for health:green.
H. Shard migrations
It’s also possible for indices/clusters to be green but for Elasticsearch to still be purposely caching data. This occurs during shard migrations. This commonly surfaces during ILM, which we’ll explore in the next section. For this example, we’ll consider the impact of node attributes being used in index shard allocation filtering. We’ll consider the example when allocation explain reports can_remain_on_current_node:no.
Let’s consider a situation when you update the index settings for an index such that its replica can’t remain on its current node but the node restarts while the shard is migrating off. The index starts replicating from primary shard to another node. And the restarting node rejoins the cluster before the replication process is complete. In this situation, the replica source was never lost, so the index doesn’t become status:yellow, but the desired migration was still interrupted, so the same disk cache is temporarily induced until migration is completed. This could appear:
# GET _cat/allocation?v&s=node&h=node,disk.*,shards
node            	disk.indices disk.used disk.total disk.percent shards
instance-0000000000       10.0gb   10.5gb     100.0gb          10      1
instance-0000000001       10.0gb   10.5gb     100.0gb          10      1
instance-0000000002        0.0gb    0.5gb     100.0gb           0      0
instance-0000000003        0.0gb    0.5gb     100.0gb           0      0

# GET _cat/indices?v&h=index,health,shards.*
index            health  pri rep
my-index-000001  green     1   1

# GET _cat/shards/my-index-000001?v&h=sh,prirep,state,node
sh prirep   state                node
 0     p  STARTED instance-0000000000
 0     r  STARTED instance-0000000001

# ( update index settings such that allocation explain
#   reports replica must move to instance-0000000002 )

# GET _cat/recovery?v&h=idx,sh,snode,tnode
idx             sh               snode               tnode
my-index-000001  0 instance-0000000001 instance-0000000002

# ( node instance-0000000002 is lost, replica starts
#   migrating to instance-0000000003, node instance-0000000002
#   rejoins cluster before migration's complete )

# GET _cat/recovery?v&h=idx,sh,snode,tnode
idx             sh               snode               tnode
my-index-000001  0 instance-0000000001 instance-0000000003

# GET _cat/allocation?v&s=node&h=node,disk.*,shards
node            	disk.indices disk.used disk.total disk.percent shards
instance-0000000000       10.0gb   10.5gb     100.0gb          10      1
instance-0000000001       10.0gb   10.5gb     100.0gb          10      1
instance-0000000002        5.0gb    5.5gb     100.0gb           5      0
instance-0000000003        9.0gb    9.5gb     100.0gb           9      0

# ( migration completes, shard integrity is verified,
#  disk cache releases )

# GET _cat/allocation?v&s=node&h=node,disk.*,shards
node            	disk.indices disk.used disk.total disk.percent shards
instance-0000000000       10.0gb   10.5gb     100.0gb          10      1
instance-0000000001        0.0gb    0.5gb     100.0gb           0      0
instance-0000000002        0.0gb    0.5gb     100.0gb           0      0
instance-0000000003       10.0gb   10.5gb     100.0gb          10      1
In this situation, you would need to check the shard’s allocation explain to determine what logic condition is in play causing it to migrate or preventing it from completing its desired migration.
I. Stalled migrations
The previous example can occur during node rotations if migrations become stalled. For example, if an ECH plan has updated cluster settings to exclude a node but the plan is canceled while migrating shards, then the symptoms of the previous example may surface:
PUT _cluster/settings
{"transient": {"cluster.routing.allocation.exclude._name": "instance-0000000000"}}
In this situation, you would want to either temporarily lift the cluster setting until the plan can be reapplied under Deployment>Activity or you should review the allocation explain of a shard currently hosted on an excluded node to investigate why it hasn’t migrated off.
J. Version issues
Following are some edge-case possibilities which are avoided by upgrading:
It’s historically possible for Elasticsearch to fail to retry its disk cache reaper service which was resolved v8.13.0 via elasticsearch#106544. Aside from upgrading, there’s no known work-around.
It’s also currently possible as of v9.4 that if a restarting node finds itself in flood-stage watermark due to a shard’s cache, which could hypothetically convert to
disk.indicesto take up the same space and thereby relinquish the cache, it still may not, which is being discussed under elasticsearch#104667. The only known work-around is temporarily expanding the available disk. If you encounter this in ECH, kindly contact Elastic Support for assistance.
ILM-related Elasticsearch disk watermark issues
The earlier migration examples demonstrate symptoms similar to problems which may surface during ILM migrate or shrink actions. This is because ILM automates administrative actions based on timing or logical criteria, which it then performs asynchronously on behalf of the user. So similar allocation-based issues can surface during normal administrative actions and may require the same manual interventions for ILM as would have been performed otherwise. The Elasticsearch health API has an ILM indicator to know when intervention is required, either for staying longer than expected on a particular step or for explicit errors.
K. Step errors
When ingest targets using ILM rollover are improperly set up, hot nodes may fill up due to ILM rollover errors. Since rollover automatically retries via ILM explain’s is_auto_retryable_error:true along ILM’s indices.lifecycle.poll_interval setting, these errors may appear either as failed_step_retry_count: >0 or with step:ERROR with the latest attempt’s failure message.
# GET my-index-000001/_ilm/explain
{
  "index" : "my-index-000001",
  "managed" : true,
  "policy" : "my_policy",
  "index_creation_date" : "2022-10-09T17:41:12.581Z",
  "index_creation_date_millis" : 1665337272581,
  "time_since_index_creation" : "631.68d",
  "lifecycle_date" : "2022-10-09T17:41:12.581Z",
  "lifecycle_date_millis" : 1665337272581,
  "age" : "631.68d",
  "phase" : "hot",
  "phase_time" : "2022-11-06T17:58:01.766Z",
  "phase_time_millis" : 1667757481766,
  "action" : "rollover",
  "action_time" : "2022-10-09T17:41:12.911Z",
  "action_time_millis" : 1665337272911,
  "step": "ERROR",
  "step_time" : "2022-11-06T17:58:01.766Z",
  "step_time_millis" : 1667757481766,
  "failed_step" : "check-rollover-ready",
  "is_auto_retryable_error" : true,
  "failed_step_retry_count" : 316,
  "step_info": {
	"type": "security_exception",
	"reason": "action [indices:admin/settings/update] is unauthorized for API key id [XXXXX] of user [test] on restricted indices [my-index-000001], this action is granted by the index privileges [manage,all]"
  },
  "phase_execution" : {
	"policy" : "my_policy",
	"phase_definition" : {
  	"min_age" : "0ms",
  	"actions" : {"rollover" : {"max_age" : "30d", "max_size" : "50gb" } }
	},
	"version" : 1,
	"modified_date" : "2021-12-13T16:25:49.356Z",
	"modified_date_in_millis" : 1639412749356
  }
}
If a failure message doesn’t currently show, but failed_step_retry_count: >0, we recommend reviewing the ILM history index and searching for the problematic index for more information. For this index’s error, a user with insufficient privileges last edited the ILM policy and it should be resaved either after the user is given sufficient privileges or by another user with sufficient privileges. Related elasticsearch#72856 is discussing potentially making ILM execution user-agnostic in the future.
L. Why is my hot tier filling up despite having later data tiers?
Since ILM helps move data from higher to lower temperature data tiers, the latter data tiers’ absence or watermark issues can back up earlier ones. For example, let’s say we have a high-ingest ILM policy set to roll over in hot after one hour, immediately move to frozen, and delete after three days. But if the frozen tier doesn’t exist within the cluster, since ILM executes sequentially, those indices would never delete and would quickly cause the hot-tier disk to fill up with disk.indices. So we might have something like:
# GET _cat/allocation?v&s=node&h=node,disk.*,shards,role
node                disk.indices.forecast disk.indices disk.used disk.avail disk.total disk.percent shards role
UNASSIGNED                                                                                             103
instance-0000000003                 189gb      161.4gb   161.6gb     18.3gb      180gb           89    120 himrst
instance-0000000007               135.2gb      109.6gb   179.9gb      7.1mb      180gb           99     41 himrst
Where the health report’s ILM indicator flags multiple migration stagnant indices:
# GET _health_report?filter_path=indicators.ilm.status,indicators.ilm.symptom,indicators.ilm.details
{ "indicators": { "ilm": {
    "status": "yellow",
    "symptom": "65 indices have stayed on the same action longer than expected.",
    "details": {
      "stagnating_indices_per_action": {
        "allocate": 0,
        "shrink": 0,
        "searchable_snapshot": 0,
        "rollover": 0,
        "forcemerge": 0,
        "delete": 0,
        "migrate": 65
      },
      "policies": 61,
      "stagnating_indices": 4,
      "ilm_status": "RUNNING"
    }
} } }
Investigating the ILM explain with third-party JSON tool jq in a Bash terminal, we can confirm this:
# GET _all/_ilm/explain?human&expand_wildcards=all
$ cat ilm_explain.json | jq -c '.indices[]|select(.managed==true)|.phase+"/"+.action+"/"+.step' | sort | uniq -c | sort -r
  65 "frozen/searchable_snapshot/wait-for-data-tier"
  33 "hot/rollover/check-rollover-ready"
   2 "hot/complete/complete"
$ cat ilm_explain.json | jq -c '.indices[]|select(.managed==true)|.step_info.mes
sage' | sort | uniq -c | sort -r
  65 "no nodes for tiers [data_frozen] available"
  35 null
So to resolve hot-disk watermarks, you would need to add frozen nodes. If these indices are caught waiting on the frozen step for multiple days, you might just consider manually deleting the index. For our example, we only expect indices to be at most one day plus one hour old, based on how min age calculates, but we have data showing seven days.
$ cat ilm_explain.json | jq -c '.indices[]|select(.managed==true)|.age' | sort | uniq -c | sort -r | head -4
  24 "7d"
  20 "4d"
  20 "5d"
  10 "6d"
Elastic Cloud can handle autoscaling on your behalf to avoid these issues.
M. Why are ILM indices stuck on the migrate step?
Next, let’s consider a more common historical example. Before Elasticsearch officially had data tiers, users would use custom node attributes to delineate their box types. This is largely deprecated with the migration to node roles, but every so often you find a cluster with a partial migration. Similarly, although alternatively, while data tiers assume equal hardware profile per data tier, some edge use cases do still use custom node attributes in conjunction with ILM. We’ll explore the first, since unexpected custom node attributes conflating with ILM is vastly more common.
This time, let’s say we have a hot and warm tier and the hot tier is almost full, while warm is completely empty. ILM is supposed to immediately migrate data after a one-hour rollover again. As with the previous example, ILM’s health report will still report stagnant indices, but this time it would be:
# GET _all/_ilm/explain?human&expand_wildcards=all
$ cat ilm_explain.json | jq -c '.indices[]|select(.managed==true)|.phase+"/"+.action+"/"+.step' | sort | uniq -c | sort -r
  30 "warm/migrate/check-migration"
  10 "hot/rollover/check-rollover-ready"
Sometimes the step_info.message will report the exact allocation message, but other times you need to run allocation explain (with its common outputs) in order to see why the shard is unable to move to warm nodes.
# GET _cluster/allocation/explain
# {"index": "my-index-000001", "shard": 0, "primary": true}
... # long output so shortened to a snippet of the shard's current hosting hot node
"deciders": [
  {
    "decider": "filter",
    "decision": "NO",
    "explanation": """node does not match index setting [index.routing.allocation.include] filters [box_type:"hot"]"""
  },
  {
    "decider": "data_tier",
    "decision": "NO",
    "explanation": "index has a preference for tiers [data_warm] and node does not meet the required [data_warm] tier"
  }
]
...
This example shows a conflicting requirement for the shard to simultaneously be on hot nodes as well as warm.
Elastic recommends that users allow ILM migrate (default enabled) to move data between data tiers. This can be disabled to use ILM allocate with custom attributes instead. Technically, both can also be used at the same time. However, as this example demonstrates, if both are used they need to be carefully crafted to not conflict. Particularly as ILM runs allocate before migrate, you don’t want to end up with blocking allocation settings on the first step, which would resolve by the end of the second; your settings need to be valid within each step individually.
N. How does min_age interact with rollover in ILM?
Above, we mentioned ILM rollover implication against a phase’s min_age setting in passing, but let’s give it its own example. As users balance targeting Elasticsearch’s 10–50GB shard size recommendation with index date lifecycle, they may balance the various of the rollover trigger options. For us, let’s say from index creation the index will roll over with its defaults:
# GET _ilm/policy/ilm-history-ilm-policy?filter_path=*.policy.phases.hot.actions.rollover
{"ilm-history-ilm-policy": {"policy": {"phases": {"hot": {
    "actions": {
      "rollover": {
        "max_age": "30d",
        "max_primary_shard_size": "50gb"
      }
    }
} } } } }
So as long as none of the index’s primary shards hit 50GB, our index will be ingesting into the hot node until it rolls over at that max_age:30d. The question is what happens just after that. This depends on the policy’s next phase’s min_age, which, for our example, will be a warm tier again. By default, this is min_age:0ms, like so:
# GET _ilm/policy/ilm-history-ilm-policy?filter_path=*.policy.phases.warm.min_age
{ "ilm-history-ilm-policy": {"policy": {"phases": {
    "warm": {
      "min_age": "0ms"
    }
} } } }
A phase's min_age is calculated from the index's rollover timestamp, but if the index hasn’t been rolled over, then the age is the same as the creation_date for the index. Users sometimes miscalculate min_age versus age based on the total time they want data to sit in a tier, but they often forget to subtract the time it took for the index to roll over.
Because the rollover time wasn't subtracted, the index moves to the warm tier immediately after rolling over. This doesn’t produce an immediate error. However, because data is moving to the warm tier faster than potentially intended, it can eventually cause disks to fill up and trigger watermark issues.
Get help with Elasticsearch disk issues
From what I see in Elastic Support, that's the rundown of the most common cluster disk issues. Hopefully, you now know the theory and resolution steps, too.
At this point, though, if you’re stuck resolving an issue, feel free to reach out. We’re here and happy to help! Contact us:
The release and timing of any features or functionality described in this post remain at Elastic's sole discretion. Any features or functionality not currently available may not be delivered on time or at all.