Analyzing online search relevance metrics with the Elastic Stack
Every great data-driven product starts with a series of questions. What problem are we trying to solve? Who is our target user? How are we going to measure success? Building a great search experience is no different. We need to understand what a user is looking for, translate that into a meaningful search experience, and then measure if the user’s “information need”1 has been satisfied — if they found the result(s) they needed no matter how they expressed their query.
Maybe it’s obvious when some features of an app or website are successful, but how do you know when a search (or searcher) is successful? We might need to ask if the user found something of interest. Or how long it took them to do so. We can consider the amount of effort put into their search. Did they have to try clicking on multiple results? Did they have to retype their queries in different ways, trying different word combinations or spellings?
These are all questions that online search relevance metrics can answer. In this post, we’ll explore how to collect events from a search application and ingest them into Elasticsearch to build granular metrics and dashboards of commonly used online search relevance metrics.
To help illustrate the concepts outlined here and to provide a framework for implementing this approach on your own, we’ve created an accompanying repository of code and configuration. It consists of a simulation for generating behavioural events and all the configuration you need for Elasticsearch. The code should be self-contained and everything that is talked about in this post has a corresponding implementation example. Walking through the README should help you get everything setup and running. Feedback and pull requests are always welcome.
What are online search relevance metrics?
Before we begin, let’s take a moment to consider just what online search relevance metrics actually are. It’s a mouthful just to say that phrase, so let’s break it down to understand what we’re focusing on here.
Online
Online refers to the fact that we are using behaviour from real users to calculate metrics. We typically mine logs or collect events emitted directly from a search application to track user behaviour. This is contrasted with offline metrics which are typically calculated from expert user judgments. In this scenario, we sit down a bunch of expert users of the search application (domain experts) and ask them to judge the search results. We might ask them if the result in the first position was relevant and if so how relevant was it on a scale of 0 to 4 (0 being not relevant at all). Unfortunately, human judgements are quite expensive and slow to collect since we have to train a bunch of people to actually do the job!2
Search
Ok, of course all metrics related to search are...well...search metrics. What is important to call out is that the metrics described in this post and the accompanying project are aimed at a specific kind of search experience: a traditional one-box search with pages of list-based results. These are probably the most common search experiences, but if you happen to have a grid-based layout for results or perhaps some other type of interface, you will have to reconsider the types of metrics you will need and the semantics of the user behaviour events that you will emit and use.
Relevance
When we talk about relevance we’re referring to that idea of how close to answering a user’s “information need” we can get. An information need is something that the searcher has in mind about what they would like to find or know. A query is then the explicit formulation of the user’s information need. The fun part comes when there is a gap between the information need and the query. For example, if I’m searching for “shovel” at a hardware store website, but I type in “shvel” instead, the gap between my need and the query is just a misspelling which can easily and automatically be corrected for.3 When we measure search relevance, what we’re interested in measuring is how well we fulfil the information need as expressed through the query.4
We can also have non-relevance metrics and information that is also useful but in different ways. Take for example a metric showing the 95th percentile of the query duration, or the amount of time a search query took to execute. This isn’t directly tied to relevance but of course it matters. Other information we might want to look at (and will include in the simulation project) is information about the query distribution often expressed as a table of top queries or query terms. These kinds of non-relevance metrics and associated information are crucial to help understanding the search experience and can actually be used to help tune the relevance. However since they don’t relate to how well we are addressing users’ information needs they aren’t relevance metrics themselves.
Metrics
Metrics are our way of understanding what users are doing and how successful they are in the search experience. However, metrics are only a representation of relevance as they include many biases in the data and other sources of noise. There is a famous saying about models (statistical or scientific) stating that, “All models are wrong, but some are useful.” The same holds true for metrics. We use metrics to guide us in relevance tuning and understanding where to make improvements to the search experience, however we will need more sophisticated tools such as A/B testing and result interleaving to accurately make statements about improvements between versions of a search algorithm. These are all topics that are unfortunately out of scope for this post but it’s important to understand that there are limitations to metrics. What we can do with relevance metrics is make statements like, “Is this search experience providing relevant results or not?” and that is a great place to start!
Walkthrough
Calculating online search relevance metrics starts with capturing user behavior events through the search application. For most search experiences and for the purposes of this post, we’ll be using three types of events: query, page, and click. We’ll use “search application” to encapsulate all of the systems in the stack before your search engine (e.g. Elasticsearch). It includes any backend microservices and your frontend client such as a mobile app or website.
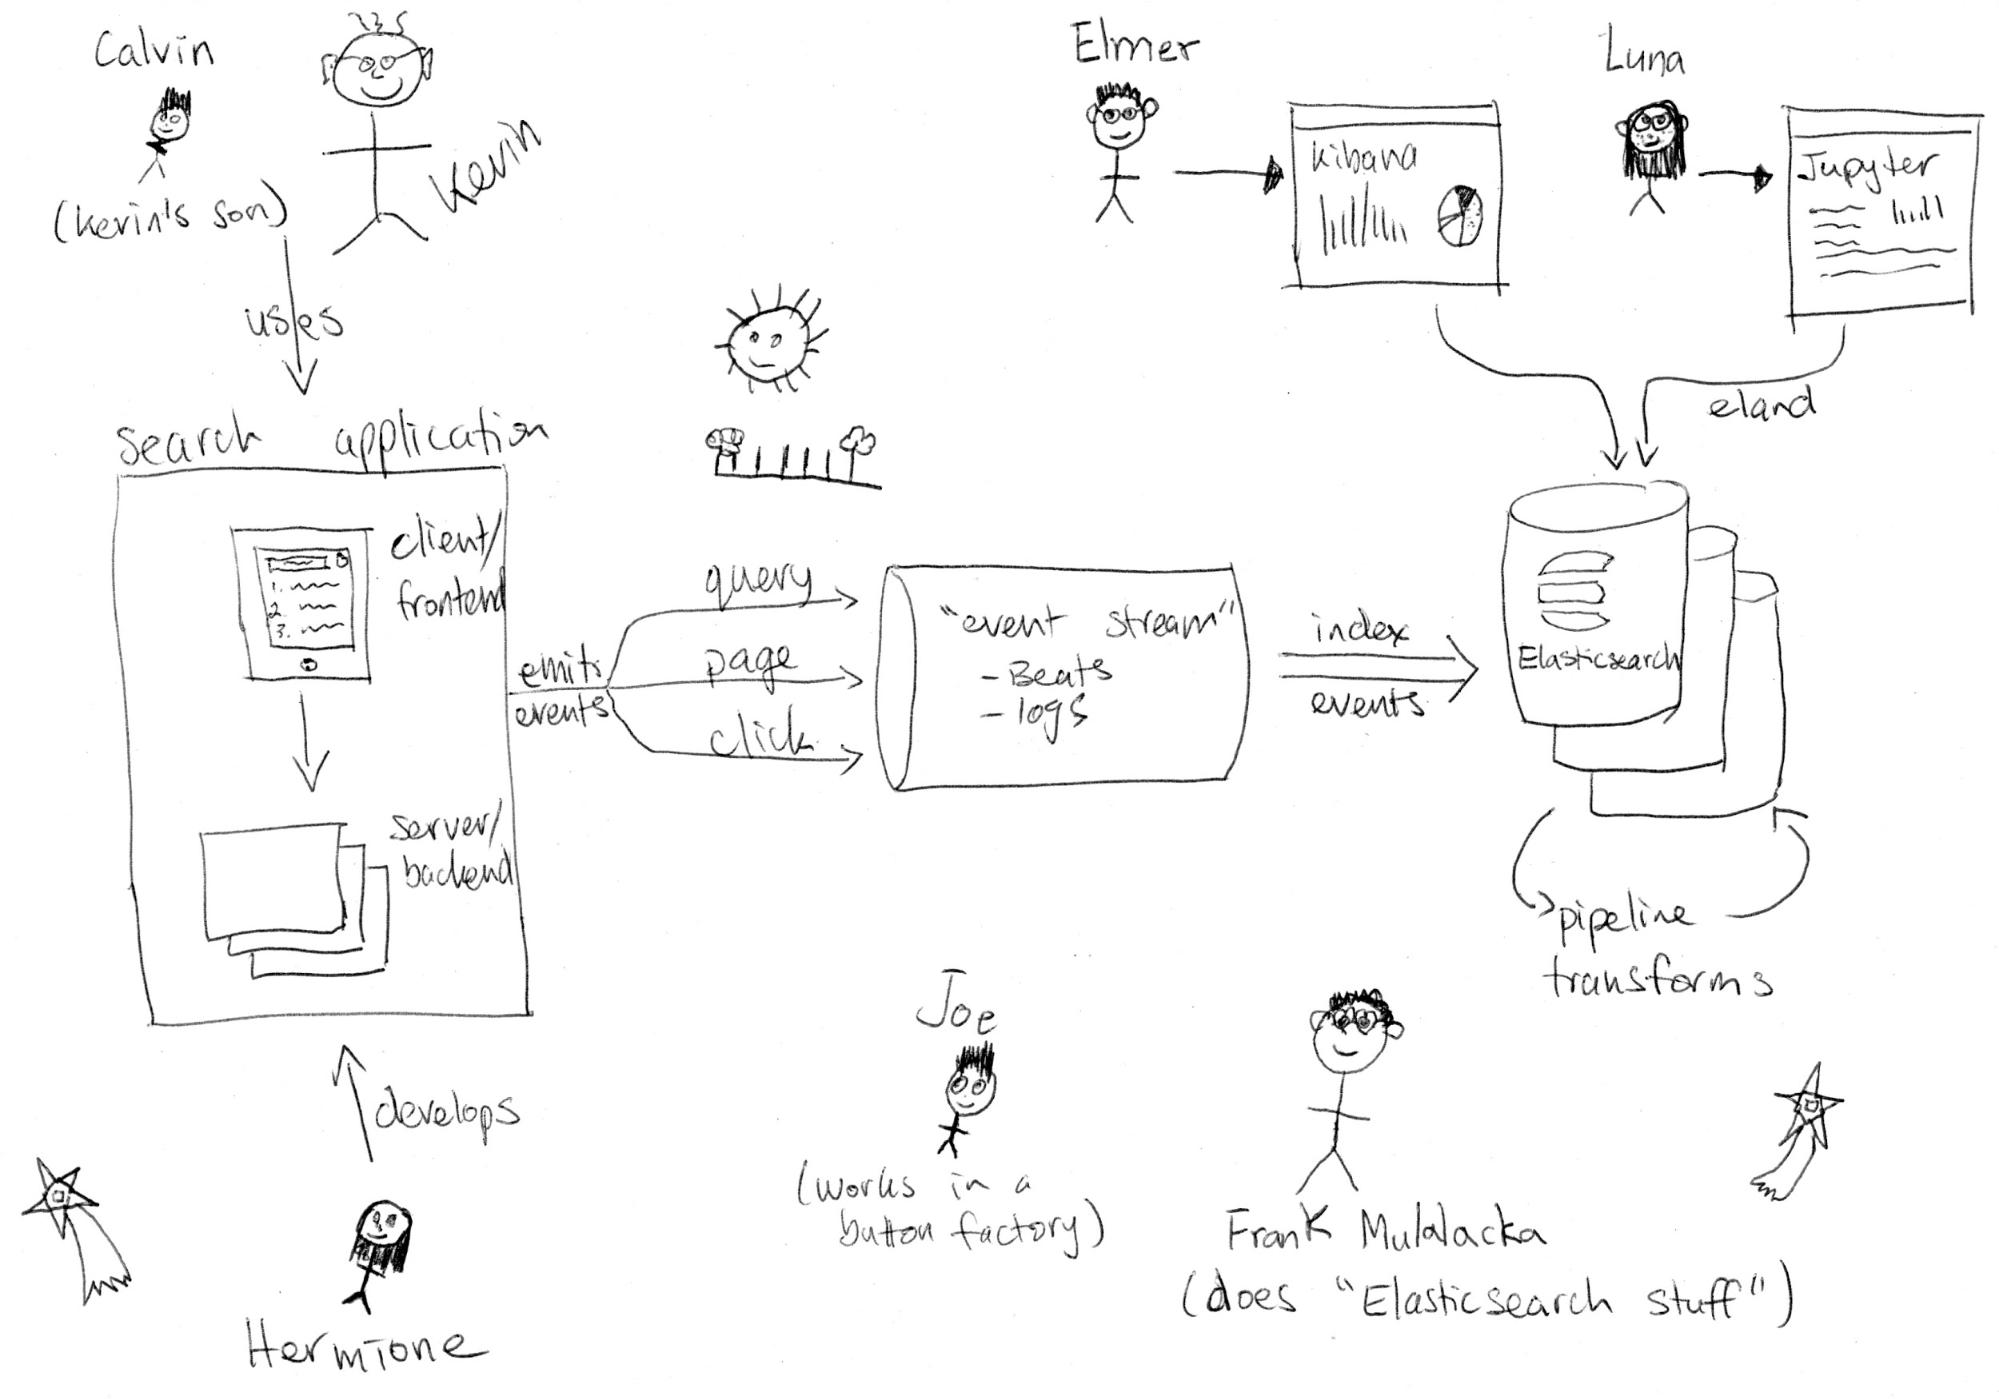
Emitting events
When a user interacts with search and issues a new query, a query event is emitted from the search application. When a user paginates to subsequent pages of results, a page event is emitted. Finally, when a user interacts with a search result in any way, such as clicking through on a search result, a click event is emitted. What ties this solution together is the use of a random and opaque ID (e.g. a UUID) that is generated with the first query event and carried through to all subsequent page and click events. This is what we’ll refer to as the search query ID (and we’ll be talking about this a lot in the future).
The semantics of when to issue a query event (and thus generate a new query ID) are also important. We assume that every unique query string, set of filters, etc. are also unique query events since they alter the result set. That means, if a user types “foo” and gets search results, then reformulates the query to “foo fighters” and gets new search results, we consider those as two separate searches and thus will generate two unique query events with unique query IDs. For a single query, if the user moves to the next page, we’ll just emit a page event since the results are not changing, we just want to track pagination effort and results that the user has seen. As you can imagine, this does put some onus on the search application to generate a new query ID and emit query events when those criteria are met, but it’s well worth the effort to encode these semantics correctly.
Ingesting events
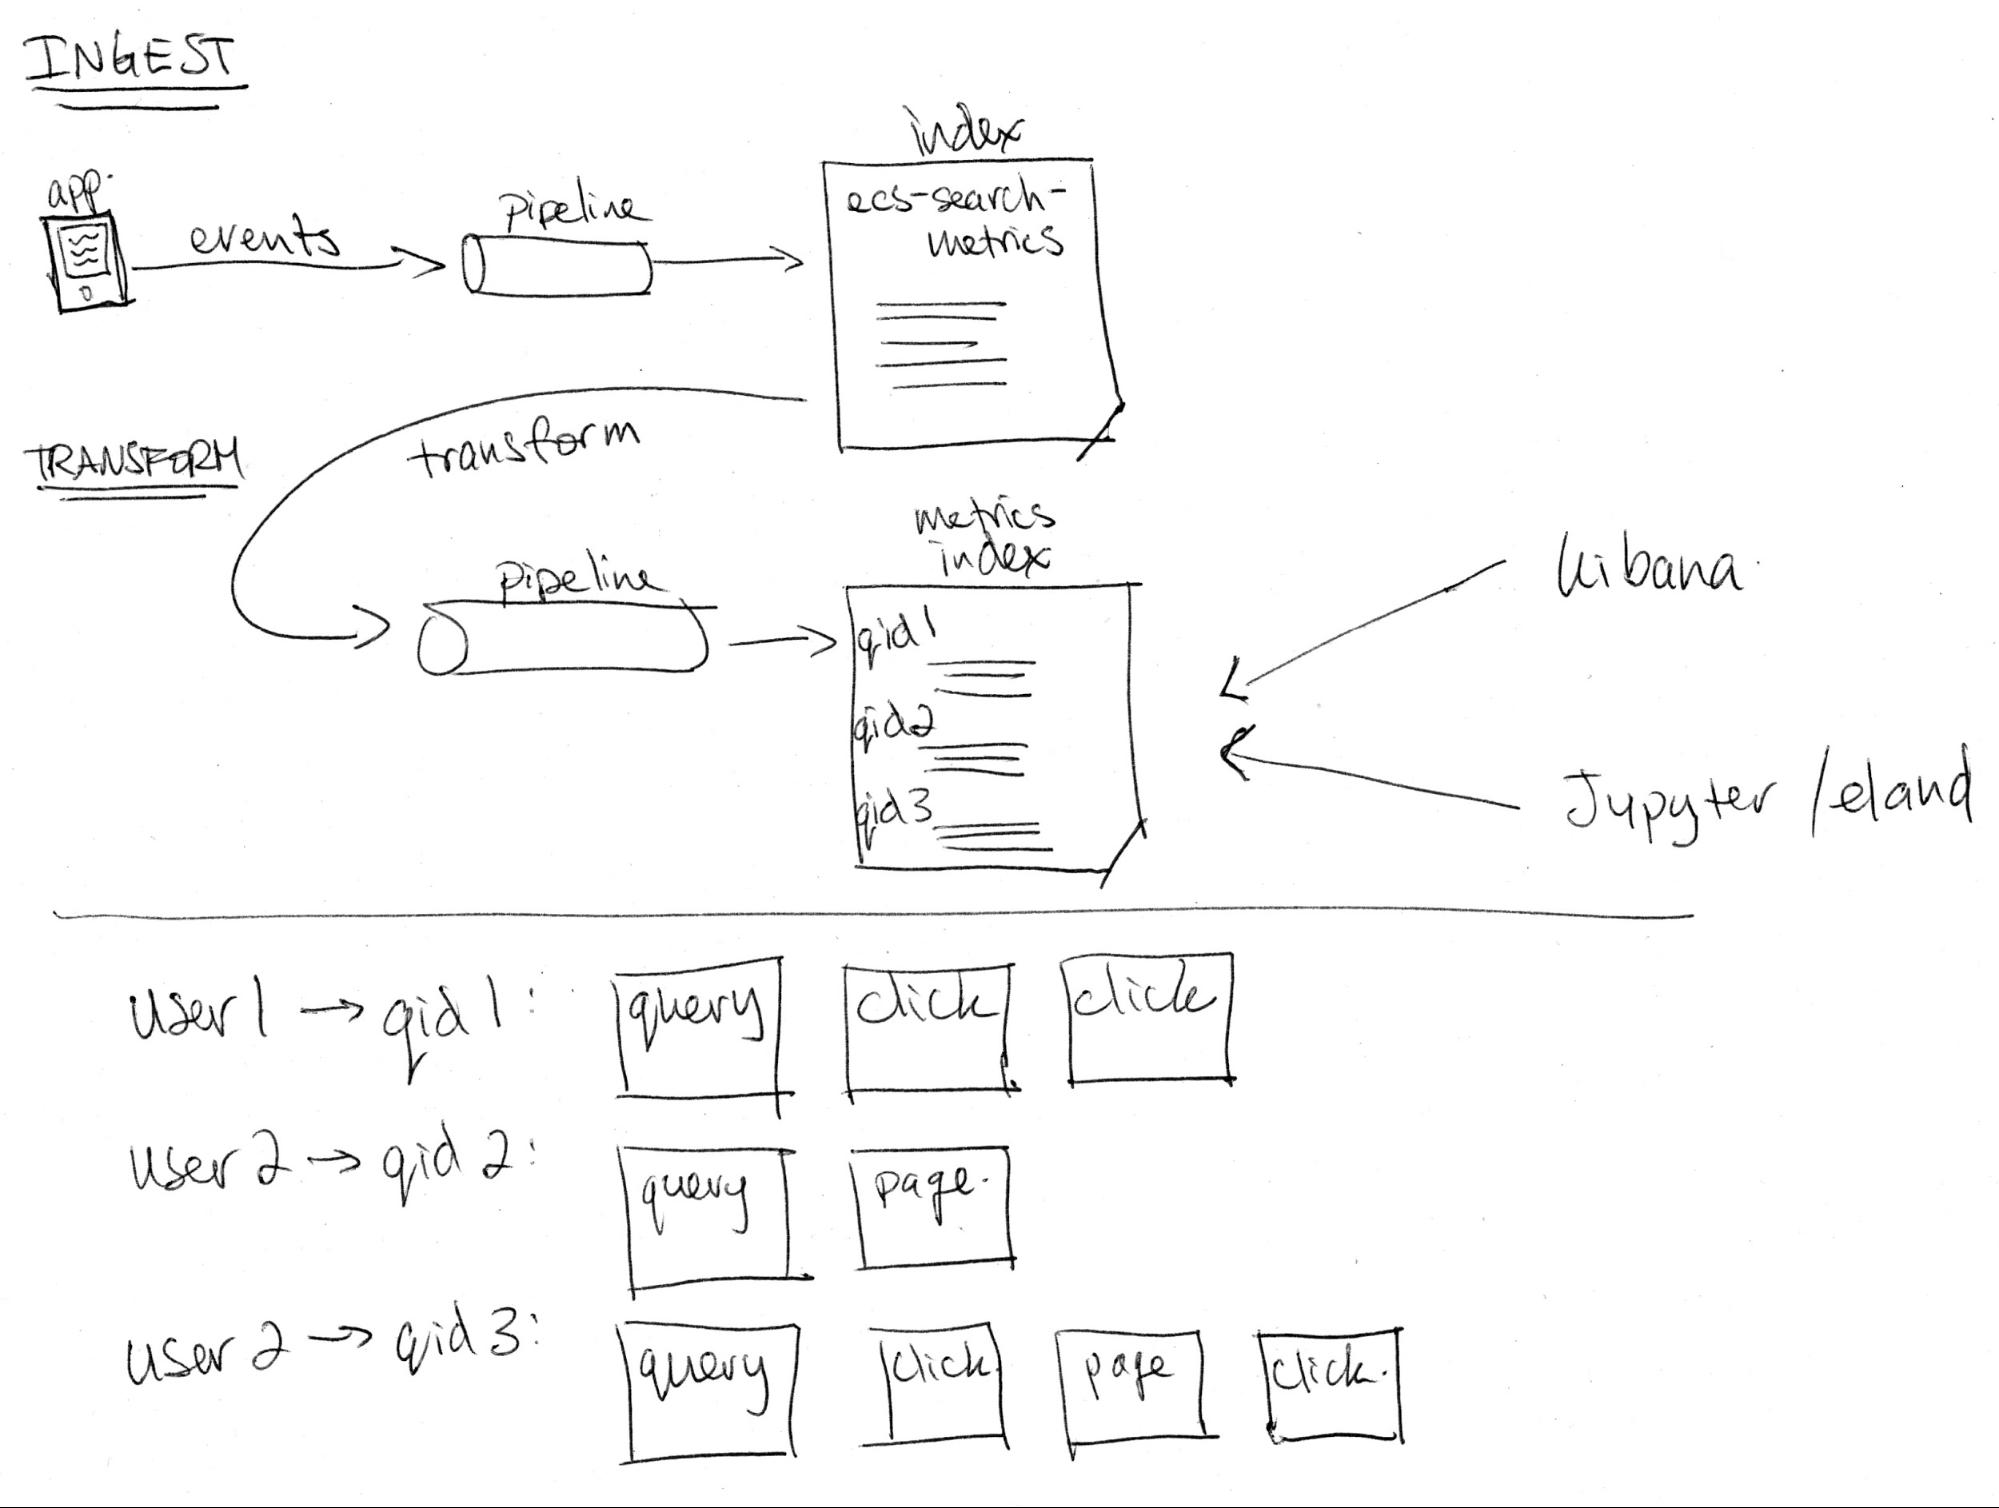
Once we have events being emitted by the search application, we’re ready to have them ingested into an Elasticsearch cluster. In most cases this will happen in near real time using Filebeat with log files or perhaps through an existing event streaming system. Alternatively, you can collect events in a 3rd party library or analytics system and export them in batches into Elasticsearch. The size and location (cloud or on-premises) of your Elasticsearch cluster will depend heavily on the event throughput and amount of historical data you’d like to store. Using the Elasticsearch Service on Elastic Cloud is a perfect way to manage an analytics cluster like this, and scale to whatever size and shape of data you might need. Any way you host it, we’re going to be using a new feature called transforms so make sure you’re using version 7.7 or higher.
Transforming events into per-query metrics
Now that we have behavioural events from the search application in Elasticsearch, we can use transforms5 to group events by the unique search query ID. The transform will output to a new index that will store the per-query relevance metrics by grouping events by the search query ID and calculating statistics of all events belonging to the same query. Aggregate metrics such as the average click-through rate (CTR) over a period of time will be done in the last step.
As an example, consider the following sequence of events from a single user searching for documentation on elastic.co (note that these are simplified events schemas):
- query
Event ID: eid-001
Query ID: qid-001
Value: "machine learning API"
Page: 1
- click
Event ID: eid-002
Query ID: qid-001
Position: 2
Document ID: https://www.elastic.co/guide/en/machine-learning/7.7/ml-api-quickref.html
- page
Event ID: eid-003
Query ID: qid-001
Page: 2
- click
Event ID: eid-004
Query ID: qid-001
Position: 12
Document ID: https://www.elastic.co/guide/en/machine-learning/7.7/create-jobs.html
Grouping the above events by query ID, counting the number of clicks (on any page), and the number of clicks at position 3 (before or in position 3) would result in the following document:
Query ID: qid-001
Number of clicks: 2
Number of clicks at 3: 1
Aggregate metrics
In the previous step, we calculate per-query metrics. These are granular metrics based on a single user’s unique query and any subsequent actions. The next level of metrics comes from aggregating all of the per-query metrics into statistical summaries that show a metric over a period of time and over all users and queries in that timeframe.
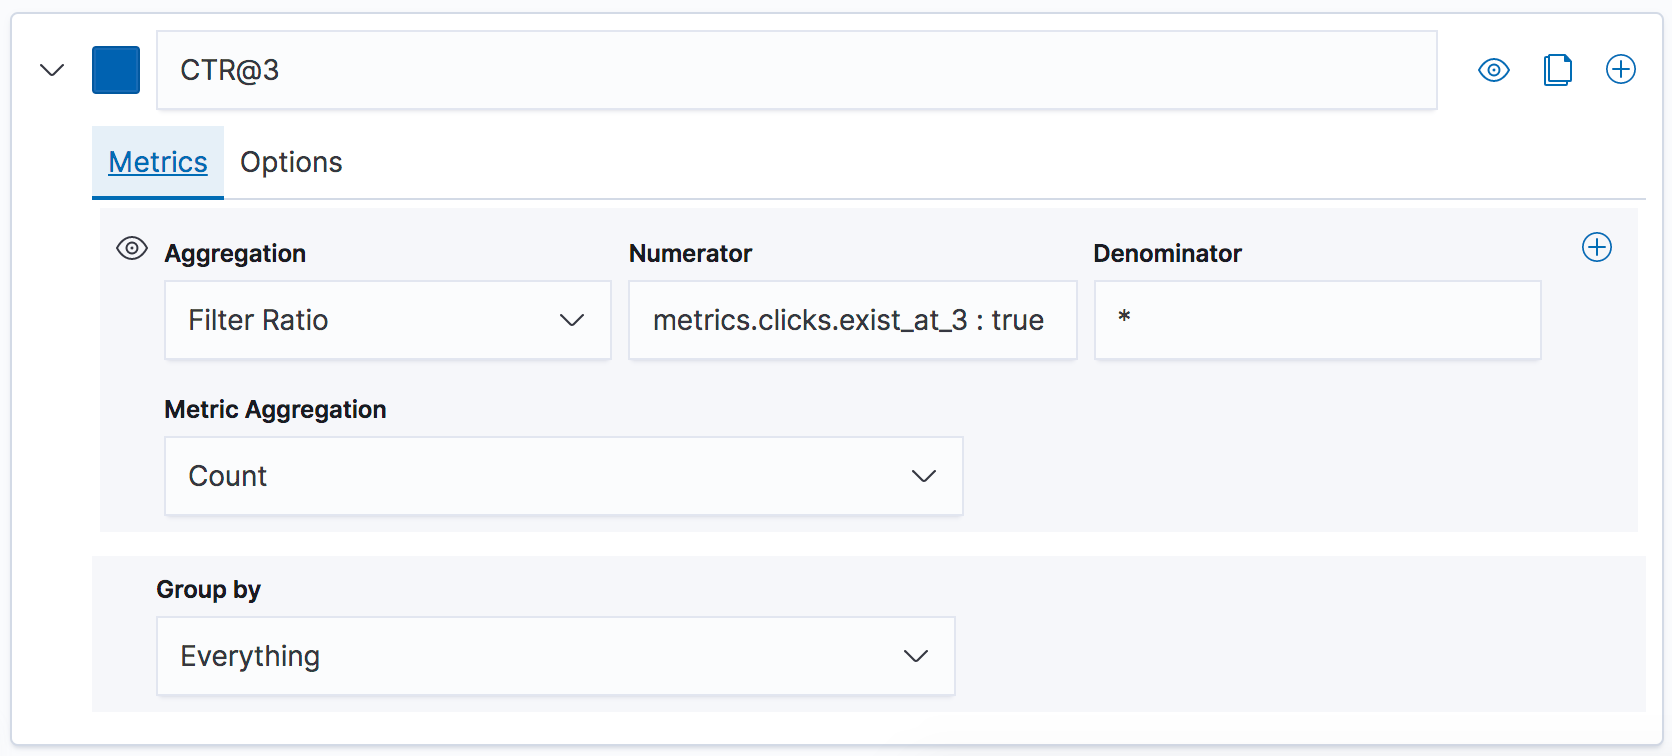
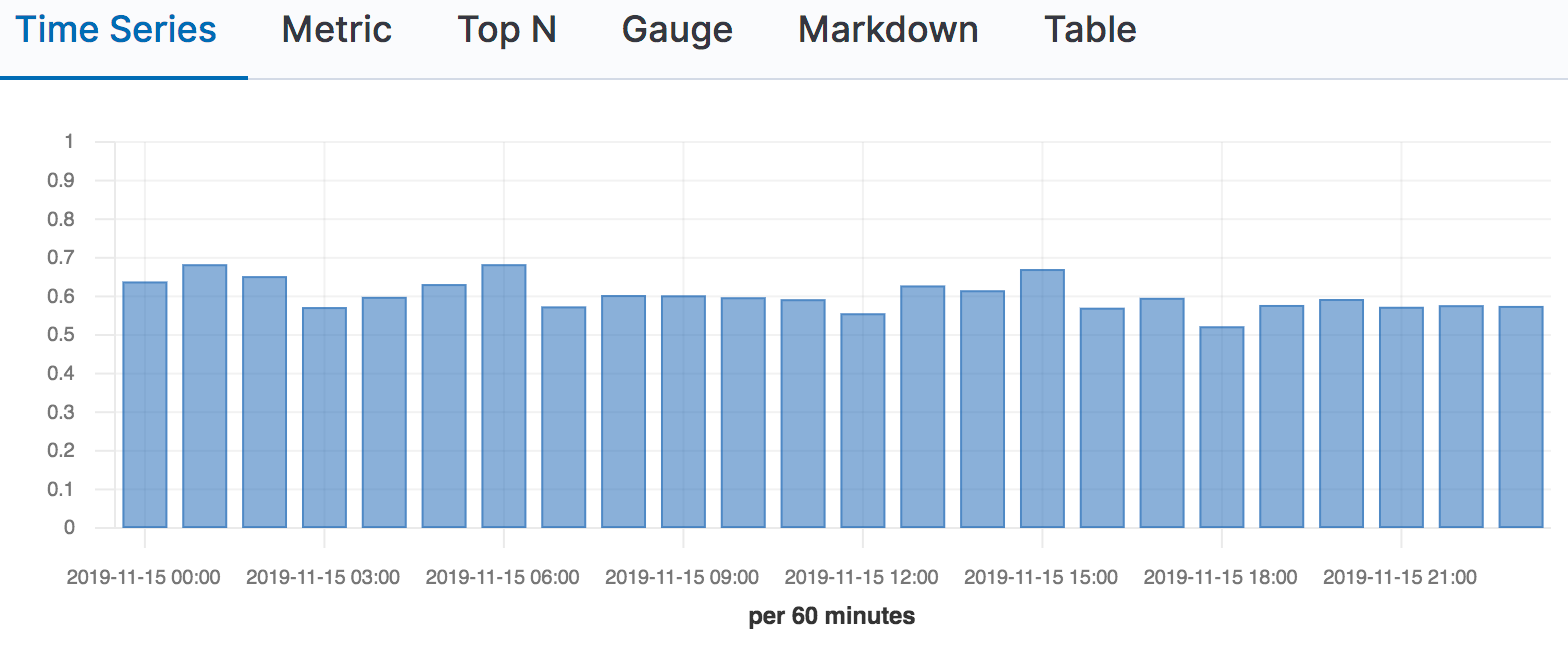
As in the example above, if we calculate the number of clicks at position 3 in the transform per-query, we can then count the number queries that have clicks at 3 over a period of time such as a day, week or month. When we find the proportion of queries with clicks at 3 vs all queries with clicks, we get the click-through rate (CTR) at position 3 (CTR@3). In Kibana, we can use a simple TSVB time series chart and a filter ratio calculation.
Aggregation is typically done ad-hoc or at analysis time rather than in offline batch processes. By aggregating at analysis time, the person analyzing the metrics can decide dynamically on time-ranges, granularity, filtering and splicing data as they see fit to better understand the success of the search experience under measurement.
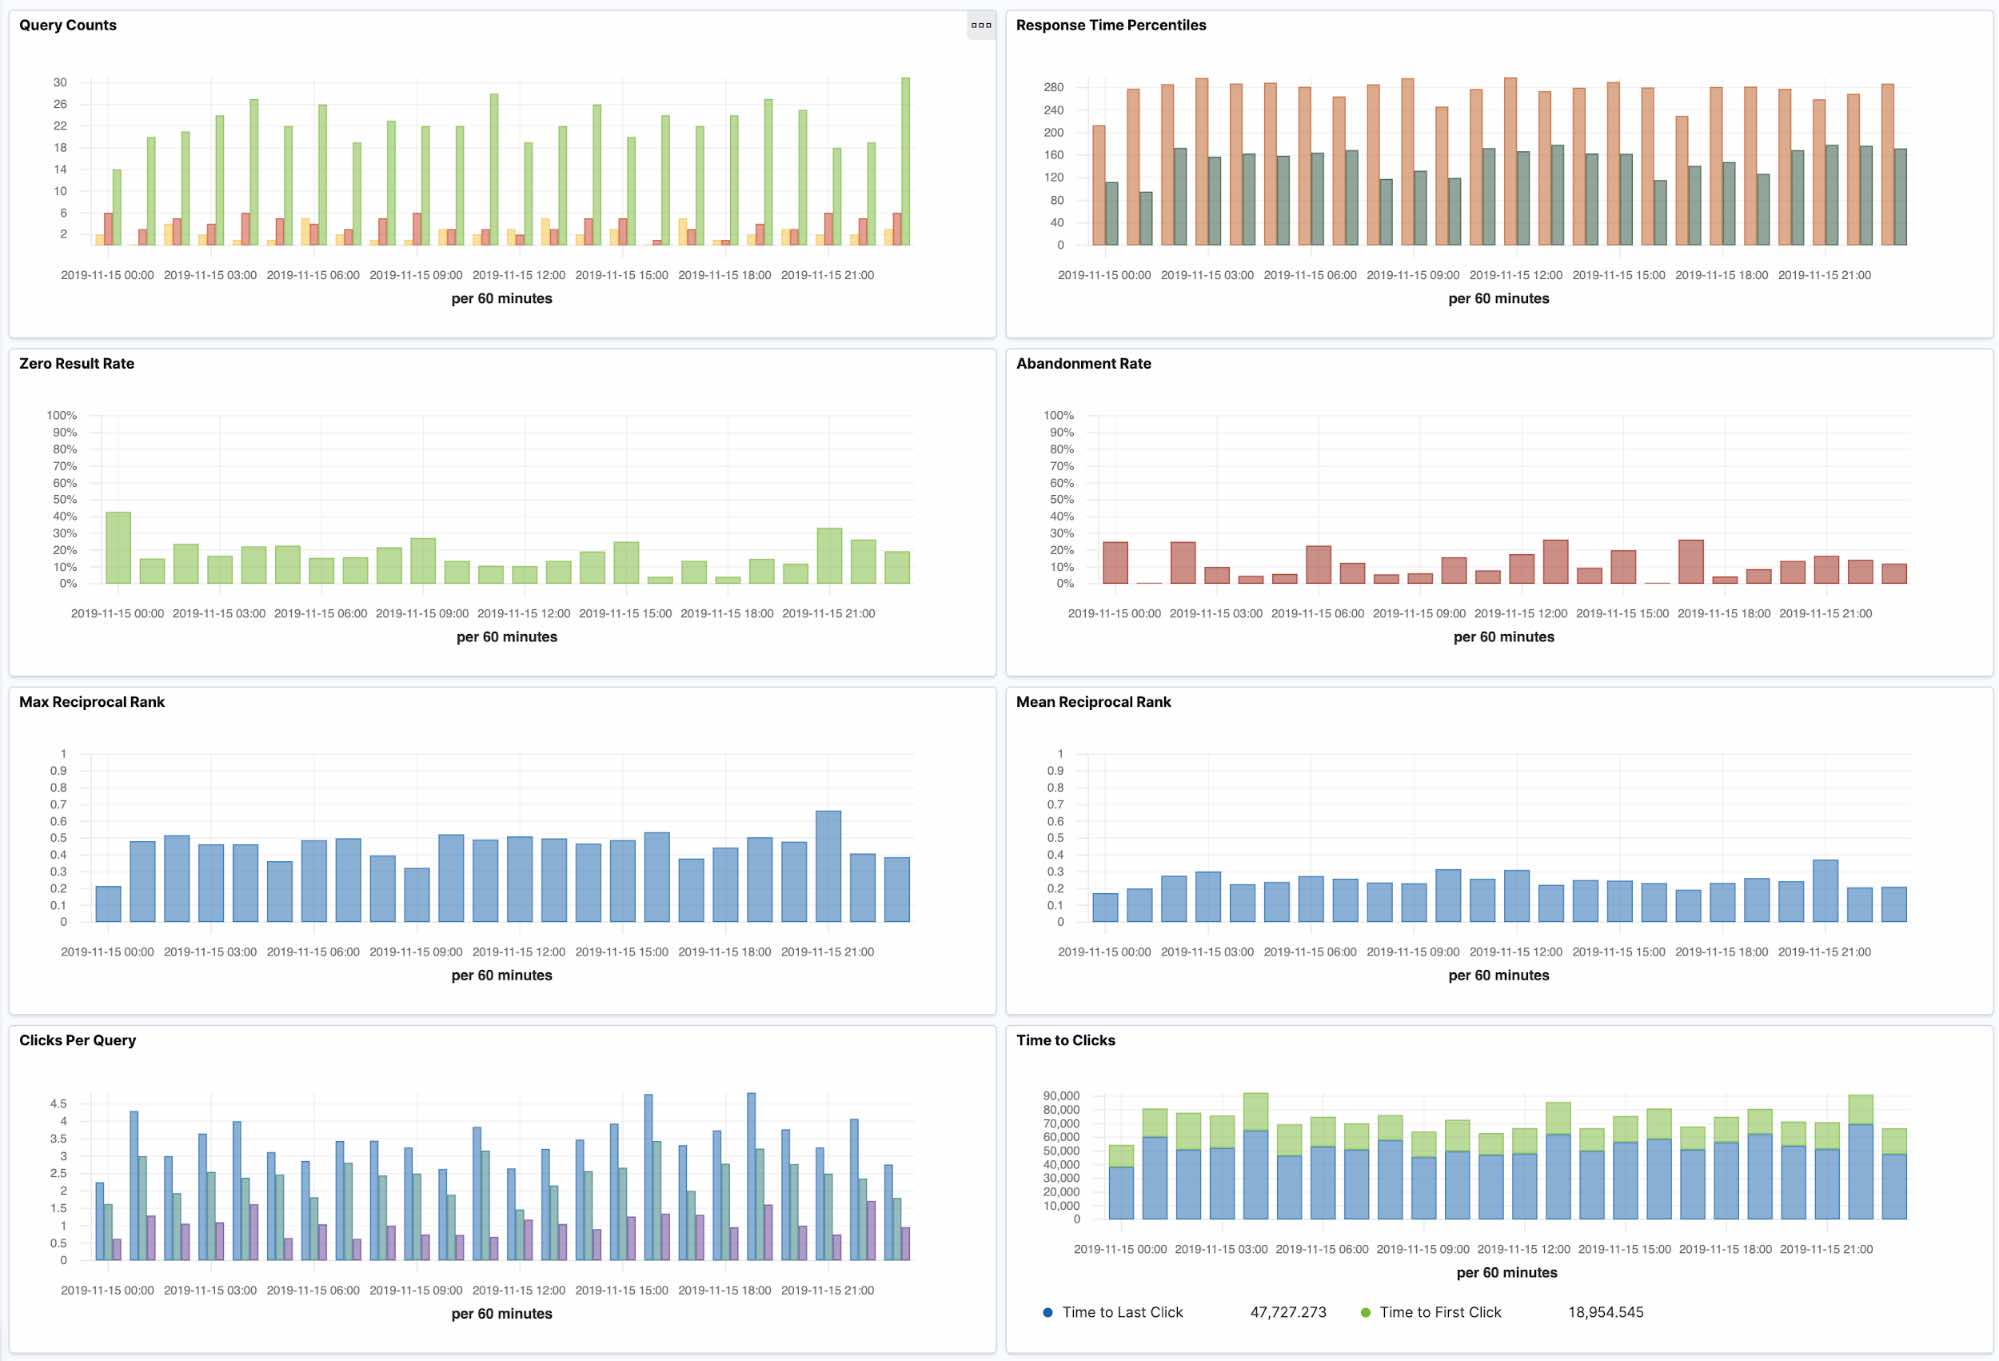
With the above example serving as a template, you can fill a dashboard with metrics calculated using transforms for per-query metrics, and aggregations for aggregation metrics. From CTR@n to abandonment rate and more, it’s all possible! See the project README and some of the references cited below for more ideas on which types of metrics can be calculated.
Conclusion
We hope this post has helped you to understand some of the basics of online search metrics and how you can use the Elastic Stack to build a consistent and reliable system for measurement. From here, there are many ways to add custom events, dimensions to events and metrics and we encourage you to keep exploring. If you want to dive deeper and look at the implementation details, please have a read through the project README which will definitely keep you busy! Definitely give it a try yourself, either locally or in a free trial of Elastic Cloud.
How are you measuring your search experiences? What kinds of online (and offline) metrics are you using? Join us in the Discuss forum to continue the discussion.
References
For more information on common challenges encountered with calculating and interpreting online search relevance metrics, please refer to:
- How does clickthrough data reflect retrieval quality?
- Beyond Position Bias: Examining Result Attractiveness as a Source of Presentation Bias in Clickthrough Data
For additional blog posts related to relevance tuning and measurement, please see:
- Made To Measure: How to Use the Ranking Evaluation API in Elasticsearch blog post
- Test-Driven Relevance Tuning of Elasticsearch using the Ranking Evaluation API
- Improving search relevance with boolean queries blog
Appendix
1 From Introduction to Information Retrieval, by Manning, Raghavan and Schütze: “Information retrieval (IR) is finding material (usually documents) of an unstructured nature (usually text) that satisfies an information need from within large collections (usually stored on computers).”
2 We also have problems with judges disagreeing and not being able to reliably judge search results. By using aggregate user behaviour from real users, we hope to overcome some of these problems. Of course using real user behaviour introduces its own problems, including topics such as position bias, where users are more likely to interact with the top-ranked items than lower-ranked items irrespective of their actual relevance. Some of these are topics of much research and definitely another blog post but it’s important to be aware of the limitations of this approach.
3 However things get more complex when you consider what exactly I meant when I searched for “shovel”. My actual need (since it’s spring time as I write this) is a “handheld garden shovel”. But if I was searching for “shovel” in the winter (and live somewhere where it actually regularly snows) then I’m more likely to be looking for a “snow shovel”.
4 In this post we’ll be using only the events on the search results page, however we may want to consider adding business events as a way of measuring “business success” (e.g. add to basket, purchased, etc.) which can sometimes be more meaningful.
5 Transforms are a feature that was added in 7.3 and reached GA in 7.7. Transforms allows us to perform group-by and pivot type operations on data. Since they are quite in-depth topics, you can find additional information in the Introducing transforms in Elastic machine learning webinar as well as in the 7.3.0 release blog.