Elastic Uptime Monitoring solution released
We are happy to announce the general availability of the Elastic Uptime solution, new with Elastic Stack 6.7. To try it out, spin up a cluster in our Elasticsearch Service (on Elastic Cloud) or download the Elastic Stack locally.
What is Uptime Monitoring?
Service uptime is one of the most important success metrics in service delivery. If the service is down users cannot be successful, no matter how great the user experience is when the application is up. In the world of interconnected applications and microservices, operation teams face a wider footprint of critical endpoints to monitor, not all in their control. As a result, actively measuring, reporting, and alerting on service uptime and response time at scale is the cornerstone of any observability initiative.
Measuring service availability starts with the basics. Are the hosts or containers underlying the applications responding to network pings? Is the application port responsible for communication accessible? Uptime checks get more intricate quickly. Is the website responsible for user interaction accessible by the users, and does the HTTP response delivered by the server contain the expected content? Is the set of internal APIs in a microservices architectures available and returning correct API responses? Are the 3rd party services the application rely on responding quickly?
Elastic Uptime
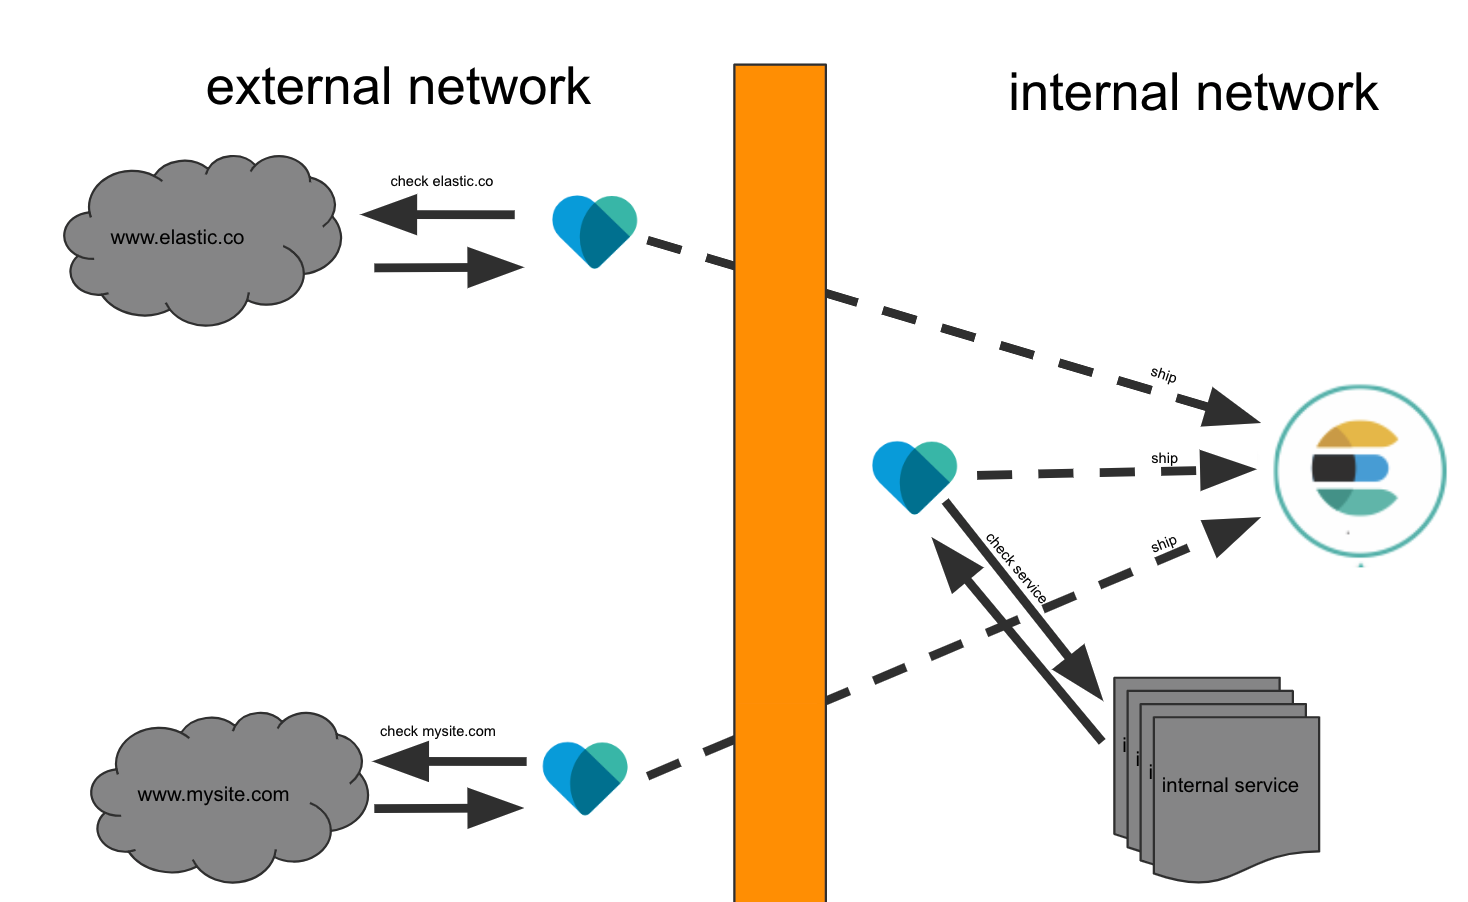
The Elastic Uptime solution answers these questions easily and elegantly across all tiers and infrastructure components. Based on Heartbeat, an open source uptime monitor, Elastic Uptime is transparent, flexible, and developer-friendly. It can be deployed both inside and outside your organization's network to understand service uptime and response time characteristics from multiple network vantage points.
Combining uptime monitoring with logs, metrics, and APM trace data, with Elastic Stack as the operational datastore, organizations can bridge data silos and enable analyst workflows from high-level KPIs to detailed events. This speeds up troubleshooting and root cause analysis and further empowers observability initiatives. Elastic alerting and machine learning features provide proactive notification and anomaly detection capabilities on top of all this data in a consistent and data source agnostic way.
In addition to ensuring the health of production applications, uptime monitoring can also help with quality assurance and continuous integration workflows. As your applications evolve and move through a set of planned changes, you can find out about problems in QA and Production before user traffic ever hits them. This speeds up product development cycles, while reducing risk of negative impact to your customers.
Collecting uptime information using Heartbeat
Heartbeat is an open source, lightweight shipper which was originally developed in close collaboration with our SRE team to measure the response time and availability of our Elastic Cloud services across multiple regions. The product was such a useful addition to our stack for logging and metrics analytics that we decided to release it, first as beta and then as a GA in 6.5.
Heartbeat can operate from inside or outside of your network; all it needs is network access to the desired HTTP, TCP, or ICMP endpoint. Configuration is as simple as supplying Heartbeat with the list of URLs you want to monitor. Heartbeat executes periodic checks to verify whether the endpoint is up or down, then reports this information, along with other useful metrics, to Elasticsearch.
In a typical customer deployment, we normally see Heartbeat deployed in multiple locations, to better simulate the end user experience coming from multiple vantage points. As soon as Heartbeat starts to run, it will check the list of endpoints you have configured, send the information to the Elastic Stack.
Exploring monitor data in Elastic Uptime
Now that we have the data, we can look at it in the Uptime application in Kibana.
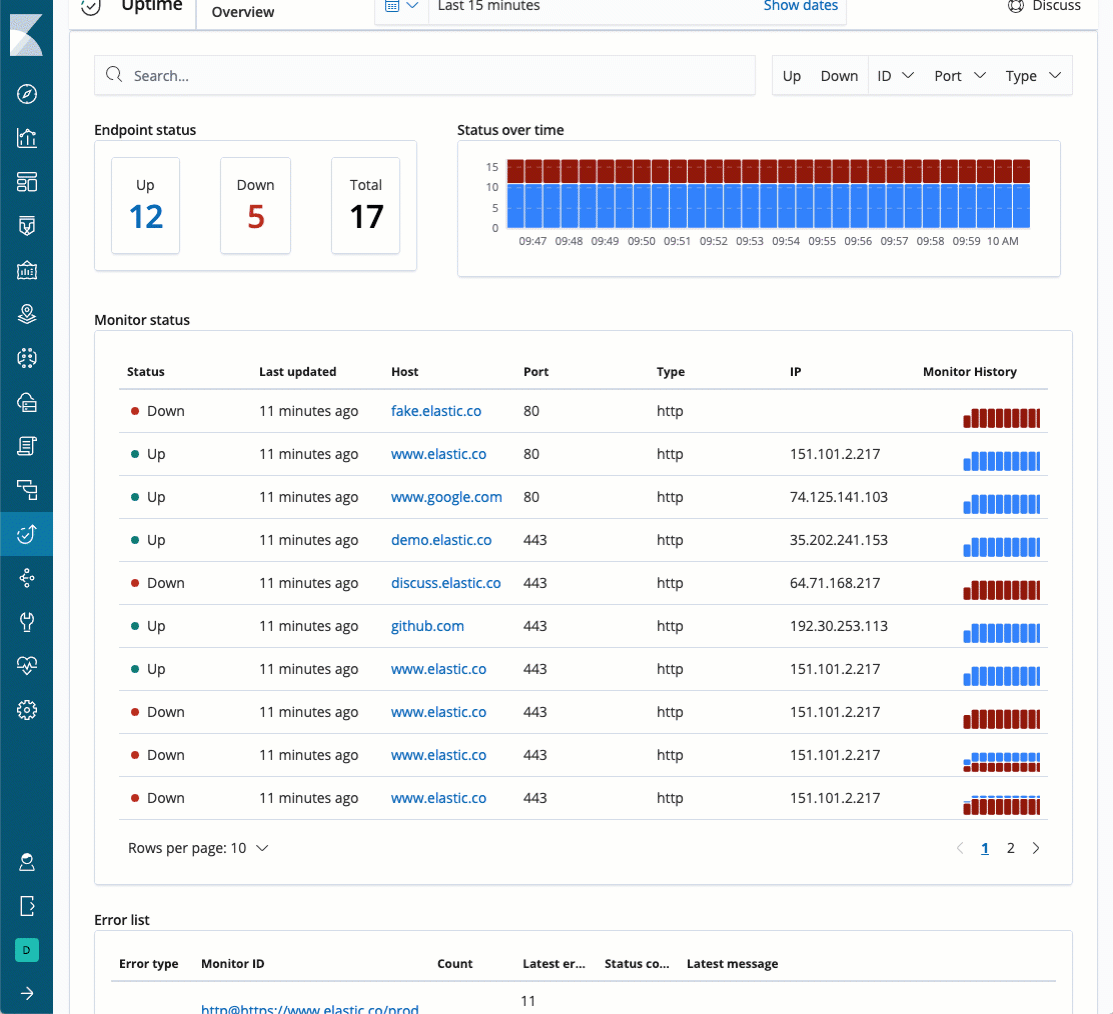
Uptime Overview page
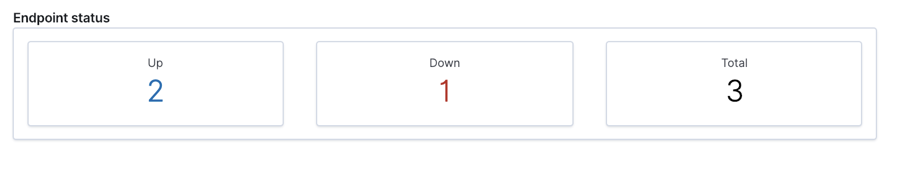
Endpoint status
It really doesn't matter how many Heartbeat instances you've got. As long as they report their information to Elasticsearch, you will see an aggregated view across all your monitored endpoints. If you want to know how many of your endpoints are up or down this is the place to look.
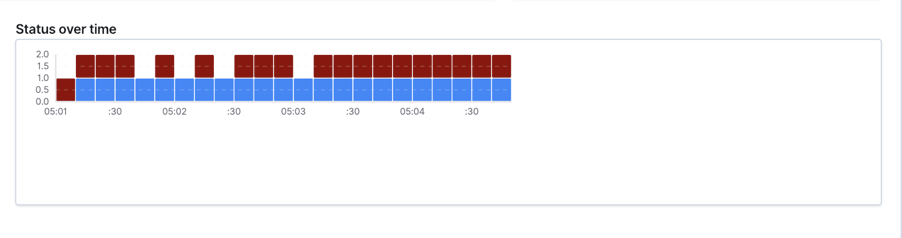
Status over time
This chart provides the status across all monitored endpoints, over a period of time. The Y-axis is the number of the monitored endpoint, while the X-axis represent a period of a selected time.
Monitor status
This table provides an up-to-date status on each individual endpoint that is monitored by Heartbeat
Every line represents a single endpoint, with its related information, such as status (is the endpoint up or down), Last update (when did it report the latest information), Monitor name (if one was defined, otherwise the URL will be used), full URL, IP and status over time.
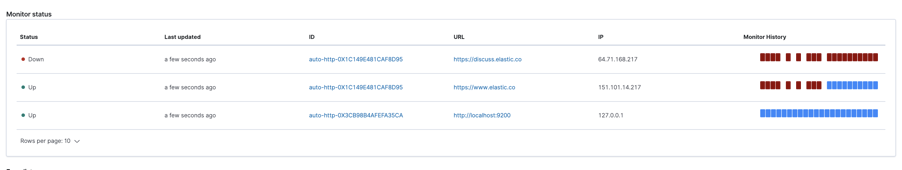
If you want to see the up-to-date status of each monitored endpoint, this is the where to look.
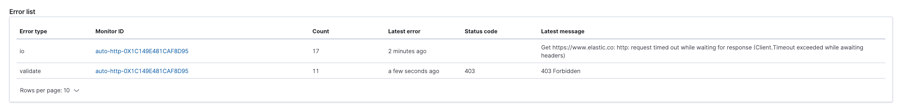
Error list
If one of Heartbeat's monitors detects an error, Heartbeat will report it to Elasticsearch, and the error information will be presented in the error list table below. You will be able to see error code, error message, number of time this error occurred, and the error type.
Uptime Monitor page
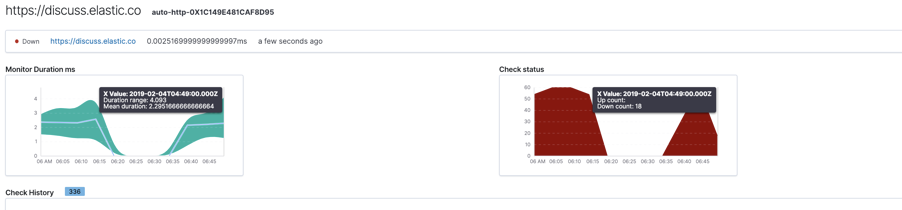
When you click on a specific monitor – in the "Monitor Status" table, you will be redirected to the second page on this solution, the "Monitor page". This page would help you check a specific endpoint thoroughly.
Monitor duration and Check status
The "Monitor duration" chart represent the response time over time (in milliseconds) for a specific endpoint, while the "Check status" chart represent the endpoint's availability over time.
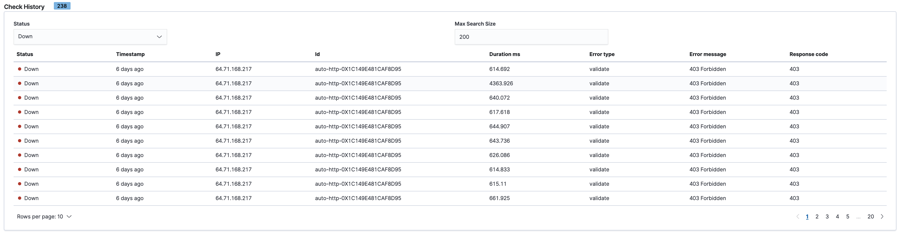
Check History
This table provides a detailed view on each individual check. Every line in this table represents a single check that Heartbeat executes against a specific endpoint, you can filter to examine all checks or filter by up/down.
Ad hoc analysis of uptime data using Kibana
Heartbeat data is just another index in Elasticsearch. You can visualize Heartbeat data in Kibana for ad-hoc analysis. We provide a default dashboard to help you get started. To learn more about using Kibana for ad hoc analysis of Heartbeat data, please refer to the Uptime Monitoring with Heartbeat and the Elastic Stack blog.
Alerting on top of Uptime data
You can create alerts on top of Uptime data using Watcher. Watcher is a powerful alerting and actions framework on top of Elasticsearch. Most simple threshold based alerts are easily created using the Watcher UI. For more advanced conditions and actions, you can also build a watch by working directly with the Watcher API. For a non-trivial example of an alert using uptime data, see the Configure a TLS expiration notification using Heartbeat blog to learn how to alert on invalid SSL certificates.
Observability using the Elastic Stack
The 6.7 release also brings general availability of the Infrastructure and Logs solutions. In addition to APM, these solutions are a part of the broader 'observability' story using the Elastic Stack.

Done? We are just getting started!
This is only the first phase of Uptime solution and we are not stopping here. In our upcoming releases, we will provide additional capabilities in terms of managing and configuring monitors. Until then, I hope you will use and enjoy this first release of Uptime monitoring, please feel free to reach out and to provide more feedback on our forum discuss.elastic.co.
Uptime is available on Elastic Cloud Elasticsearch Service -- you can get started in just minutes with monitoring the uptime of your apps. Don't have an account? Sign up for a free 14-day trial today.