Elastic and Microsoft Azure: Unified observability for Spring Boot applications
.png)

 Share on Twitter
Share on Twitter

 Share on LinkedIn
Share on LinkedIn

 Share on Facebook
Share on Facebook

 Share by Email
Share by Email

 Print this page
Print
Azure Spring Cloud is a fully managed service for Spring applications that simplifies infrastructure management. A 2021 survey from Microsoft indicated that “end-to-end monitoring” is the second biggest challenge DevOps and IT managers face as they migrate Spring Boot applications to the cloud.
Now DevOps and SREs can monitor both Spring Boot logs and application metrics across all environments by automatically shipping them to Elastic. Teams can also correlate and add context to their observability data from Spring Boot applications with other observability data sets across their environments for holistic end-to-end monitoring.
"Microsoft is committed to making it easier for customers to modernize their Java applications in the cloud. The expanded native integration of Elastic on Azure includes support for Azure Spring Cloud that enables customers to simply achieve end-to-end observability of their Spring Boot applications."
Julia Liuson, President, Developer Division, Microsoft
“Elastic is dedicated to helping organizations observe, understand, and optimize their applications and infrastructure. Through this native integration between Azure Spring Cloud and the Elastic Observability solution, it's easier than ever to bring together a unified view of your Spring Boot application, across application, infrastructure, and user data."
Steve Kearns, Vice President of Product Management, Elastic
Read on to learn how to ship Azure Spring Cloud logs and application metrics into Elastic so you can monitor and optimize application performance.
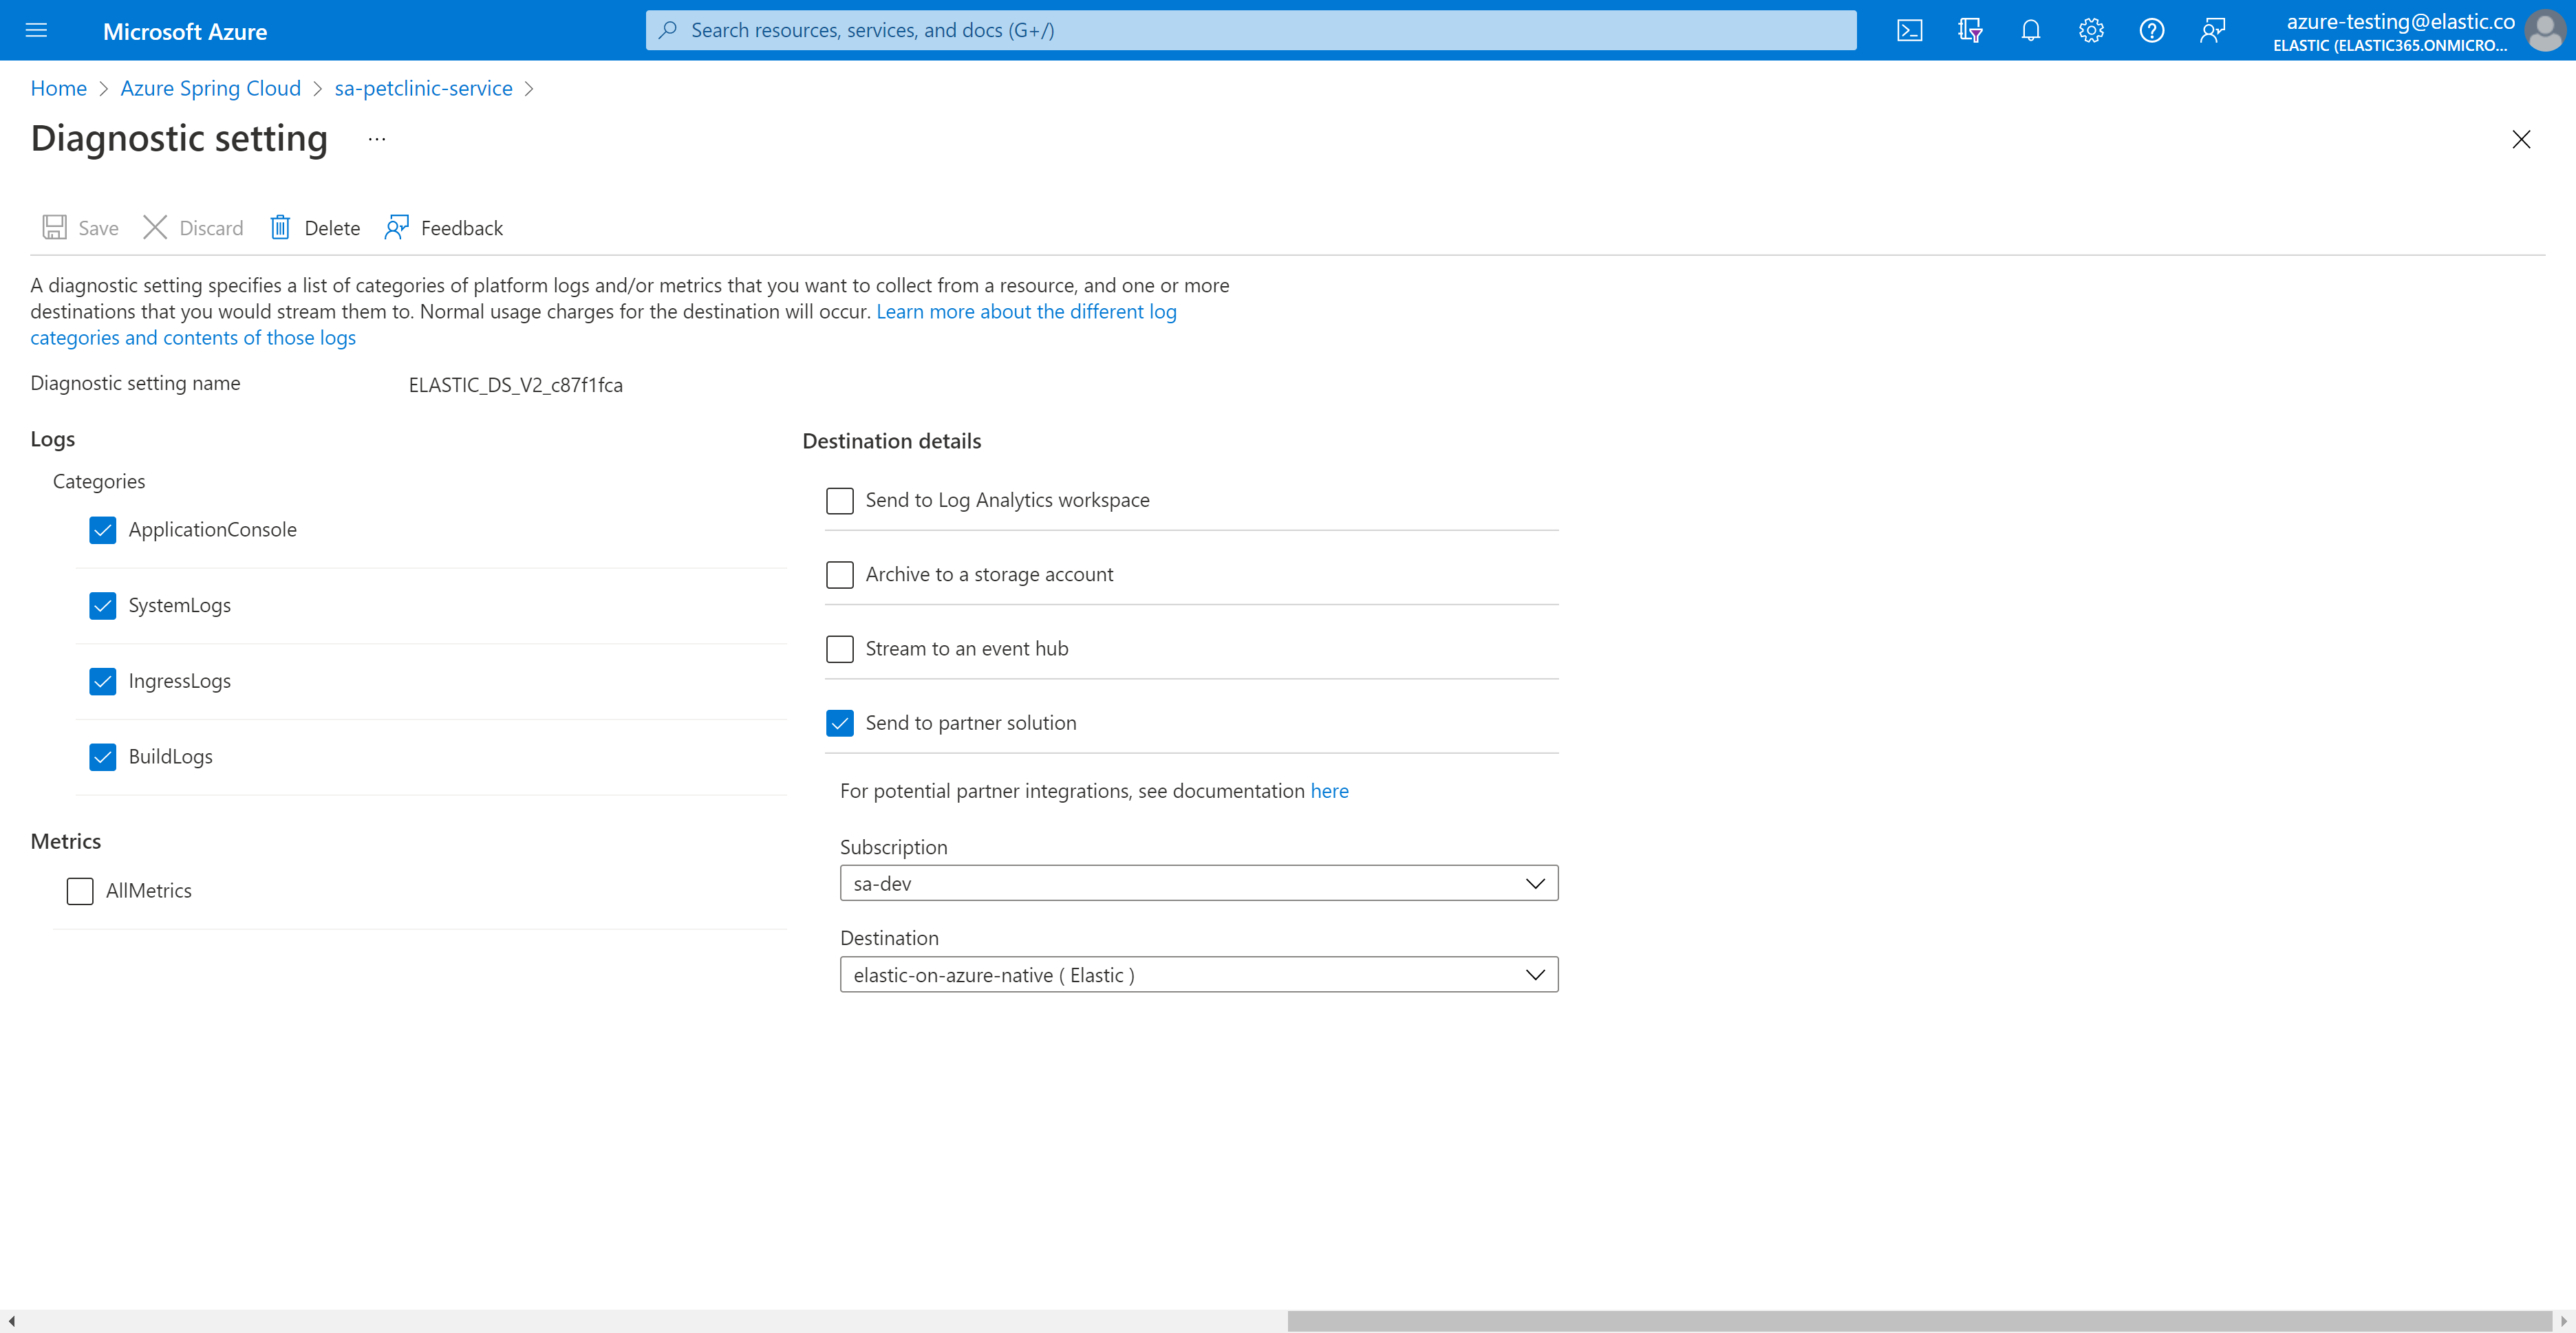
Shipping Azure Spring Cloud logs to Elastic
Native integration makes it seamless to ship logs to the Elastic Observability solution. Once data is shipped into Elastic, you can jumpstart analysis in minutes with turnkey visualizations and dashboards.
Instrumenting Spring Boot applications
Run a "provisioning" automation for a completely hands-off experience for instrumenting and monitoring any new applications that you create and deploy using a Terraform, Bicep or ARM template. Or you can run it on-demand using the Azure CLI for greater flexibility and control.
az spring-cloud app update --name customers-service \
--artifact-path <unique-path-to-your-app-jar-on-custom-storage> \
--jvm-options='-javaagent:<elastic-apm-java-agent-location-from-mounted-storage>' \
--env ELASTIC_APM_SERVICE_NAME=<your-app-name> \
      ELASTIC_APM_APPLICATION_PACKAGES='<your-app-package-name>' \
      ELASTIC_APM_SERVER_URL='<replace-with-your-Elastic-APM-server-url>' \
ELASTIC_APM_SECRET_TOKEN='<replace-with-your-Elastic-APM-secret-token>'Analyzing Spring Boot application performance
After instrumenting and shipping logs from your Spring Boot application, you can use Elastic Observability to monitor, analyze, and search your data to keep your applications performing.
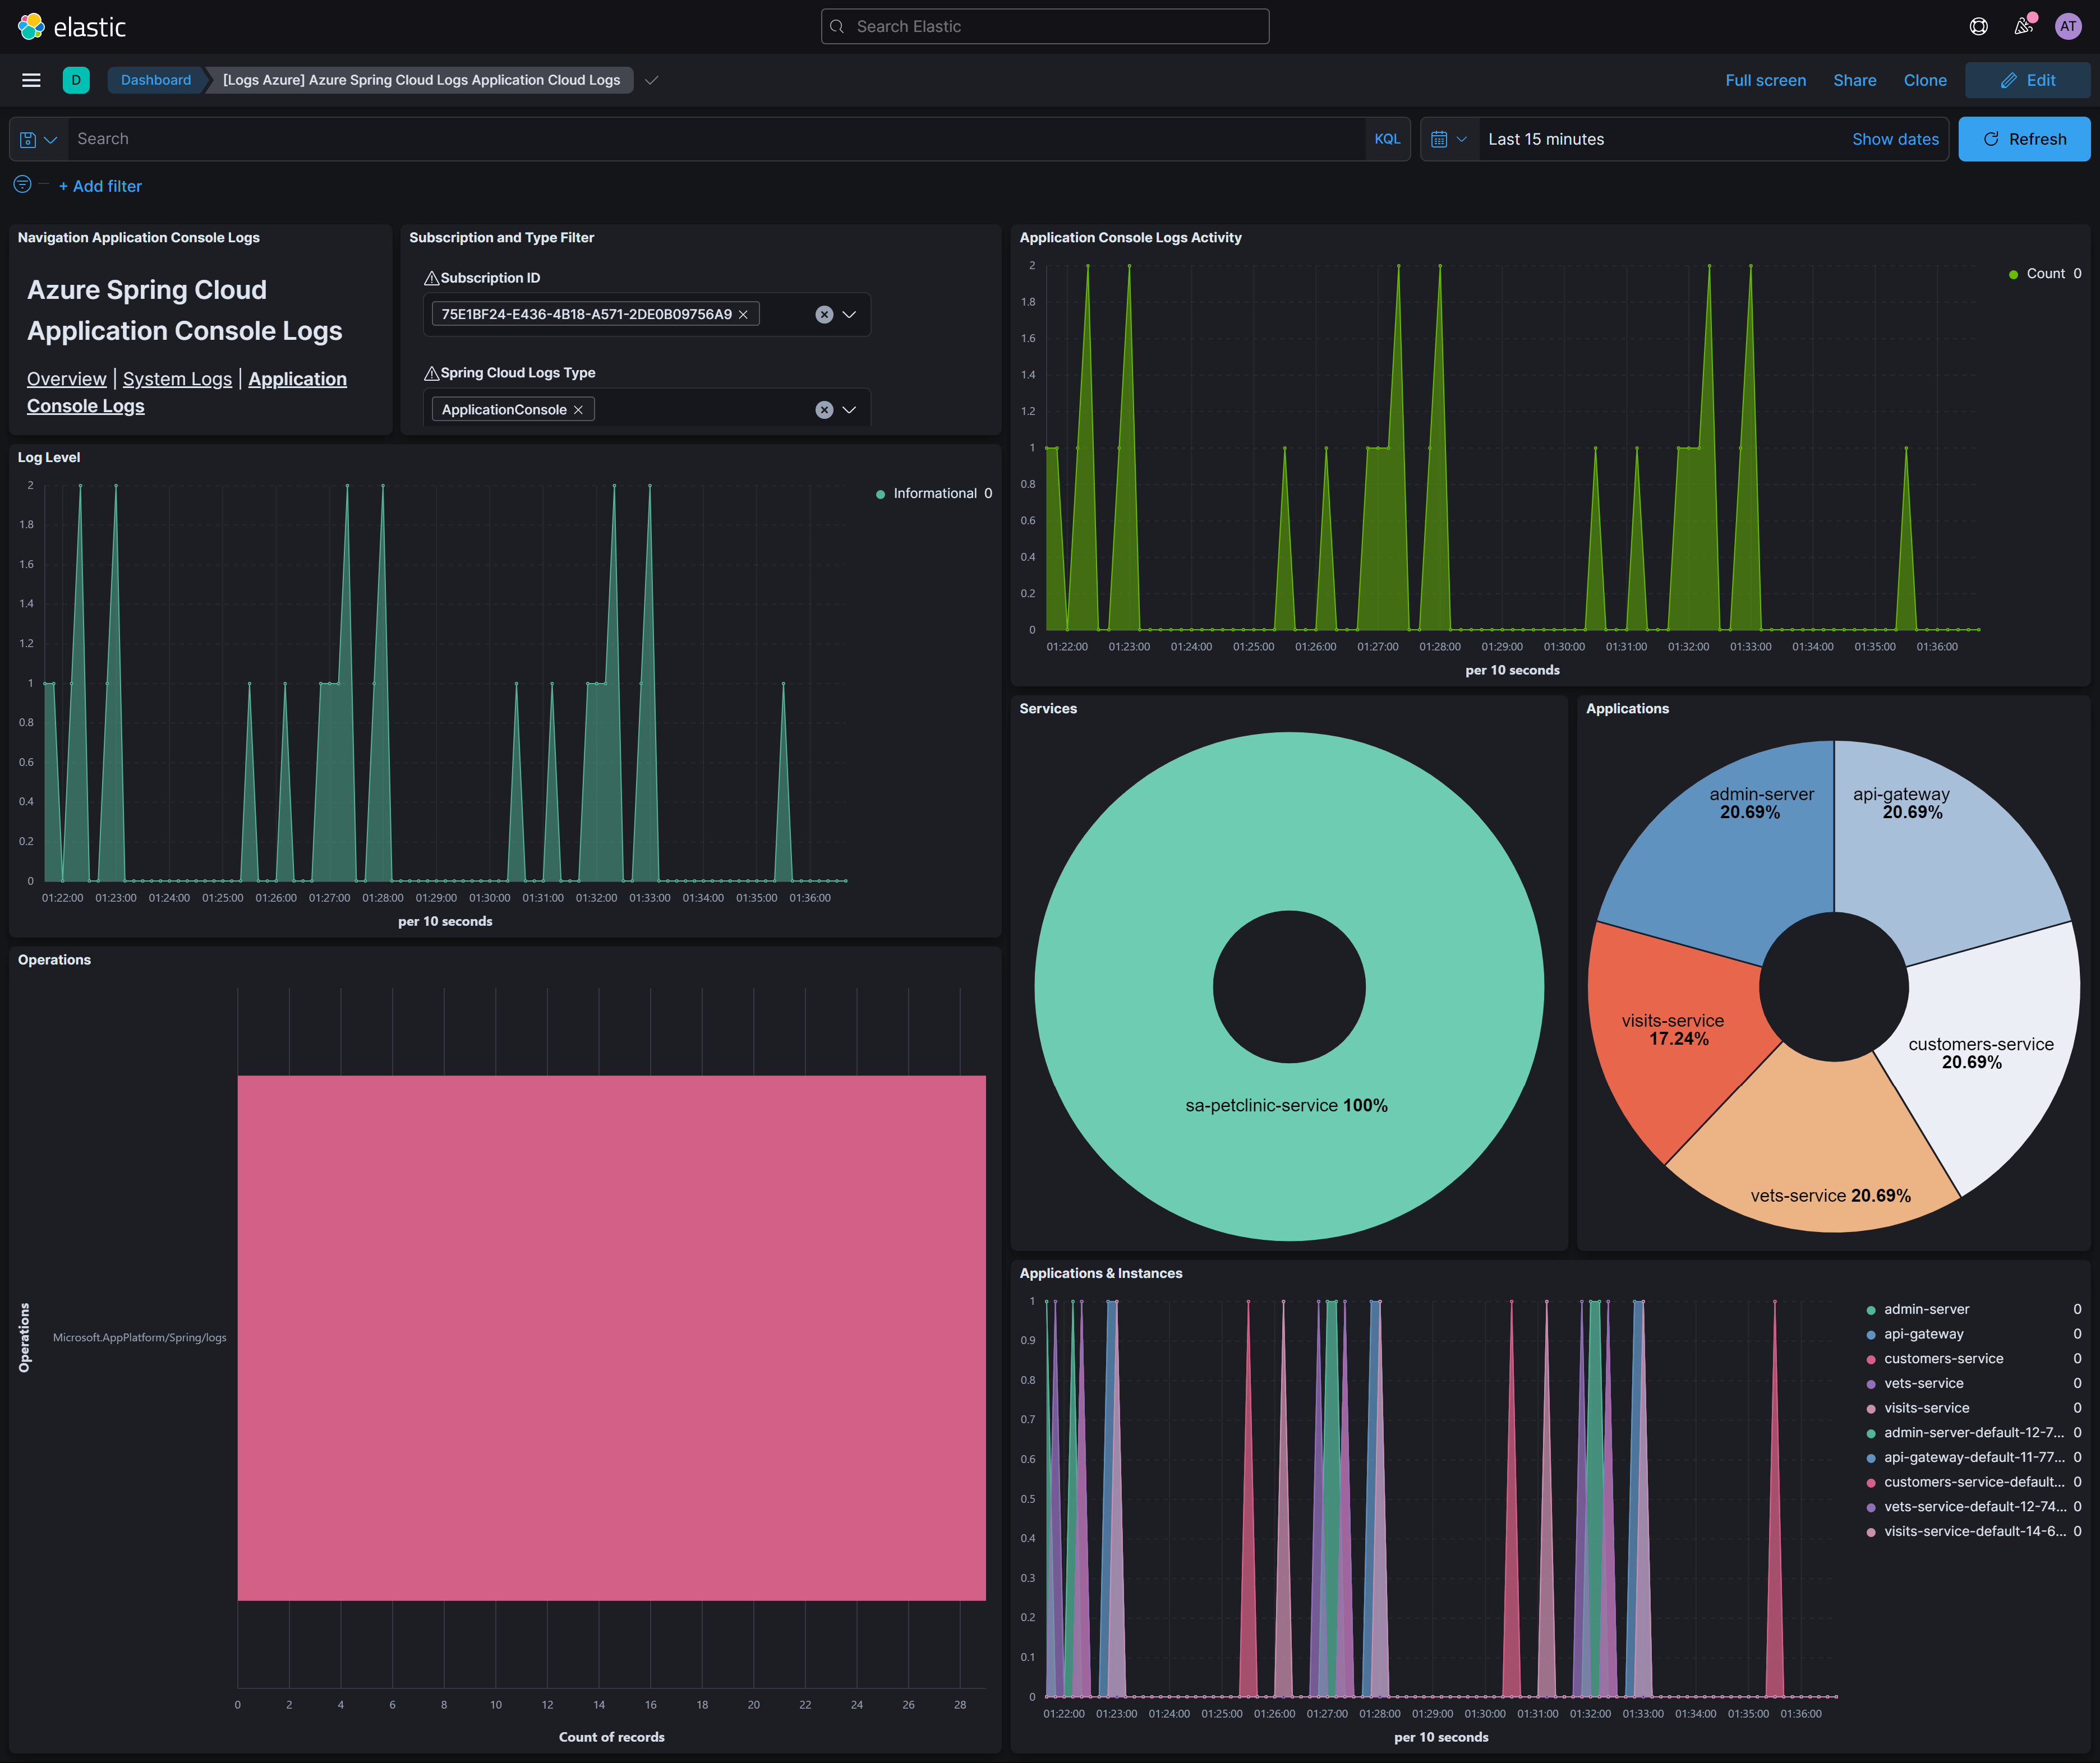
You can also use the out-of-the-box Azure Spring Cloud dashboards within Elastic Observability in Azure to gain instant insights from your Azure Spring Cloud logs.
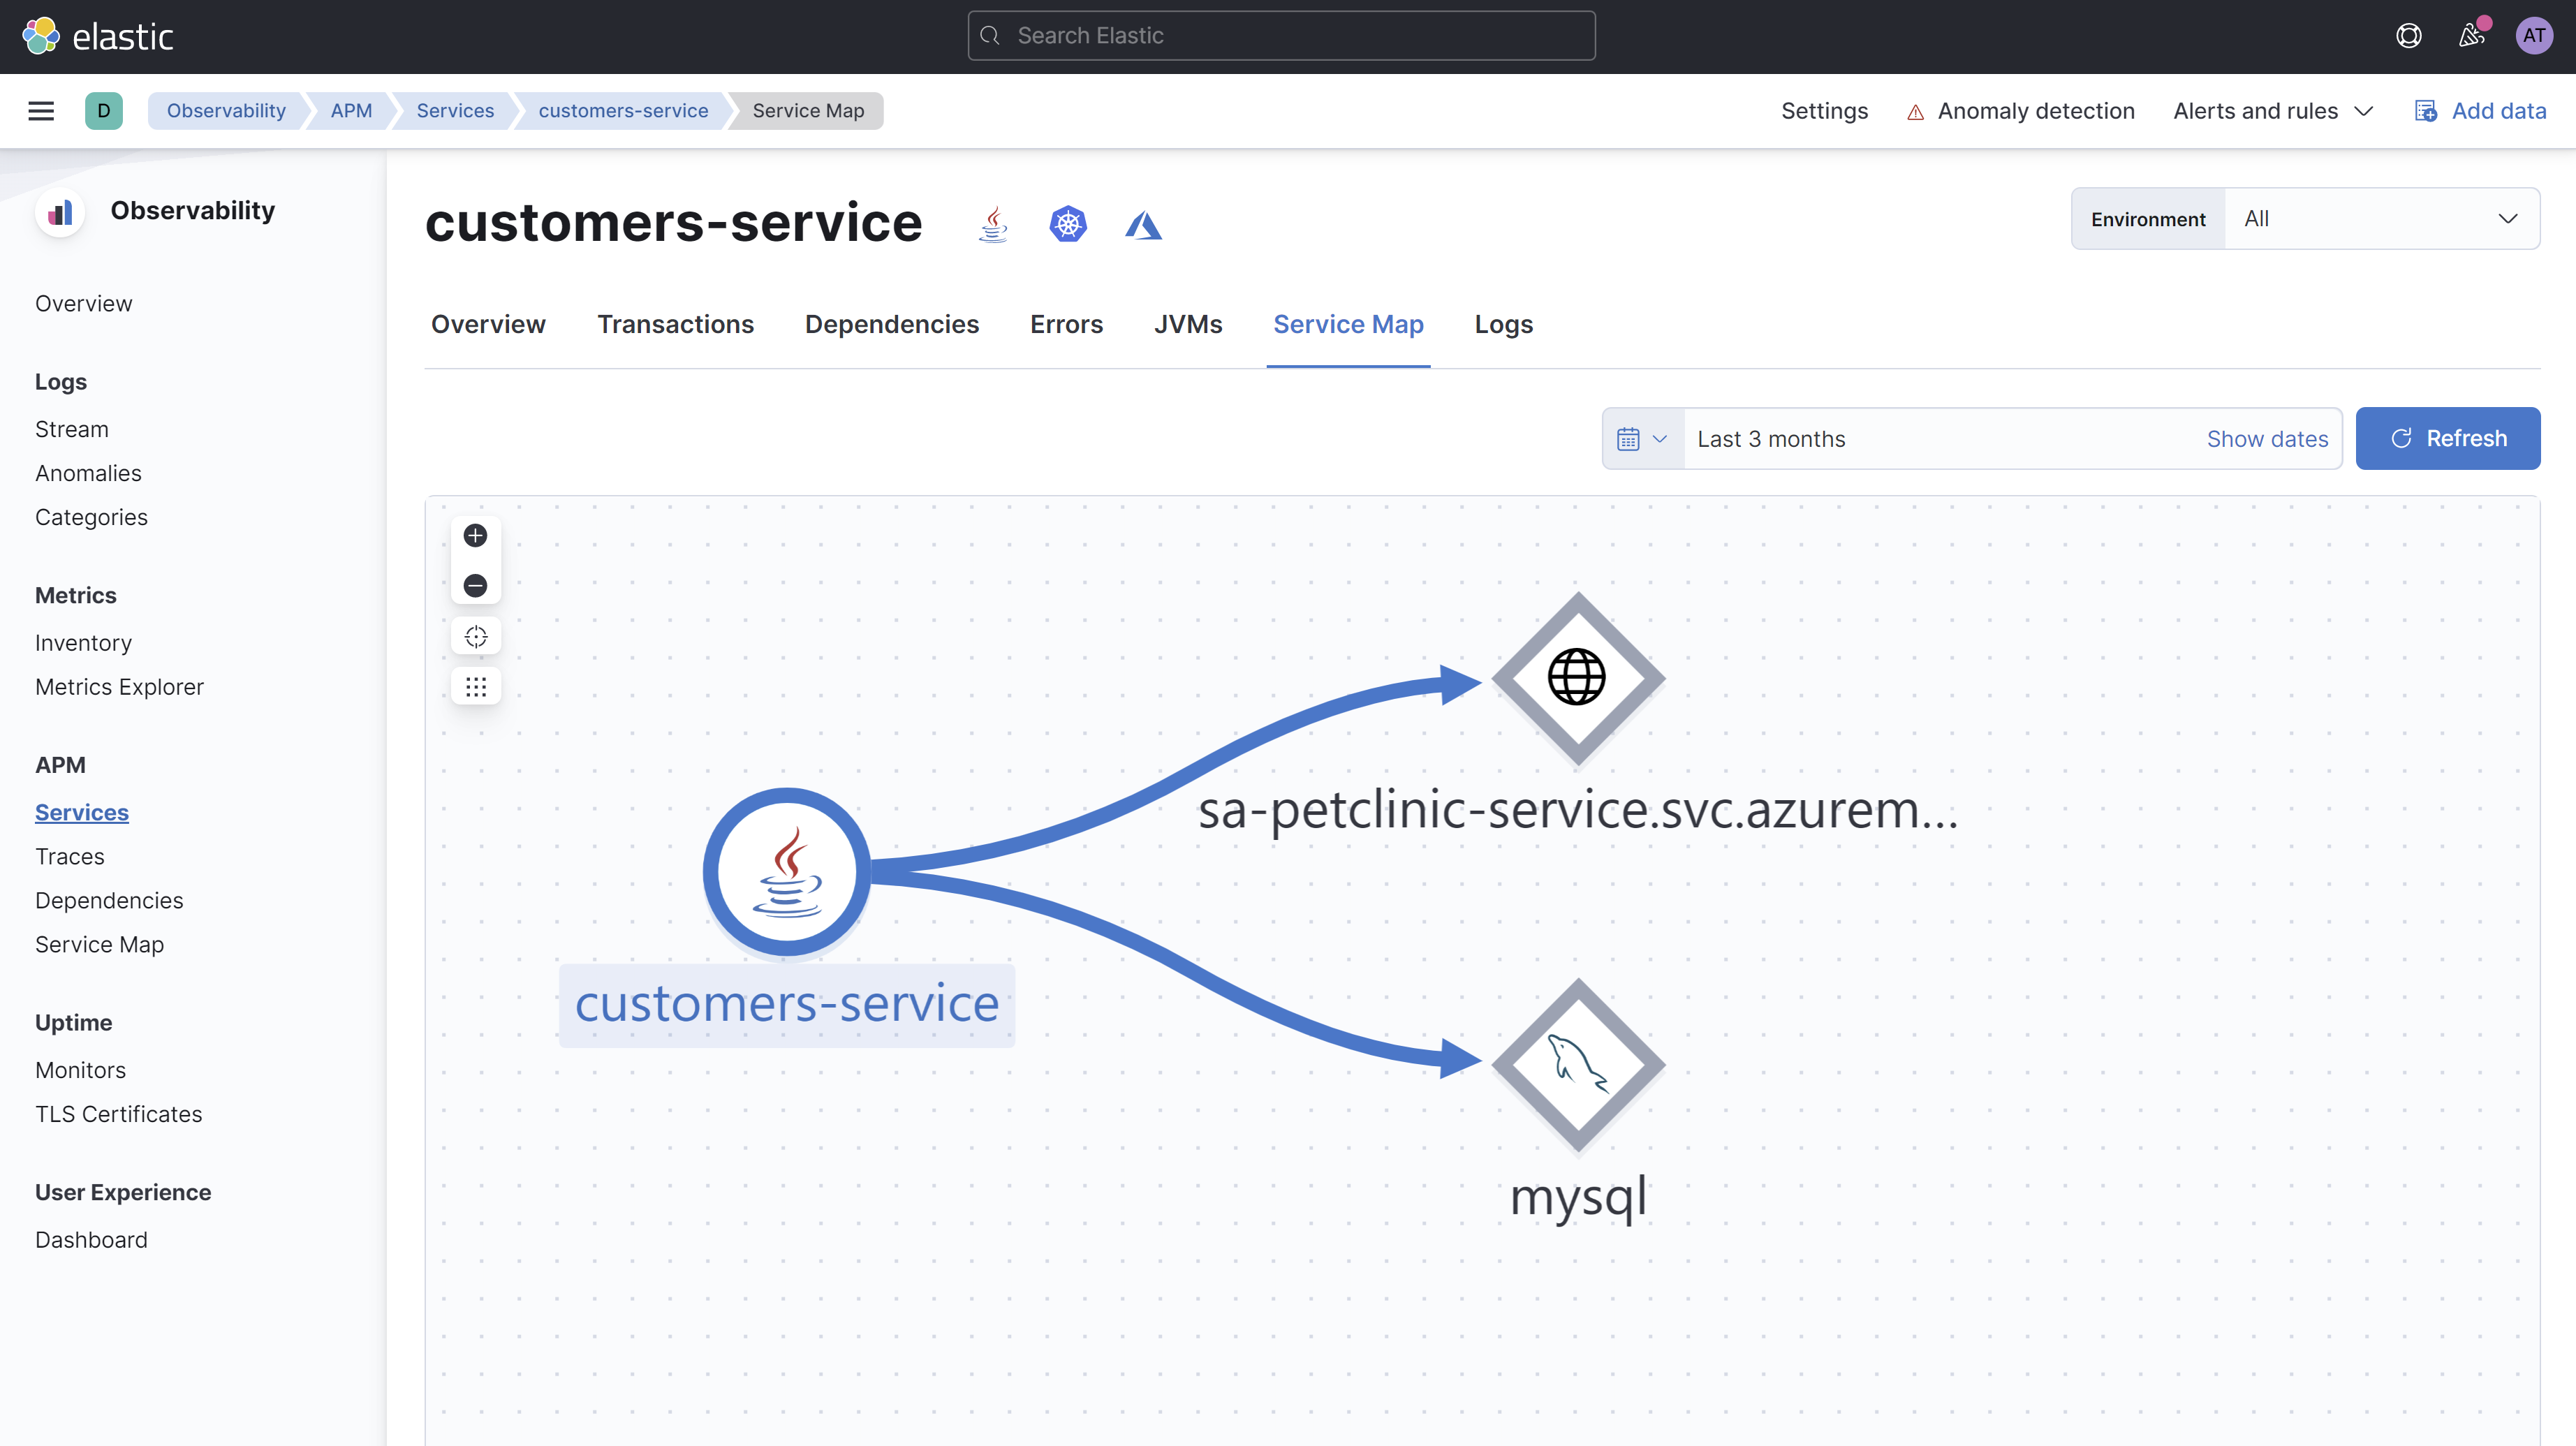
With Elastic APM, you can analyze and search your application performance data.
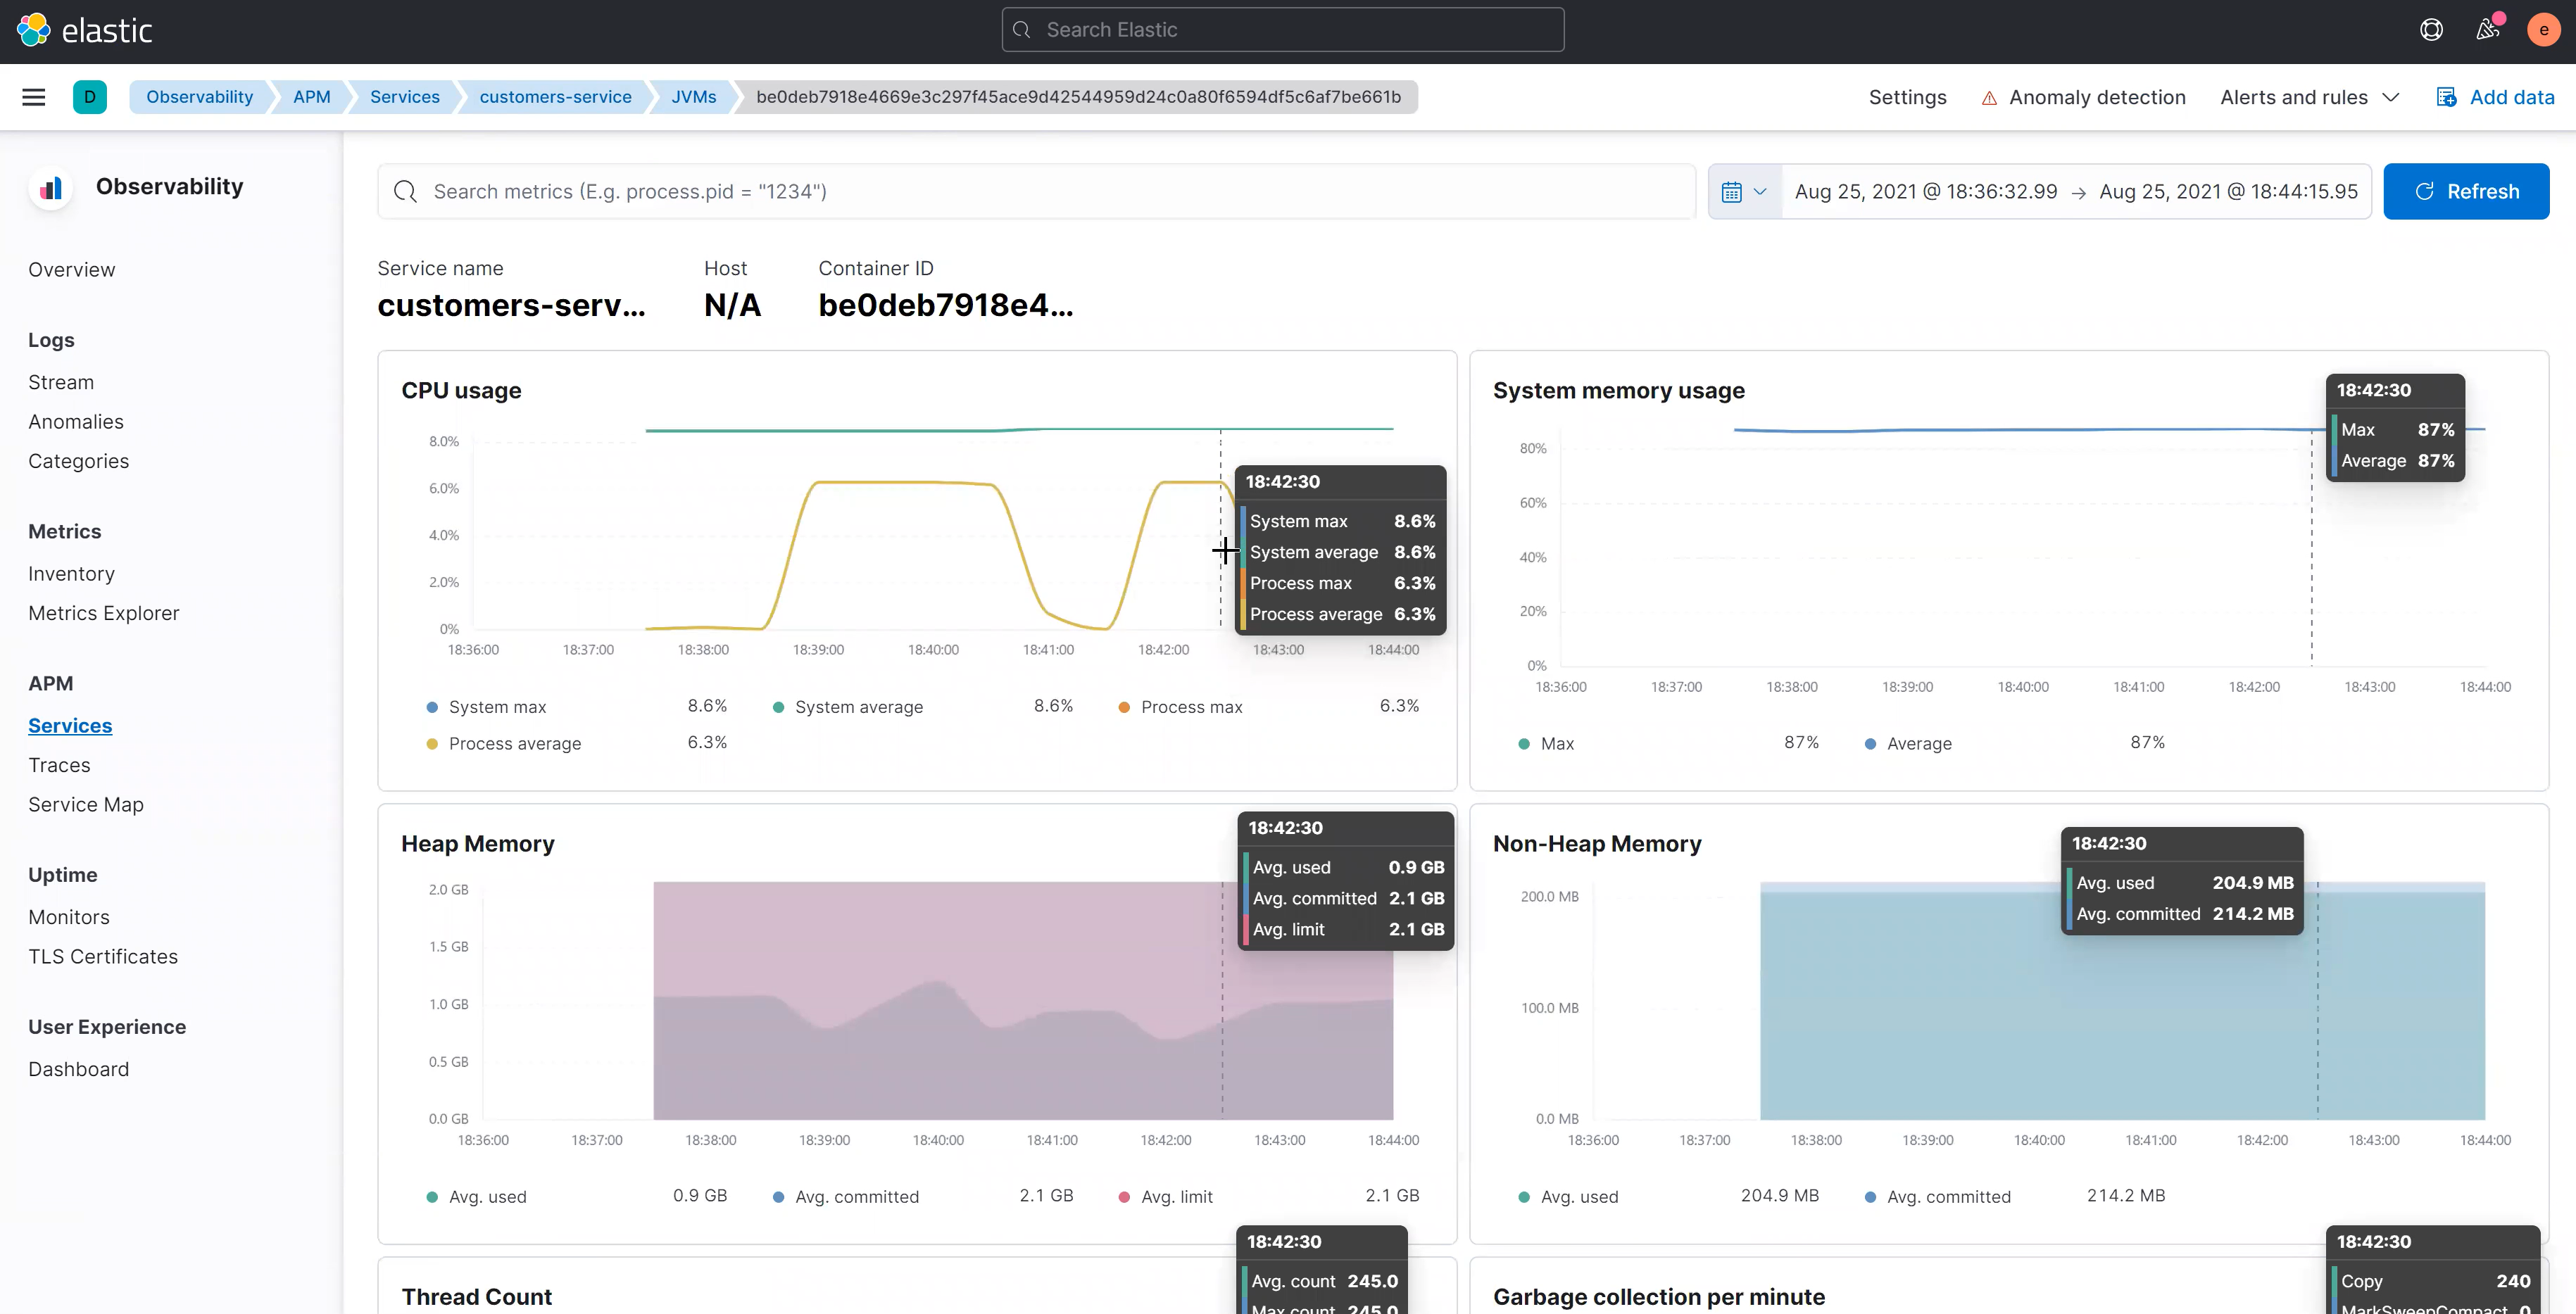
You can also use Elastic APM to look at JVM metrics to understand heap memory usage, system memory usage, CPU usage and other metrics that help you make evidence-based capacity planning decisions.
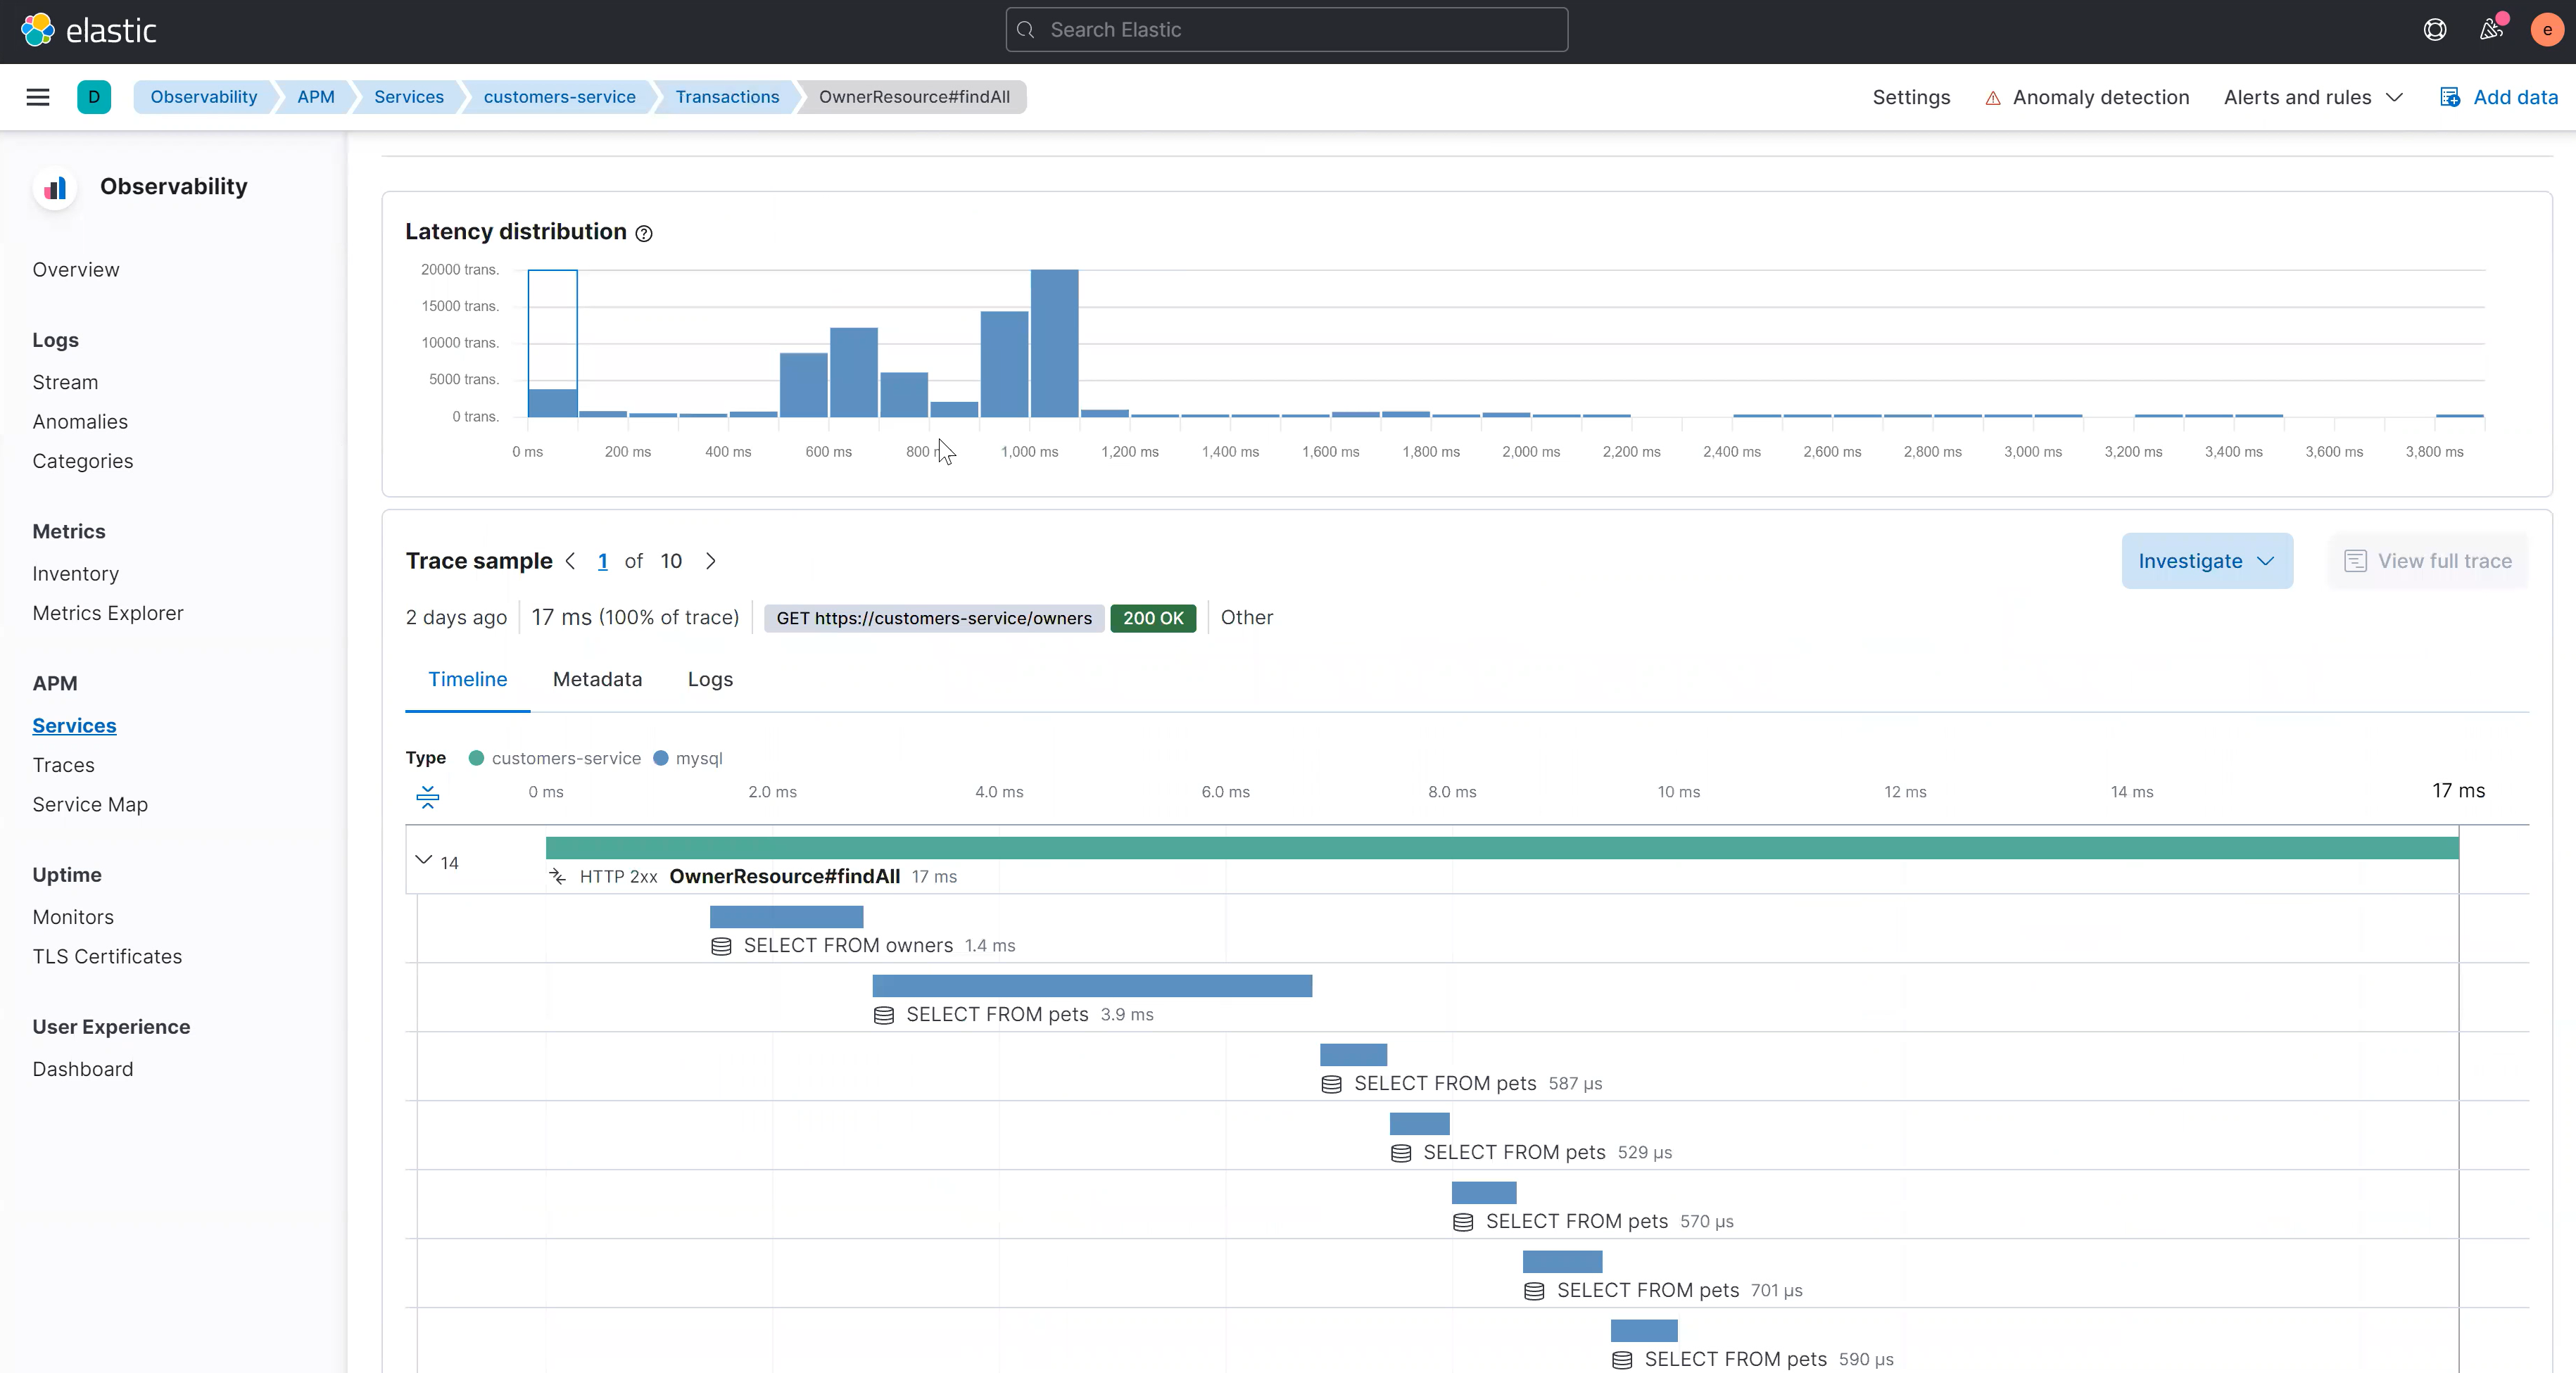
Utilizing the distributed tracing capabilities of Elastic APM, you can drill further into the performance of your applications to understand which transactions impact your customers the most and where in those transactions is the most time being spent.
With Elastic’s built-in machine learning capabilities, extracting new insights from your Azure Spring Cloud data is as simple as clicking a button — making machine learning truly operational.
The Elastic Stack processes data upon ingestion, ensuring that you have the metadata you need to identify root causes or add context to any event. Built-in tools like Data Visualizer help you find the jobs you're looking for and identify fields in your data that would pair well with machine learning.
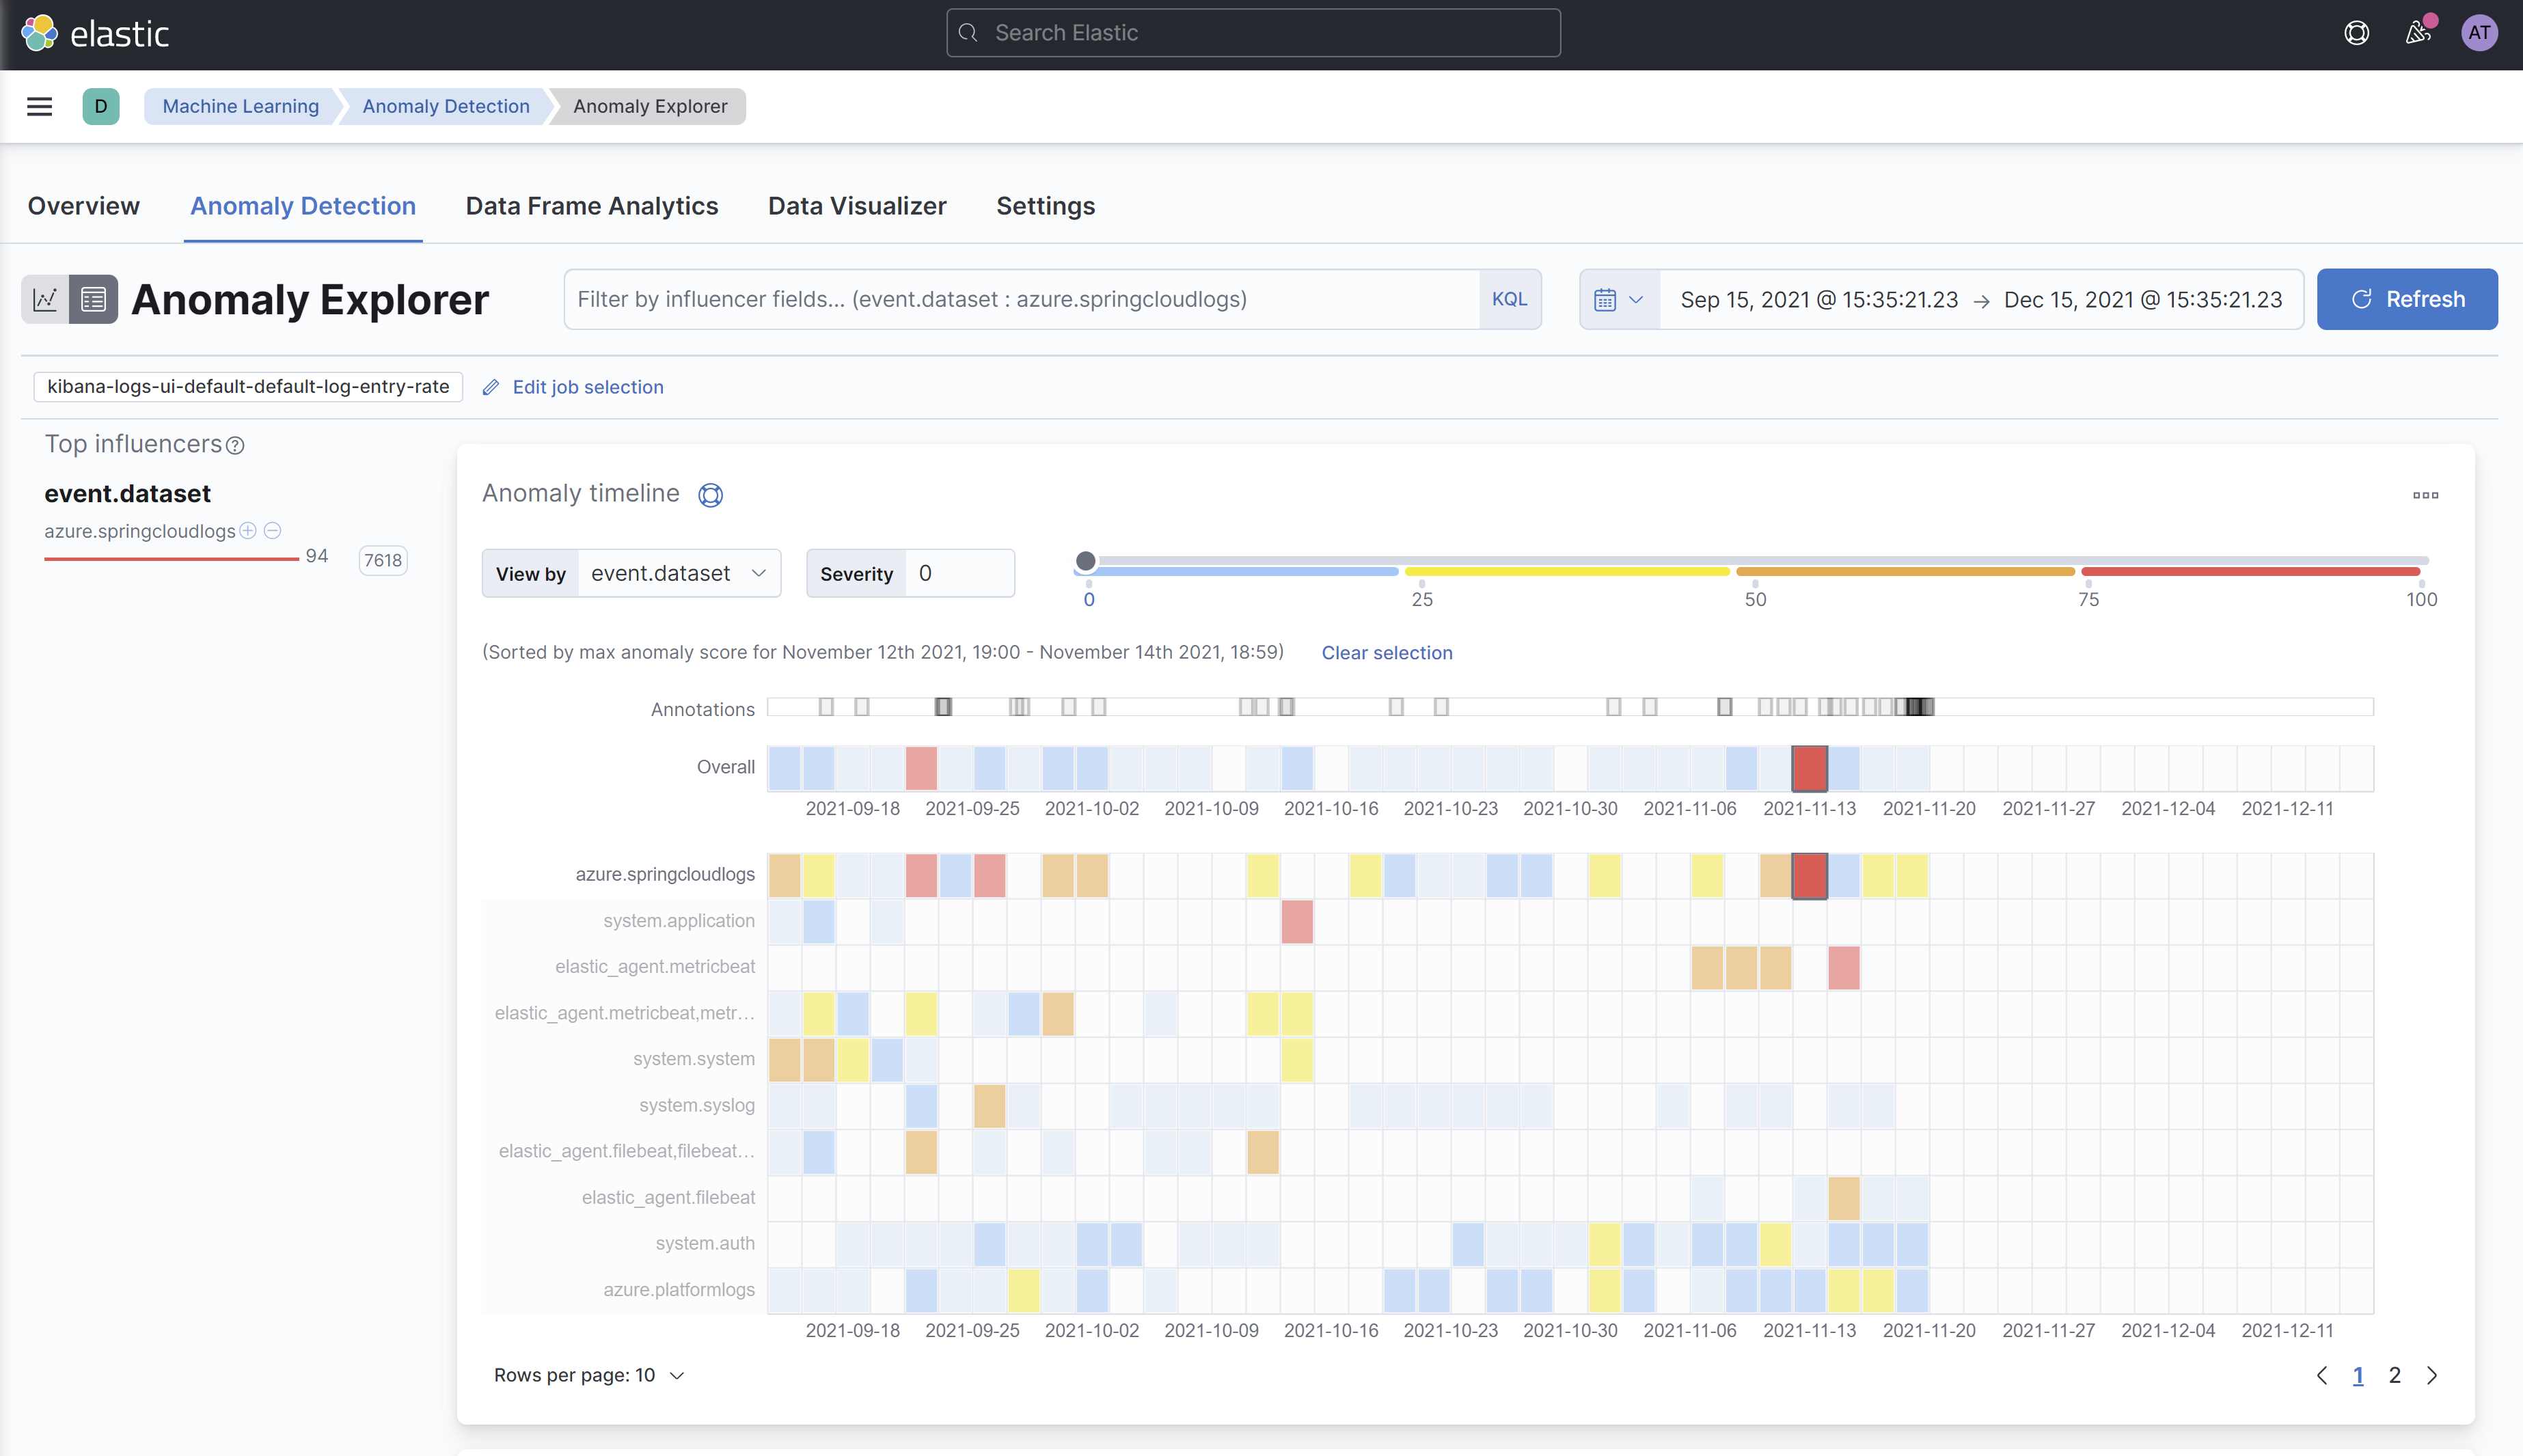
You can derive actionable insights from your logs and APM data with the rich alerting and anomaly detection capabilities within Elastic Observability. For example, you can uncover irregular log rates, or unusual behavior in the response times of your applications in Azure Spring Cloud.
Use the same logs to stop threats at cloud scale
Since Elastic offers a common schema and single repository, the same observability data from Spring applications and other data sets can also be used for extended detection and response (XDR) to drive mean time to detection towards zero. Elastic Security brings together SIEM and endpoint security, allowing organizations to ingest and retain large volumes of data from diverse sources, store and search data for longer, and augment threat hunting with detections and machine learning.
Focus on customer value while we keep the lights on
The native integration of Elastic in Azure is the easiest and fastest way to get started with Elastic on Azure. Quickly ship your Azure Spring Cloud logs and APM data to Elastic, access any type of data, from anywhere, when you need it the most — whether your data is on-prem, or in multi-cloud or hybrid cloud environments. This holistic view helps streamline migrating your Spring Boot applications to the cloud. Plus, Elastic Cloud handles the security, maintenance, and upkeep, allowing you to drive your business forward with increased visibility, improved operations, and cyber resilience.
The release and timing of any features or functionality described in this post remain at Elastic's sole discretion. Any features or functionality not currently available may not be delivered on time or at all.
Share
- Share on Twitter
Share on Twitter
- Share on LinkedIn
Share on LinkedIn
- Share on Facebook
Share on Facebook
- Share by Email
Share by Email
- Print this page
Print