Anomaly detection overview
editAnomaly detection overview
editAnalyzing the past and present
editThe machine learning features automate the analysis of time series data by creating accurate baselines of normal behavior in the data and identifying anomalous patterns in that data. You can submit your data for analysis in batches or continuously in real-time datafeeds.
Using proprietary machine learning algorithms, the following circumstances are detected, scored, and linked with statistically significant influencers in the data:
- Anomalies related to temporal deviations in values, counts, or frequencies
- Statistical rarity
- Unusual behaviors for a member of a population
Automated periodicity detection and quick adaptation to changing data ensure that you don’t need to specify algorithms, models, or other data science-related configurations in order to get the benefits of machine learning.
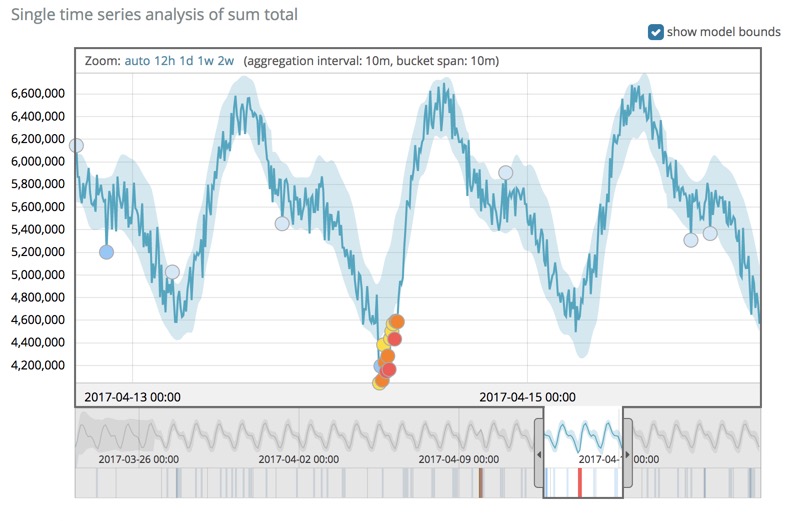
You can view the machine learning results in Kibana where, for example, charts illustrate the actual data values, the bounds for the expected values, and the anomalies that occur outside these bounds.
Forecasting the future
editAfter the machine learning features create baselines of normal behavior for your data, you can use that information to extrapolate future behavior.
You can use a forecast to estimate a time series value at a specific future date. For example, you might want to determine how many users you can expect to visit your website next Sunday at 0900.
You can also use it to estimate the probability of a time series value occurring at a future date. For example, you might want to determine how likely it is that your disk utilization will reach 100% before the end of next week.
Each forecast has a unique ID, which you can use to distinguish between forecasts that you created at different times. You can create a forecast by using the forecast anomaly detection jobs API or by using Kibana. For example:
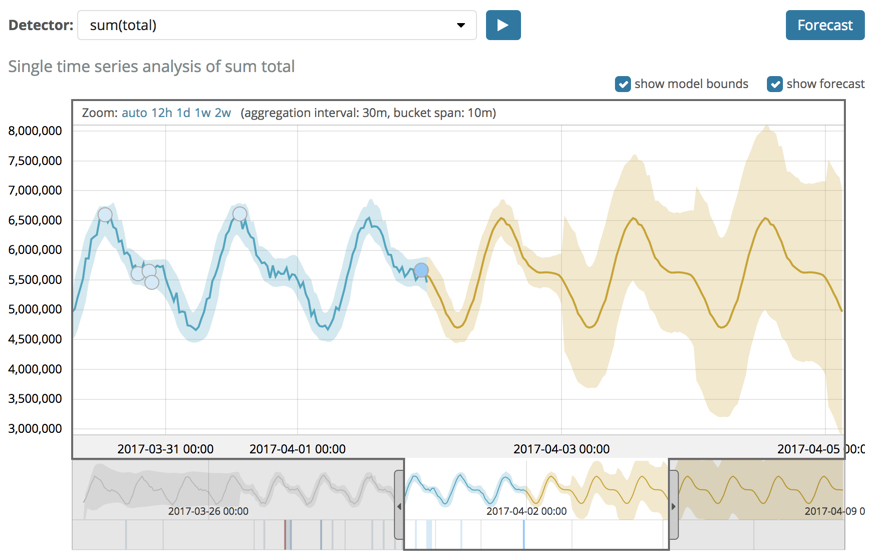
The yellow line in the chart represents the predicted data values. The shaded yellow area represents the bounds for the predicted values, which also gives an indication of the confidence of the predictions.
When you create a forecast, you specify its duration, which indicates how far the forecast extends beyond the last record that was processed. By default, the duration is 1 day. Typically the farther into the future that you forecast, the lower the confidence levels become (that is to say, the bounds increase). Eventually if the confidence levels are too low, the forecast stops. For more information about limitations that affect your ability to create a forecast, see Unsupported forecast configurations.
You can also optionally specify when the forecast expires. By default, it
expires in 14 days and is deleted automatically thereafter. You can specify a
different expiration period by using the expires_in parameter in the
forecast anomaly detection jobs API.
Anomaly detection algorithms
editThe anomaly detection machine learning features use a bespoke amalgamation of different techniques such as clustering, various types of time series decomposition, Bayesian distribution modeling, and correlation analysis. These analytics provide sophisticated real-time automated anomaly detection for time series data.
The machine learning analytics statistically model the time-based characteristics of your data by observing historical behavior and adapting to new data. The model represents a baseline of normal behavior and can therefore be used to determine how anomalous new events are.
Anomaly detection results are written for each bucket span. These results include scores that are aggregated in order to reduce noise and normalized in order to rank the most mathematically significant anomalies. For more information, see Bucket results and Influencer results.