Quick start
editQuick start
editThis guide helps beginners learn how to:
- Install and run Elasticsearch in a test environment
- Add data to Elasticsearch
- Search and sort data
- Extract fields from unstructured content during a search
Run Elasticsearch
editThe simplest way to set up Elasticsearch is to create a managed deployment with Elasticsearch Service on Elastic Cloud. If you prefer to manage your own test environment, you can install and run Elasticsearch using Docker.
- Sign up for a free trial.
- Follow the on-screen steps to create your first project.
Install and run Elasticsearch
- Install and start Docker Desktop.
-
Run:
docker network create elastic
docker pull docker.elastic.co/elasticsearch/elasticsearch:7.14.2
docker run --name es01-test --net elastic -p 127.0.0.1:9200:9200 -p 127.0.0.1:9300:9300 -e "discovery.type=single-node" docker.elastic.co/elasticsearch/elasticsearch:7.14.2
Install and run Kibana
To analyze, visualize, and manage Elasticsearch data using an intuitive UI, install Kibana.
-
In a new terminal session, run:
docker pull docker.elastic.co/kibana/kibana:7.14.2
docker run --name kib01-test --net elastic -p 127.0.0.1:5601:5601 -e "ELASTICSEARCH_HOSTS=http://es01-test:9200" docker.elastic.co/kibana/kibana:7.14.2
- To access Kibana, go to http://localhost:5601
Send requests to Elasticsearch
editYou send data and other requests to Elasticsearch using REST APIs. This lets you interact with Elasticsearch using any client that sends HTTP requests, such as curl. You can also use Kibana’s console to send requests to Elasticsearch.
Use curl
- To communicate with Elasticsearch using curl or another client, you need your cluster’s endpoint. Go to the Elasticsearch page and click Copy endpoint.
-
To submit an example API request, run the following curl command in a new terminal session. Replace
<password>with the password for theelasticuser. Replace<elasticsearch_endpoint>with your endpoint.curl -u elastic:<password> <elasticsearch_endpoint>/
Use Kibana
- Go to the Kibana page and click Launch.
-
Open Kibana’s main menu and go to Dev Tools > Console.
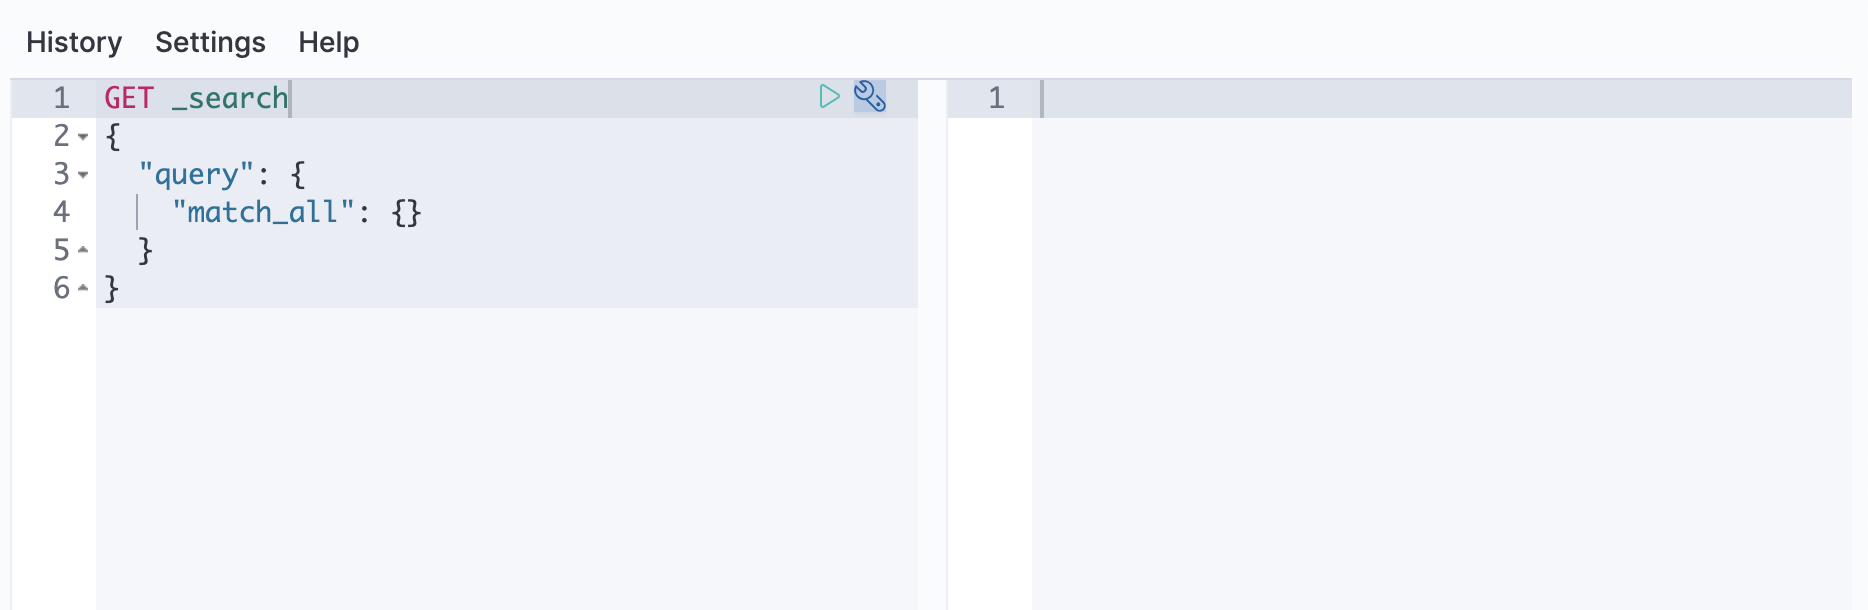
-
Run the following example API request in the console:
GET /
Use curl
To submit an example API request, run the following curl command in a new terminal session.
curl -X GET http://localhost:9200/
Use Kibana
-
Open Kibana’s main menu and go to Dev Tools > Console.
-
Run the following example API request in the console:
GET /
Add data
editYou add data to Elasticsearch as JSON objects called documents. Elasticsearch stores these documents in searchable indices.
For time series data, such as logs and metrics, you typically add documents to a data stream made up of multiple auto-generated backing indices.
A data stream requires an index template that matches its name. Elasticsearch uses this
template to configure the stream’s backing indices. Documents sent to a data
stream must have a @timestamp field.
Add a single document
editSubmit the following indexing request to add a single log entry to the
logs-my_app-default data stream. Since logs-my_app-default doesn’t exist, the
request automatically creates it using the built-in logs-*-* index template.
POST logs-my_app-default/_doc
{
  "@timestamp": "2099-05-06T16:21:15.000Z",
  "event": {
    "original": "192.0.2.42 - - [06/May/2099:16:21:15 +0000] \"GET /images/bg.jpg HTTP/1.0\" 200 24736"
  }
}
The response includes metadata that Elasticsearch generates for the document:
-
The backing
_indexthat contains the document. Elasticsearch automatically generates the names of backing indices. -
A unique
_idfor the document within the index.
{
  "_index": ".ds-logs-my_app-default-2099-05-06-000001",
  "_type": "_doc",
  "_id": "gl5MJXMBMk1dGnErnBW8",
  "_version": 1,
  "result": "created",
  "_shards": {
    "total": 2,
    "successful": 1,
    "failed": 0
  },
  "_seq_no": 0,
  "_primary_term": 1
}
Add multiple documents
editUse the _bulk endpoint to add multiple documents in one request. Bulk data
must be newline-delimited JSON (NDJSON). Each line must end in a newline
character (\n), including the last line.
PUT logs-my_app-default/_bulk
{ "create": { } }
{ "@timestamp": "2099-05-07T16:24:32.000Z", "event": { "original": "192.0.2.242 - - [07/May/2020:16:24:32 -0500] \"GET /images/hm_nbg.jpg HTTP/1.0\" 304 0" } }
{ "create": { } }
{ "@timestamp": "2099-05-08T16:25:42.000Z", "event": { "original": "192.0.2.255 - - [08/May/2099:16:25:42 +0000] \"GET /favicon.ico HTTP/1.0\" 200 3638" } }
Search data
editIndexed documents are available for search in near real-time. The following
search matches all log entries in logs-my_app-default and sorts them by
@timestamp in descending order.
GET logs-my_app-default/_search
{
  "query": {
    "match_all": { }
  },
  "sort": [
    {
      "@timestamp": "desc"
    }
  ]
}
By default, the hits section of the response includes up to the first 10
documents that match the search. The _source of each hit contains the original
JSON object submitted during indexing.
{
  "took": 2,
  "timed_out": false,
  "_shards": {
    "total": 1,
    "successful": 1,
    "skipped": 0,
    "failed": 0
  },
  "hits": {
    "total": {
      "value": 3,
      "relation": "eq"
    },
    "max_score": null,
    "hits": [
      {
        "_index": ".ds-logs-my_app-default-2099-05-06-000001",
        "_type": "_doc",
        "_id": "PdjWongB9KPnaVm2IyaL",
        "_score": null,
        "_source": {
          "@timestamp": "2099-05-08T16:25:42.000Z",
          "event": {
            "original": "192.0.2.255 - - [08/May/2099:16:25:42 +0000] \"GET /favicon.ico HTTP/1.0\" 200 3638"
          }
        },
        "sort": [
          4081940742000
        ]
      },
      ...
    ]
  }
}
Get specific fields
editParsing the entire _source is unwieldy for large documents. To exclude it from
the response, set the _source parameter to false. Instead, use the fields
parameter to retrieve the fields you want.
GET logs-my_app-default/_search
{
  "query": {
    "match_all": { }
  },
  "fields": [
    "@timestamp"
  ],
  "_source": false,
  "sort": [
    {
      "@timestamp": "desc"
    }
  ]
}
The response contains each hit’s fields values as a flat array.
{
  ...
  "hits": {
    ...
    "hits": [
      {
        "_index": ".ds-logs-my_app-default-2099-05-06-000001",
        "_type": "_doc",
        "_id": "PdjWongB9KPnaVm2IyaL",
        "_score": null,
        "fields": {
          "@timestamp": [
            "2099-05-08T16:25:42.000Z"
          ]
        },
        "sort": [
          4081940742000
        ]
      },
      ...
    ]
  }
}
Search a date range
editTo search across a specific time or IP range, use a range query.
GET logs-my_app-default/_search
{
  "query": {
    "range": {
      "@timestamp": {
        "gte": "2099-05-05",
        "lt": "2099-05-08"
      }
    }
  },
  "fields": [
    "@timestamp"
  ],
  "_source": false,
  "sort": [
    {
      "@timestamp": "desc"
    }
  ]
}
You can use date math to define relative time ranges. The following query
searches for data from the past day, which won’t match any log entries in
logs-my_app-default.
GET logs-my_app-default/_search
{
  "query": {
    "range": {
      "@timestamp": {
        "gte": "now-1d/d",
        "lt": "now/d"
      }
    }
  },
  "fields": [
    "@timestamp"
  ],
  "_source": false,
  "sort": [
    {
      "@timestamp": "desc"
    }
  ]
}
Extract fields from unstructured content
editYou can extract runtime fields from unstructured content, such as log messages, during a search.
Use the following search to extract the source.ip runtime field from
event.original. To include it in the response, add source.ip to the fields
parameter.
GET logs-my_app-default/_search
{
  "runtime_mappings": {
    "source.ip": {
      "type": "ip",
      "script": """
        String sourceip=grok('%{IPORHOST:sourceip} .*').extract(doc[ "event.original" ].value)?.sourceip;
        if (sourceip != null) emit(sourceip);
      """
    }
  },
  "query": {
    "range": {
      "@timestamp": {
        "gte": "2099-05-05",
        "lt": "2099-05-08"
      }
    }
  },
  "fields": [
    "@timestamp",
    "source.ip"
  ],
  "_source": false,
  "sort": [
    {
      "@timestamp": "desc"
    }
  ]
}
Combine queries
editYou can use the bool query to combine multiple queries. The following search
combines two range queries: one on @timestamp and one on the source.ip
runtime field.
GET logs-my_app-default/_search
{
  "runtime_mappings": {
    "source.ip": {
      "type": "ip",
      "script": """
        String sourceip=grok('%{IPORHOST:sourceip} .*').extract(doc[ "event.original" ].value)?.sourceip;
        if (sourceip != null) emit(sourceip);
      """
    }
  },
  "query": {
    "bool": {
      "filter": [
        {
          "range": {
            "@timestamp": {
              "gte": "2099-05-05",
              "lt": "2099-05-08"
            }
          }
        },
        {
          "range": {
            "source.ip": {
              "gte": "192.0.2.0",
              "lte": "192.0.2.240"
            }
          }
        }
      ]
    }
  },
  "fields": [
    "@timestamp",
    "source.ip"
  ],
  "_source": false,
  "sort": [
    {
      "@timestamp": "desc"
    }
  ]
}
Aggregate data
editUse aggregations to summarize data as metrics, statistics, or other analytics.
The following search uses an aggregation to calculate the
average_response_size using the http.response.body.bytes runtime field. The
aggregation only runs on documents that match the query.
GET logs-my_app-default/_search
{
  "runtime_mappings": {
    "http.response.body.bytes": {
      "type": "long",
      "script": """
        String bytes=grok('%{COMMONAPACHELOG}').extract(doc[ "event.original" ].value)?.bytes;
        if (bytes != null) emit(Integer.parseInt(bytes));
      """
    }
  },
  "aggs": {
    "average_response_size":{
      "avg": {
        "field": "http.response.body.bytes"
      }
    }
  },
  "query": {
    "bool": {
      "filter": [
        {
          "range": {
            "@timestamp": {
              "gte": "2099-05-05",
              "lt": "2099-05-08"
            }
          }
        }
      ]
    }
  },
  "fields": [
    "@timestamp",
    "http.response.body.bytes"
  ],
  "_source": false,
  "sort": [
    {
      "@timestamp": "desc"
    }
  ]
}
The response’s aggregations object contains aggregation results.
{
  ...
  "aggregations" : {
    "average_response_size" : {
      "value" : 12368.0
    }
  }
}
Explore more search options
editTo keep exploring, index more data to your data stream and check out Common search options.
Clean up
editWhen you’re done, delete your test data stream and its backing indices.
DELETE _data_stream/logs-my_app-default
You can also delete your test deployment.
Click Delete deployment from the deployment overview page and follow the prompts.
To stop your Elasticsearch and Kibana Docker containers, run:
docker stop es01-test
docker stop kib01-test
To remove the containers and their network, run:
docker network rm elastic
docker rm es01-test
docker rm kib01-test
What’s next?
edit- Get the most out of your time series data by setting up data tiers and ILM. See Use Elasticsearch for time series data.
- Use Fleet and Elastic Agent to collect logs and metrics directly from your data sources and send them to Elasticsearch. See the Fleet quick start guide.
- Use Kibana to explore, visualize, and manage your Elasticsearch data. See the Kibana quick start guide.