Get System Logs and Metrics into Elasticsearch with Beats System Modules
Want to learn more about the differences between the Amazon Elasticsearch Service and our official Elasticsearch Service? Visit our AWS Elasticsearch comparison page.
In a recent webinar, we gave an introduction to getting logs and metrics into the Elastic Stack. For people that prefer books over television, I'm going to dive into those same concepts again here in this blog. For my example, here is a simple application environment. An Apache HTTP server with a Redis backend running on Linux. Let’s look at how to get the operating system logs and metrics indexed into Elasticsearch, and visualized with Kibana.
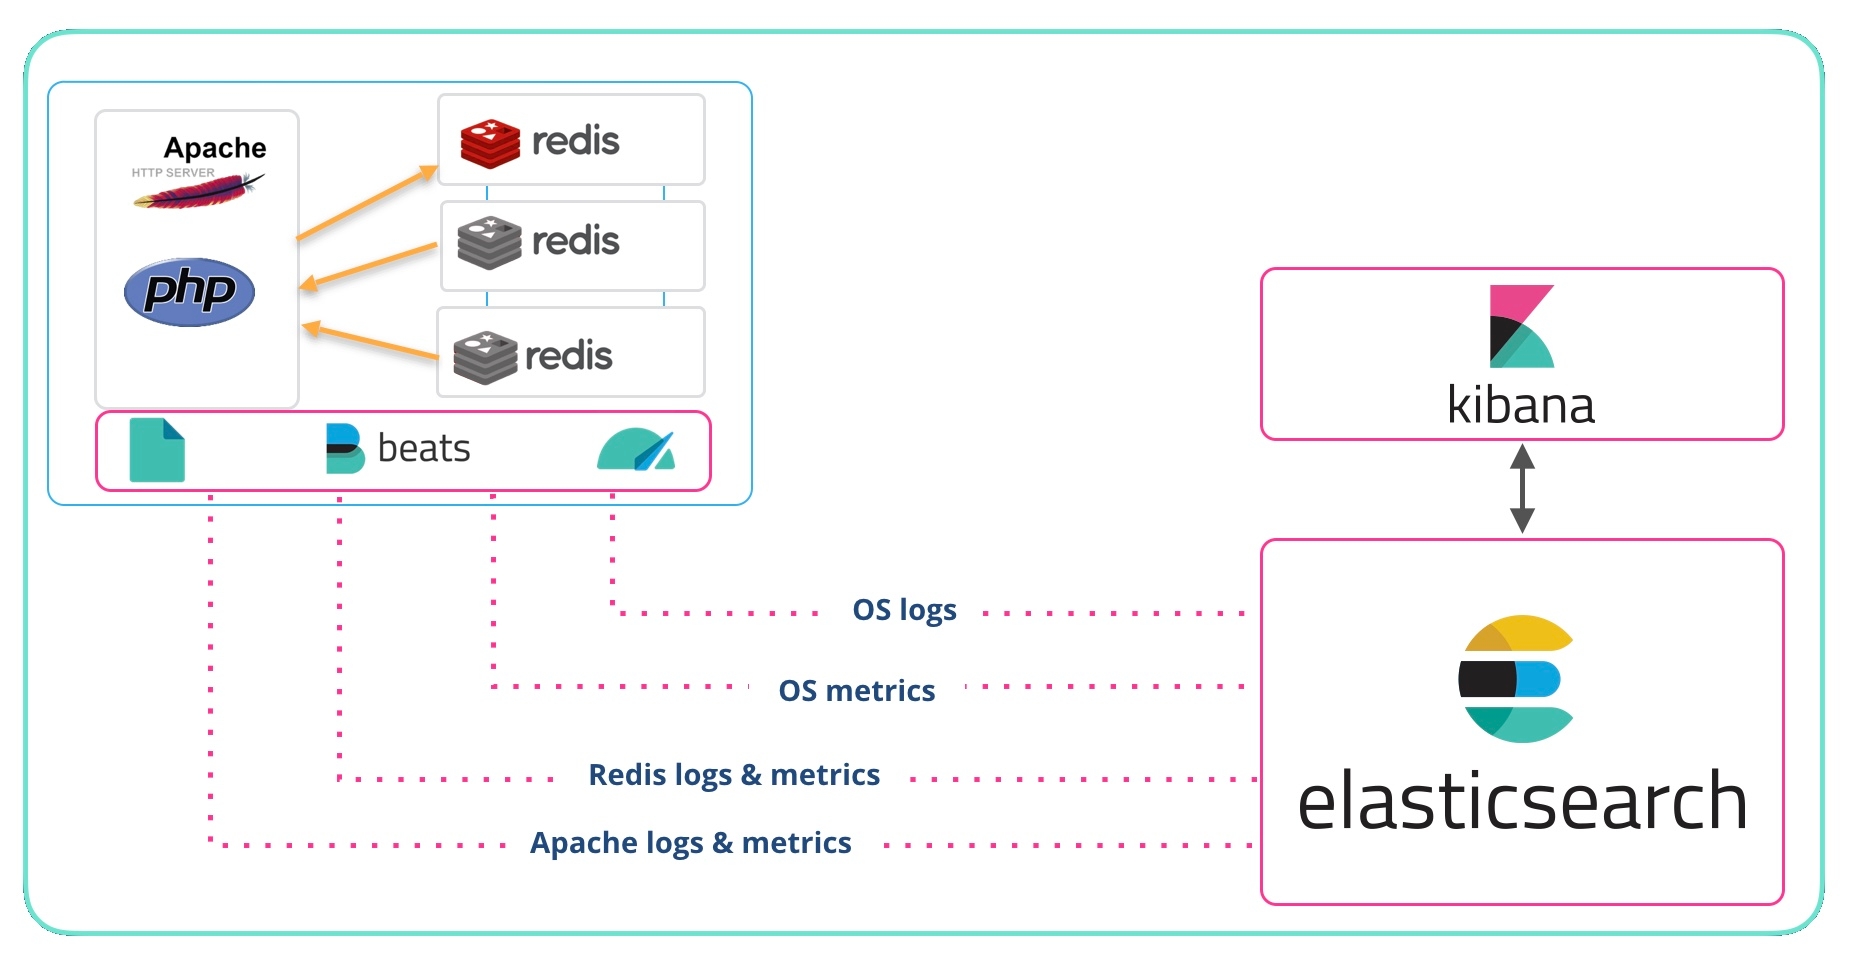
Elastic has several methods for getting data in to Elasticsearch:
- Beats — Lightweight shippers from Elastic and our Community
- Logstash — An Elastic server-side data processing pipeline
- Ingest Node — The native ingest method for Elasticsearch
- REST API — Read, write, search, reindex, and more via REST
- Java client, .Net API, and many more Elasticsearch clients
In this post we will talk about Beats, and specifically the System modules of Filebeat and Metricbeat. The System modules are described in the Filebeat docs and Metricbeat docs. The Filebeat System module grabs syslog and auth logs from Unix-like systems such as Linux and macOS. The Metricbeat System module collects CPU, memory, disk, etc. from the system. When you try this yourself, you can deploy modules for whatever you have running (Apache, NGINX, MySQL, Redis, Postgres, Microsoft Windows Server, etc.).
Before we suggest that you deploy Beats and start sending data, let's have a look at this out-of-the-box dashboard. This shows you both graphically and in a columnar format the contents of your syslog files from whatever systems you have Filebeat and the System module deployed on.
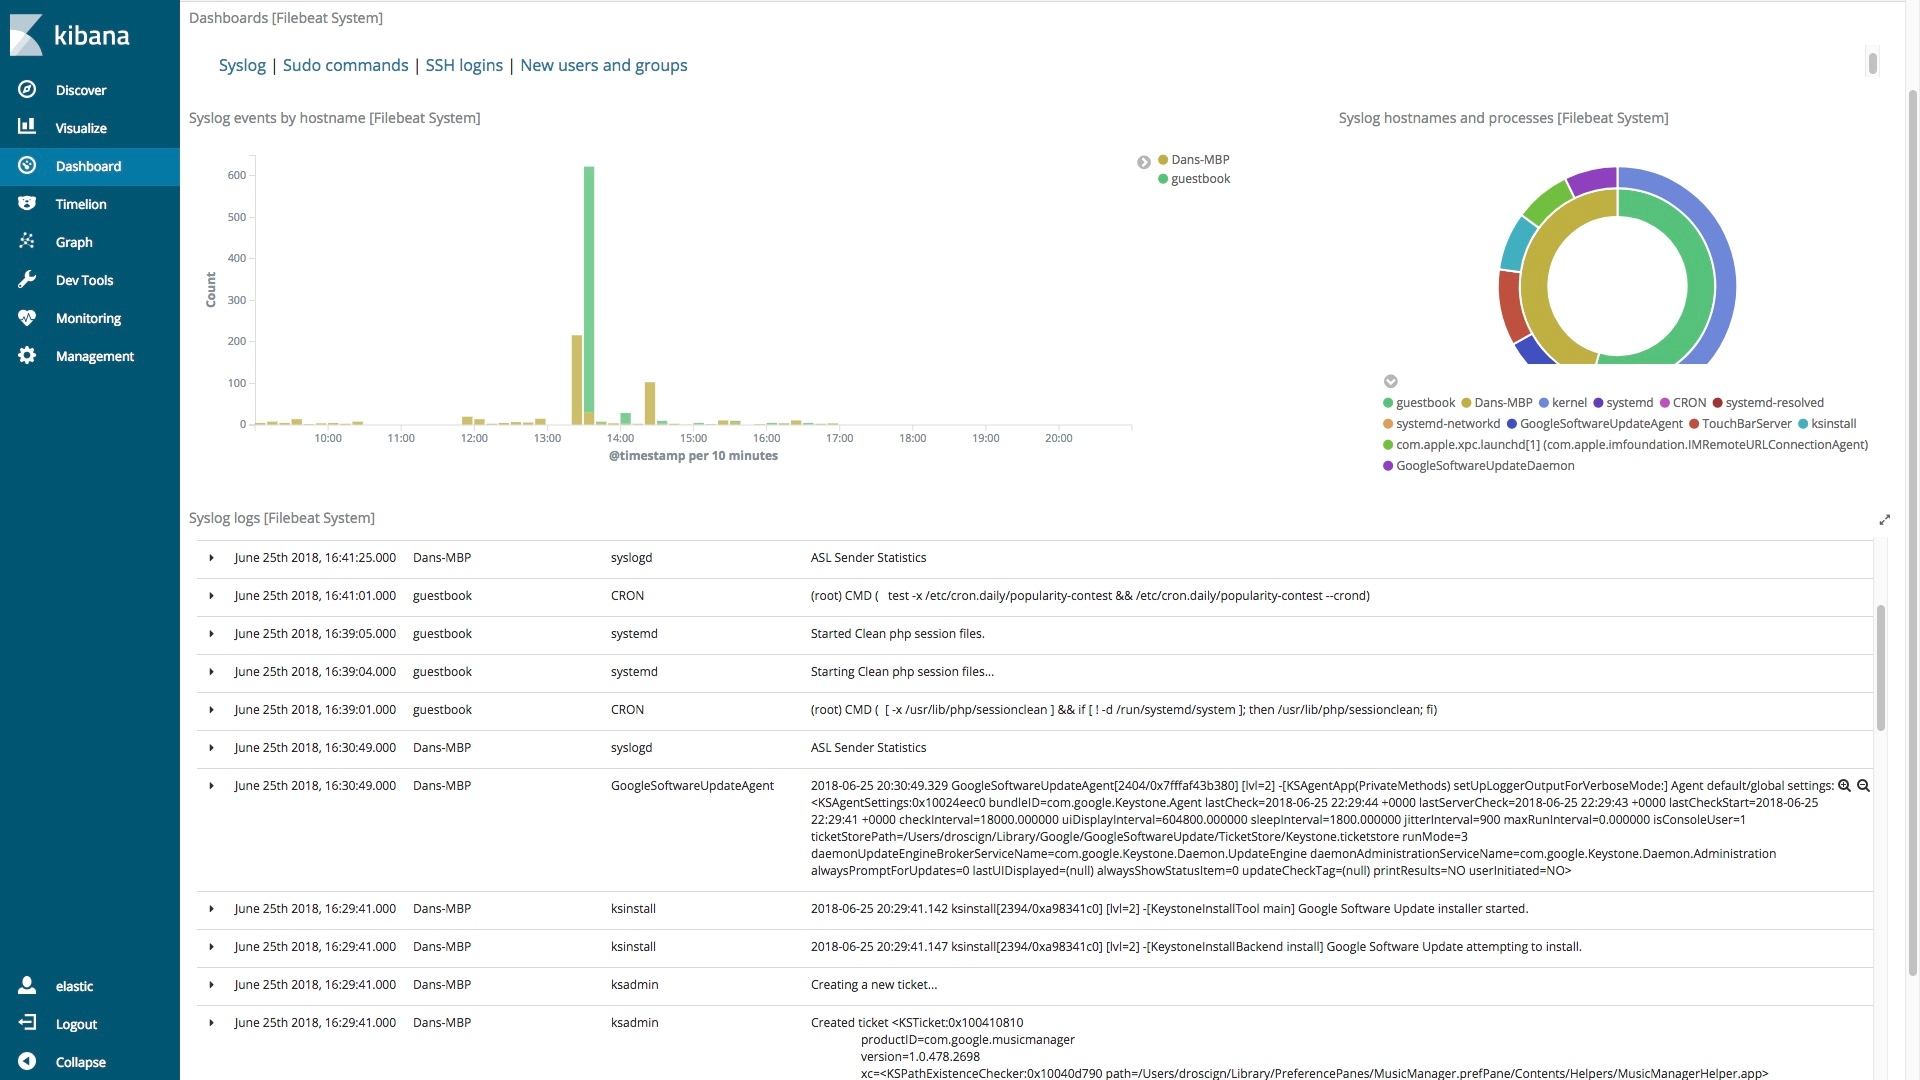
In the upper right of the dashboard is a donut visualization that provides a breakdown by host and command:
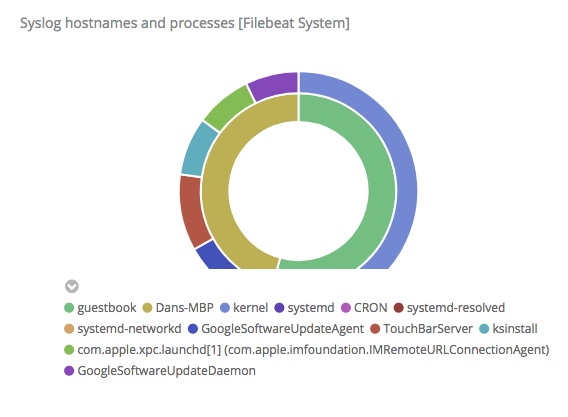
This is an interactive donut, not a chocolate covered one. When you click on a section it filters all of the information on the dashboard. If I click on the inner green section, then the entire dashboard is limited to information about the Linux system guestbook:
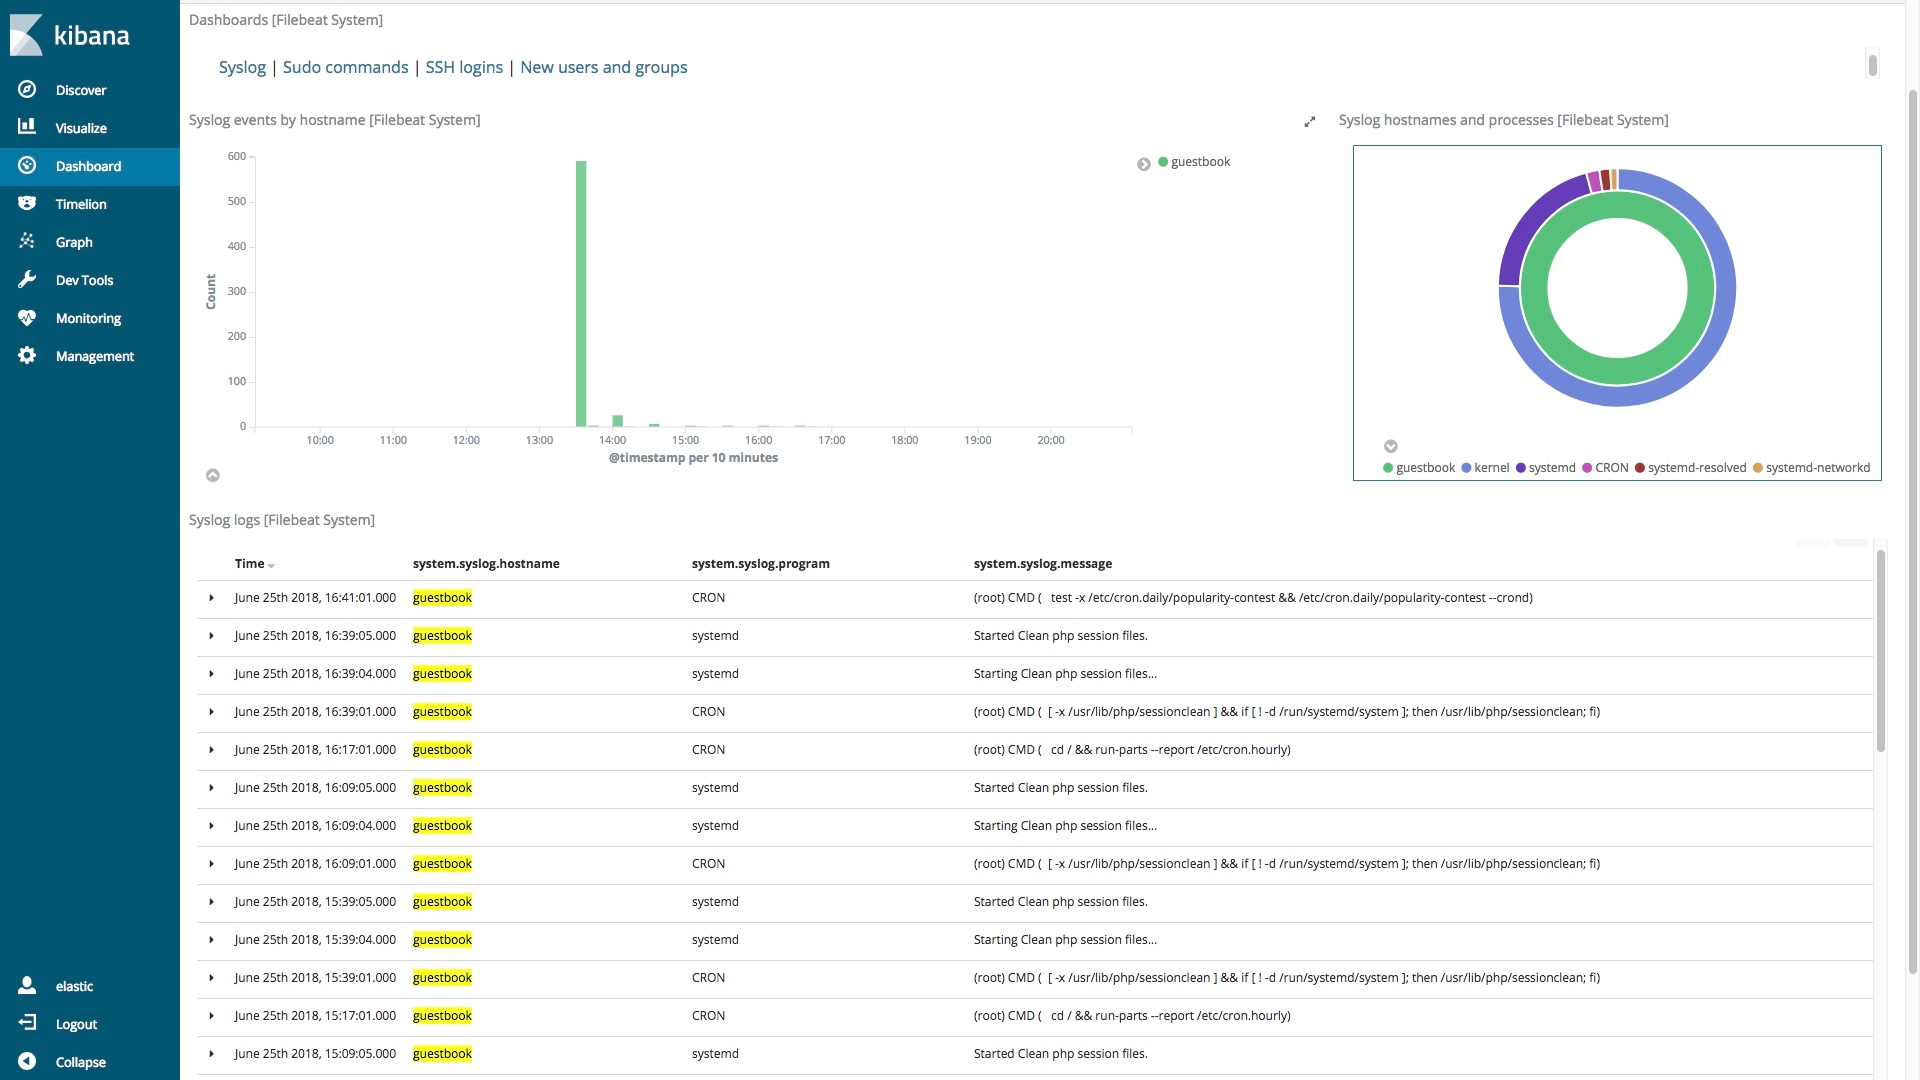
Notice that the hostname column only contains guestbook, and it is highlighted as Kibana highlights filter or search matches. Clicking the green section of the donut filtered on system.syslog.hostname:”guestbook”:

Let’s take a quick look at the Metricbeat System module and then we'll visit the great Kibana Home Add Data page that guides you through deploying Beats and modules.
Here is part of the Metricbeat Host overview for one of my systems:
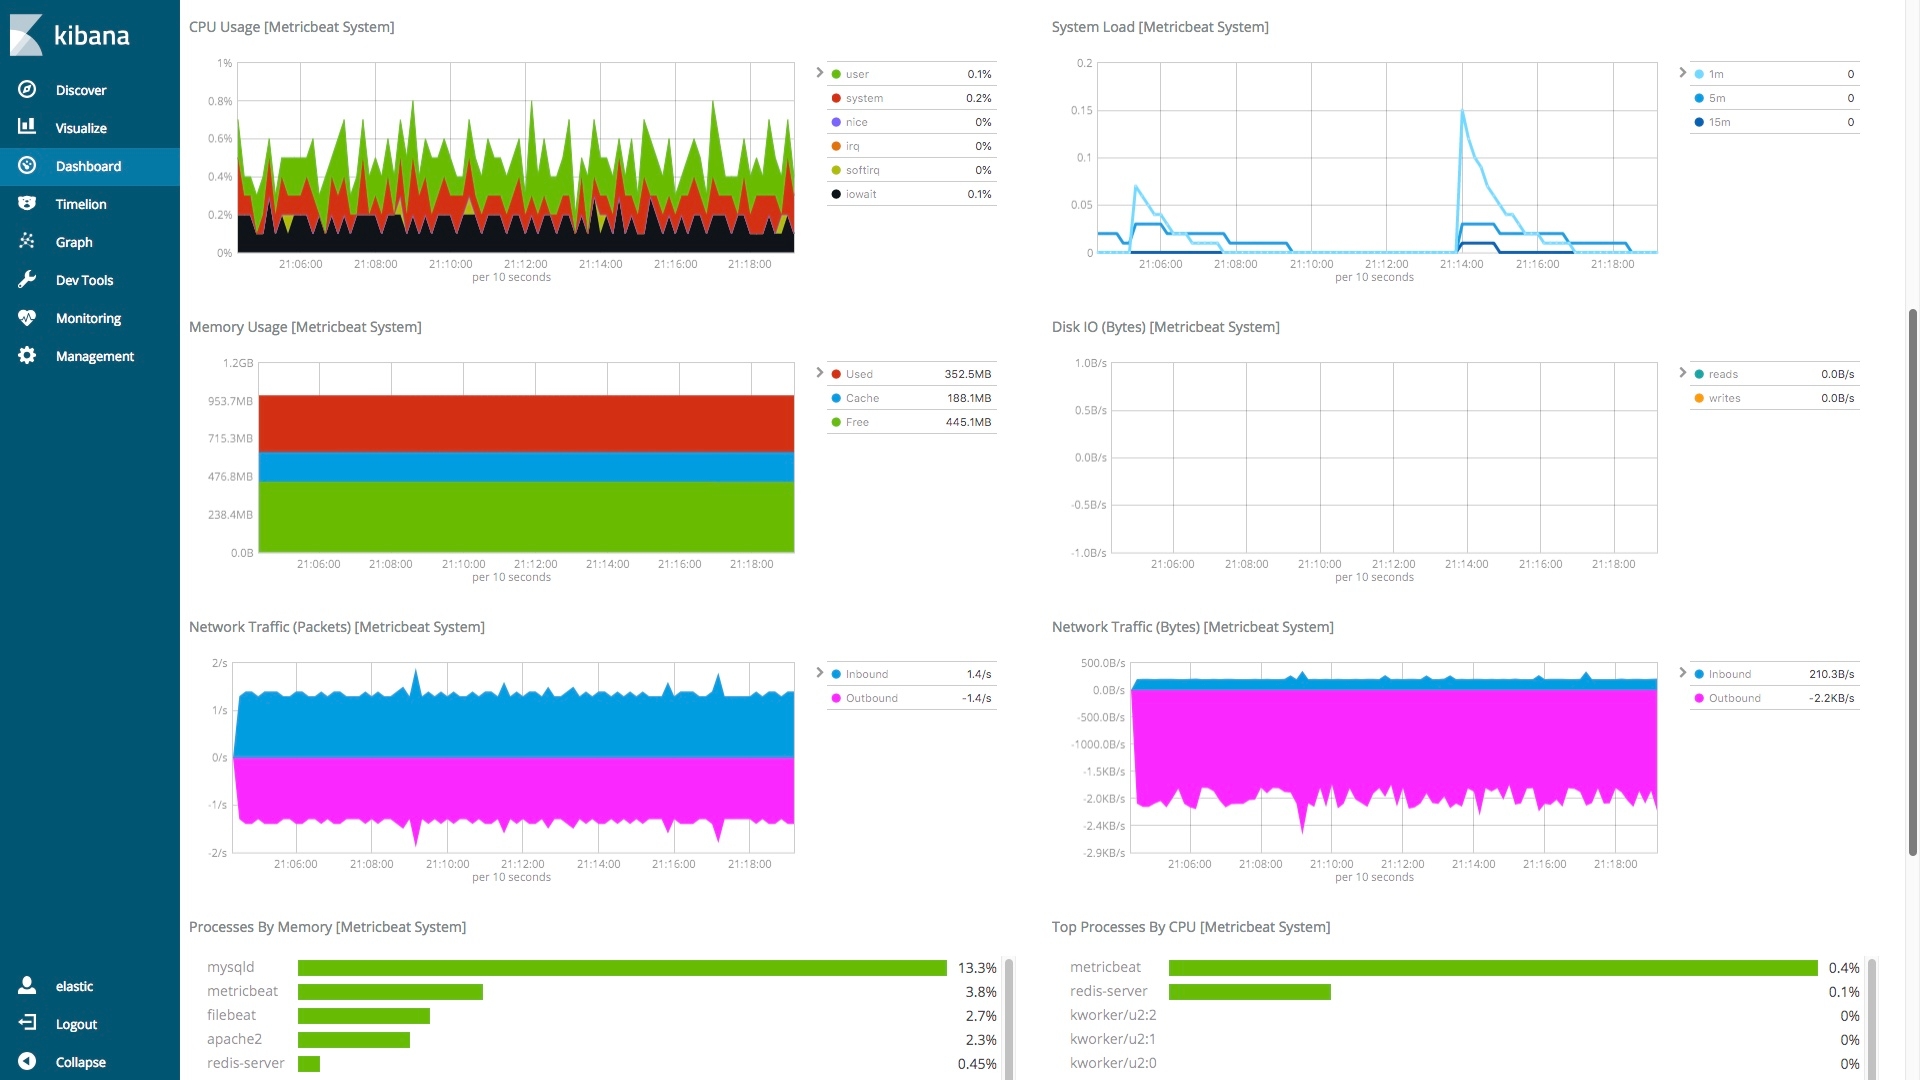
With a quick look, we can see if there are unusual things happening by looking at the shapes in the charts. Finding root causes by looking at dashboards is great, but to take things a step further we recommend that you proactively use Machine Learning and Alerts.
Now it is your turn to give it a shot. Recreating what I did here should only take you a short time.
First, I deployed the hosted Elasticsearch Service in Elastic Cloud — which you could do with a 14-day free trial. Alternatively, you can download and install Elasticsearch and Kibana locally. Both options work the same.
Once you have your Elasticsearch and Kibana running, log into Kibana. Next, go to the Kibana Home by click on the Kibana icon in the top left corner. Then click Add log data.

Choose to send System logs.

Now follow the step by step instructions that are provided in Kibana, and you will have Filebeat sending system data from whichever system you have it installed on. Once you've finished that, repeat those three steps, but add System metrics this time.
Note: If you want to send other data, for example NGINX logs, in addition to the System logs you don’t have to reinstall Filebeat, just run the commands to enable the new module, setup the module, and restart the beat. To see a full list of steps, please consult the Filebeat Modules and Metricbeat Modules documentation.
When you ran the enable and setup commands here is what happened behind the scenes (at nosebleed level):
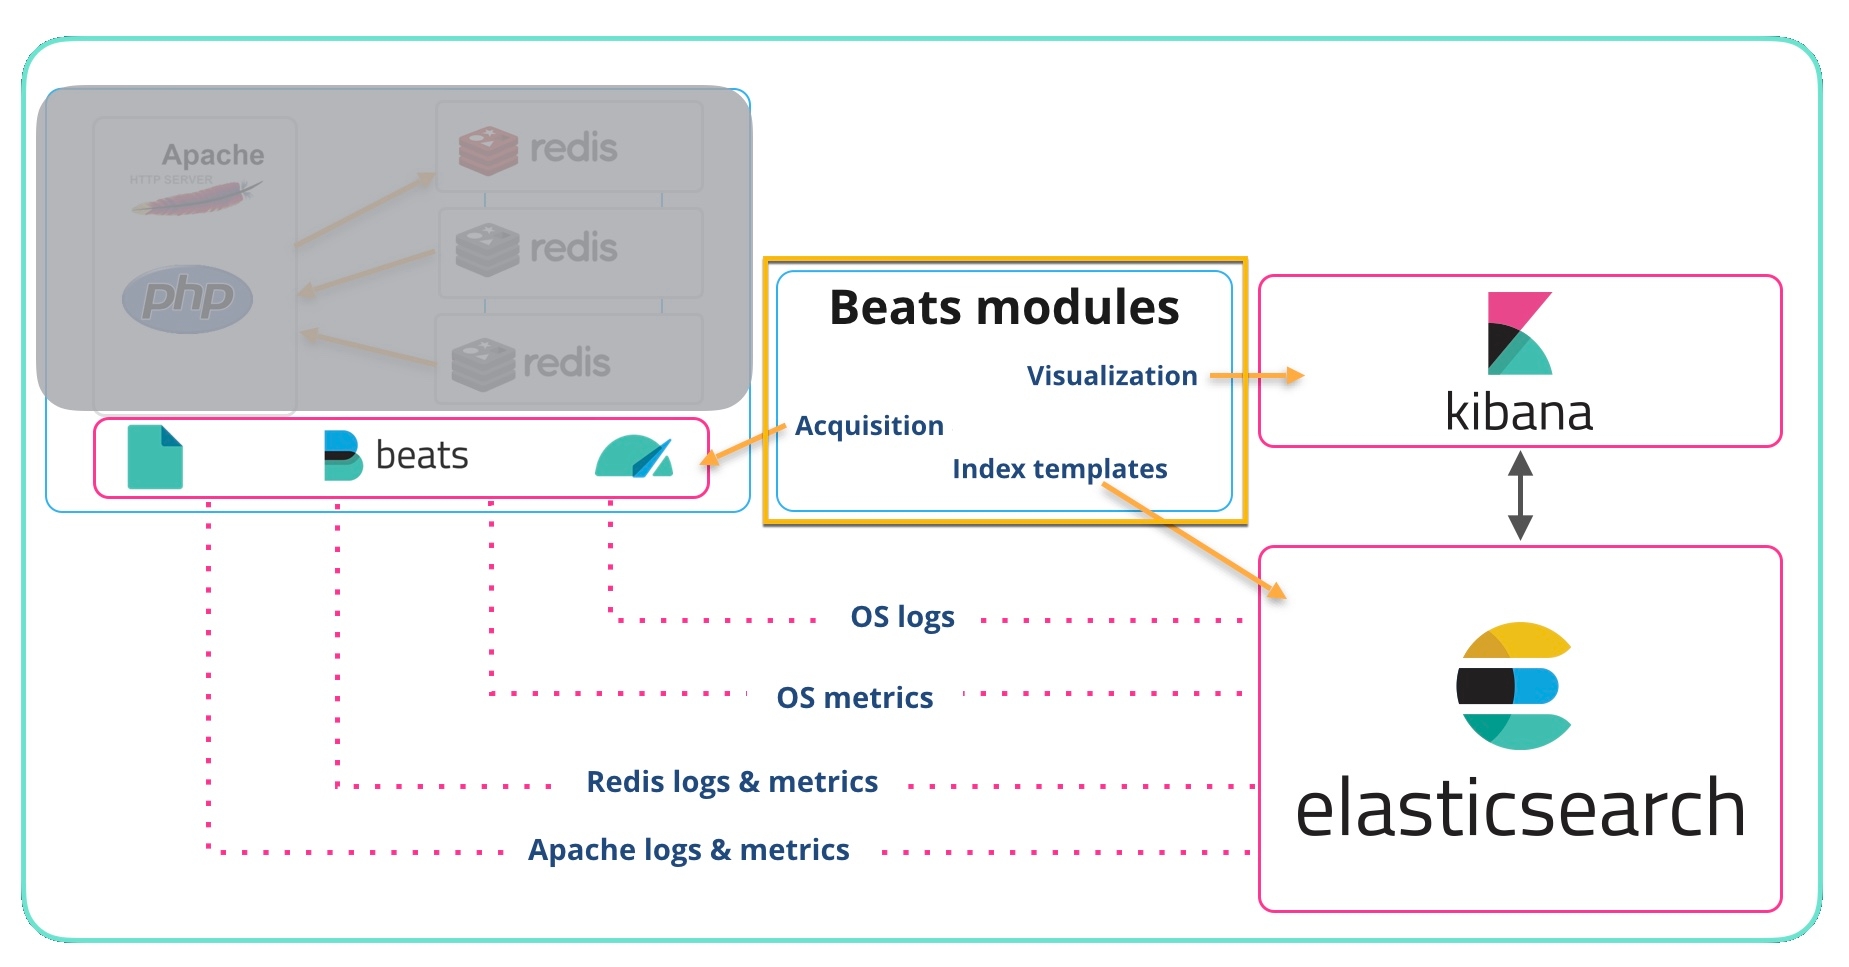
- Acquisition (file paths, ports, etc.) information got added to the Beat — For example, if you were running Filebeat on Linux and enabled the System module Filebeat would look for /var/log/syslog (among other logs) tag the records and send them on to Elasticsearch Ingest Node.
- Index templates for each log or metric type get added to Elasticsearch so that the data is parsed, stored, and indexed efficiently.
- Visualizations and Dashboards got added to Kibana — At the top of this post the default Filebeat System Syslog dashboard was shown. This and other dashboards were deployed into Kibana when the setup command was run.
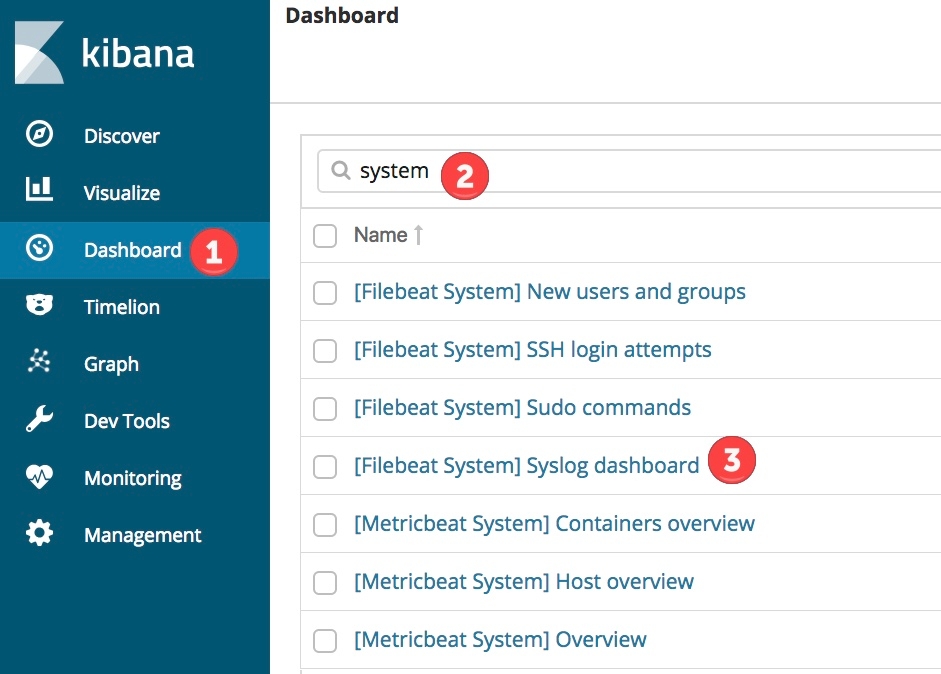
You should have data flowing in now, so open the Kibana Dashboards navigation, and pick one of the dashboards related to the Beat and modules that you deployed.
Navigate around, and I hope you will agree that looking at this information visually is more efficient than:
tail -f /var/log/syslog | grep -i foo …