Elastic Logs GA released
We are excited to announce general availability of Elastic Logs, a console-like experience for working with logs using the Elastic Stack. If you can't wait to try it out, spin up the latest version of the Elastic Stack in Elasticsearch Service (on Elastic Cloud) or download and run it locally.
Elastic Logs expects very little in a way of data input -- a @timestamp and message fields are all that is required for the application to stream logs in real time or search them historically. However, if you extract fields from your logs, the Logs UI will help you compose structured queries using auto-complete, helping you get started with your analysis faster. The best way to receive structured logs from known log files is Filebeat, an open source log shipper (check out existing modules here).
We released Elastic Logs as beta in 6.5, and based on feedback from you, we've been hard at work to improve it. Thank you to all the users that have tried out the product and engaged with us on Discuss and Github.
Below we describe some of the key improvements we made on the road to GA.
Source Configuration UI
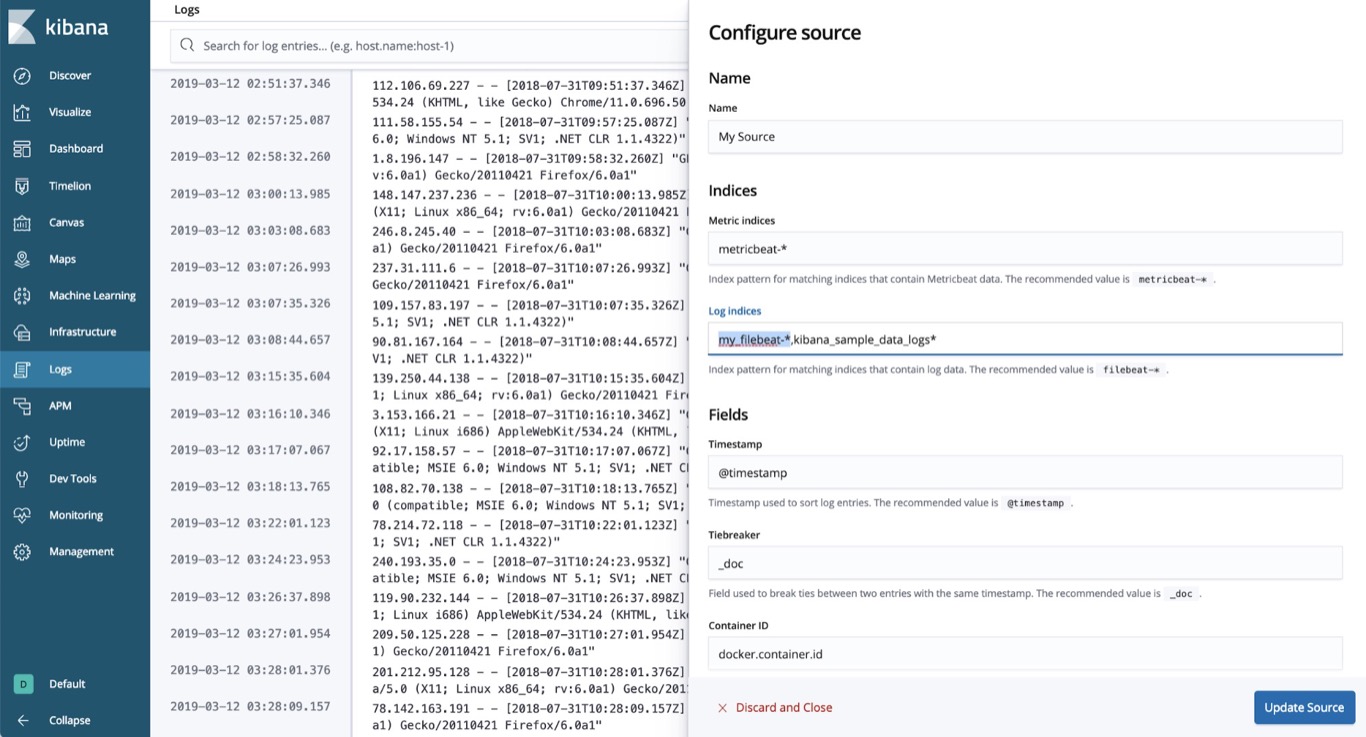
The Logs UI works out of the box with Filebeat default index and field names. If you change those defaults, it was previously possible to adjust the settings using kibana.yml. The 6.7 release makes that process even easier by adding an in context flyout that allows you to configure these settings from within the Logs application. Just change what you need, and click "Update Source".
Log event details flyout
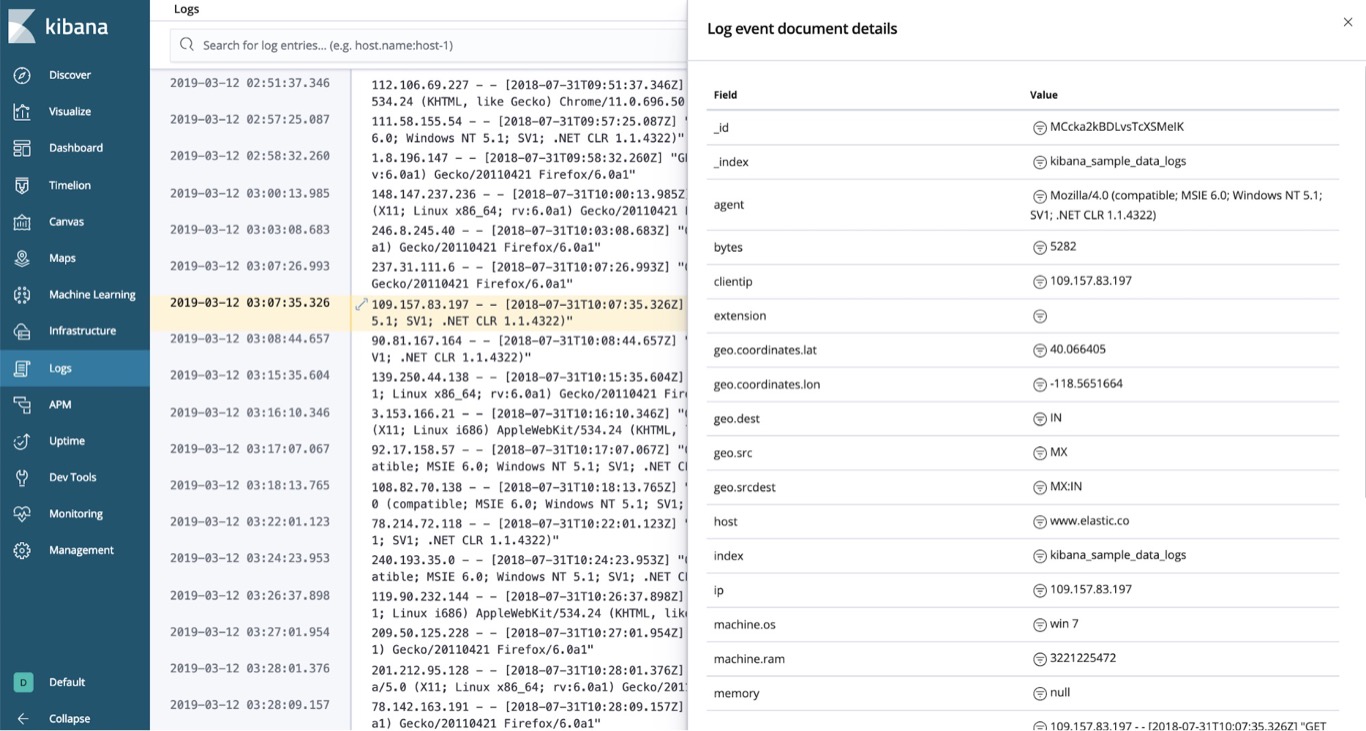
While looking at the log message field is most actionable as you search and filter your logs, once you've found the event you are looking for, you will want to examine metadata and structured fields behind it. The "Log event document details" flyout allows you to do that with a click of a button, without losing context. In the flyout, the icons next to the field values will enable you to filter the logs per that value, further honing the workflow of working with logs.
Support for serverless log shipping with Functionbeat
In 6.5, we added Functionbeat to support shipping logs in a ‘serverless' way. Functionbeat runs as a function (initially in AWS Lambda) and supports a number of inputs, including AWS Cloudwatch Logs, SQS, and Kinesis. In instances where logs are shipped by default in the schema the Logs UI recognizes, with @timestamp and message fields present, you can use the Logs UI to browse these logs right away! For other inputs, where the schema may diverge from the expected default, you can use the Source Configuration UI to adjust settings to view your logs.
Observability using the Elastic Stack
The 6.7 release also brings general availability of the Infrastructure and Uptime solutions. In addition to APM, these solutions are a part of the broader ‘observability' story using the Elastic Stack.

What's next
To experience Elastic Logs, spin up the latest version of the Elastic Stack in Elastic Cloud Elasticsearch Service or download and run it locally.
This GA release means you can use this solution in production, but that does not mean that we are done! We are going to continue evolving and improving Elastic Infrastructure. Please engage with us on Discuss with questions and feedback.
Also, do not hesitate to jump into Github and look at issues labeled with ":Logs UI". All of our discussions are in the open, and we'd like you, our users, to weigh in! Some important enhancements we're looking at for near term releases include support for custom structured logs with pin field as column and view surrounding logs.