Elastic and AWS: Seamlessly ingest logs and metrics into a unified platform with ready-to-use integrations

 Share on Twitter
Share on Twitter

 Share on LinkedIn
Share on LinkedIn

 Share on Facebook
Share on Facebook

 Share by Email
Share by Email

 Print this page
Print
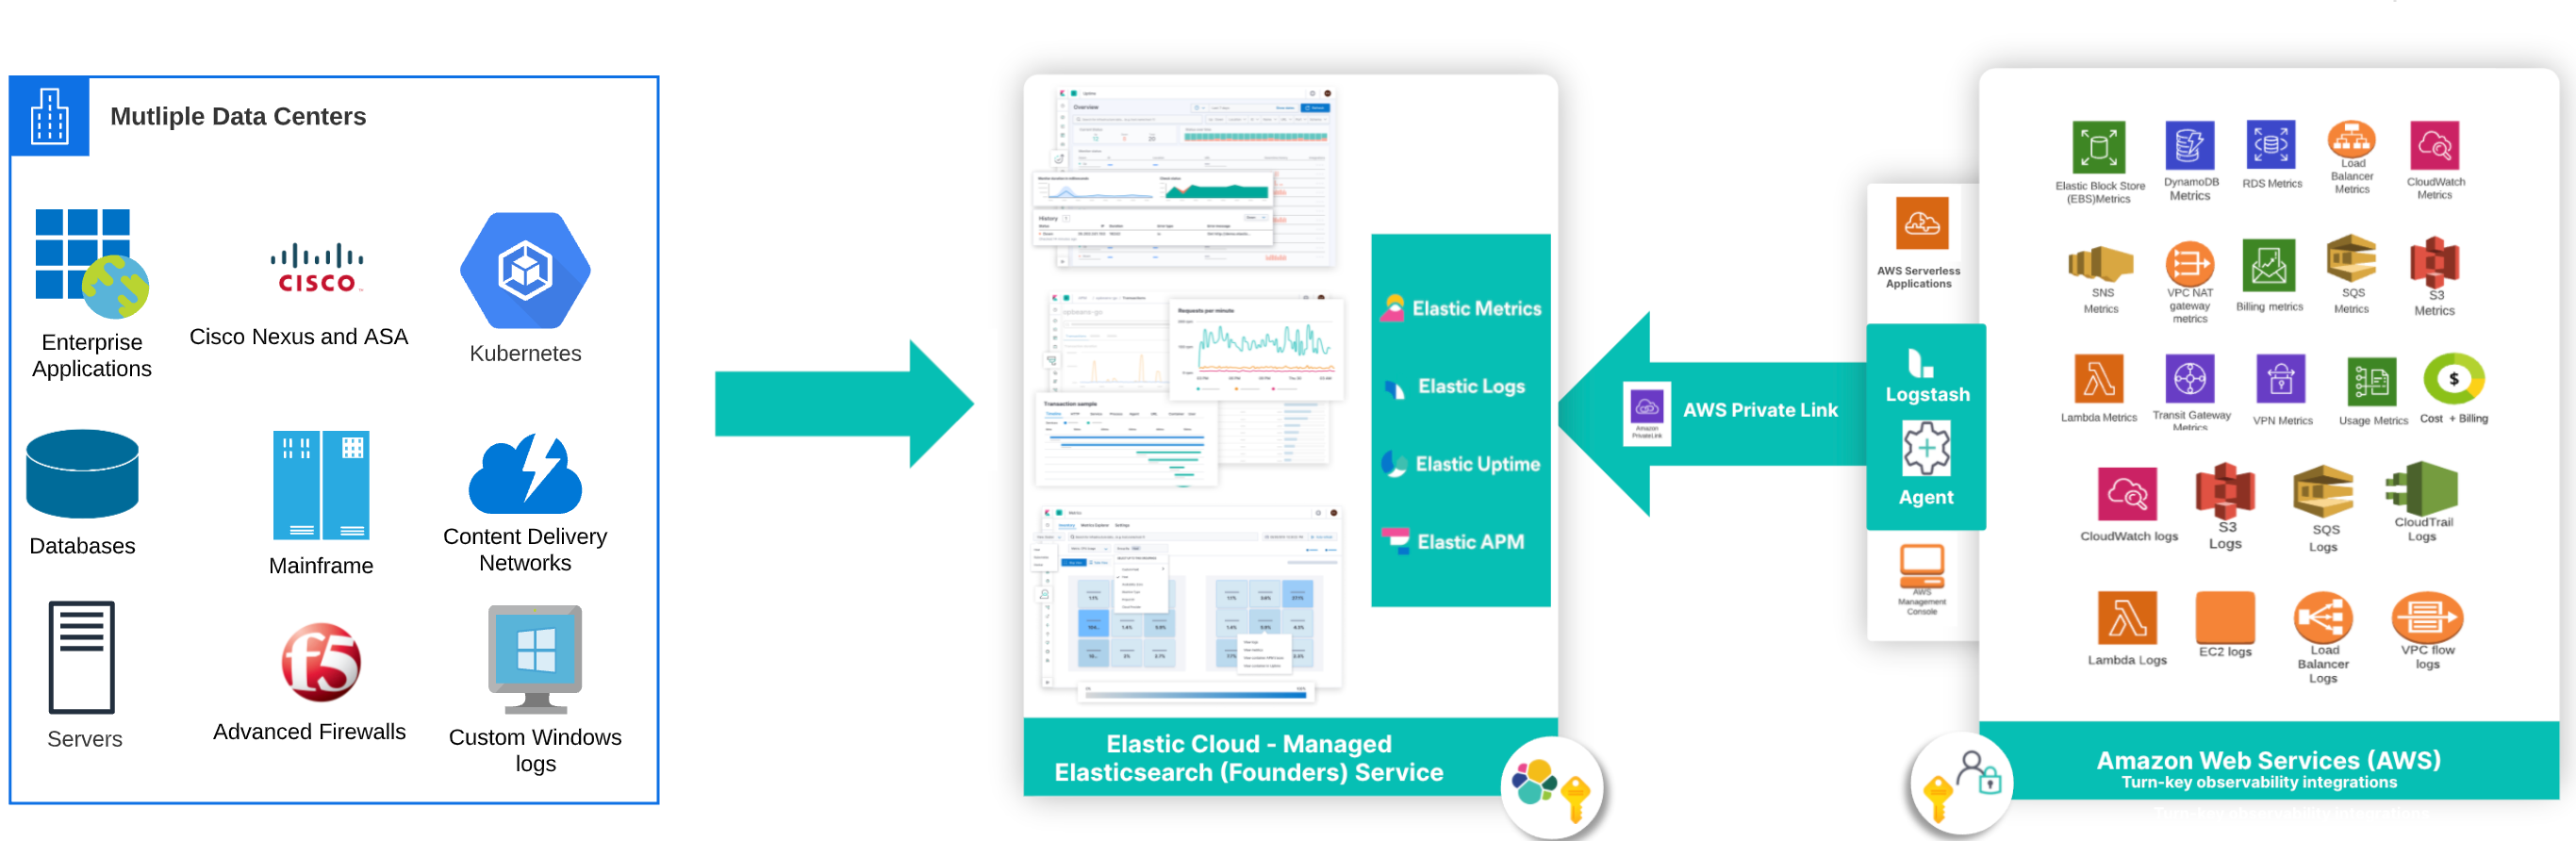
Many organizations are using Amazon Web Services (AWS) for agility and cost-efficiency benefits. As you quickly spin-up applications, instances, and containers it is critical to be able maintain a comprehensive view of operations across your environment and ingest data from different sources in real-time.
Elastic and AWS are working together to bring you a single unified platform that allows you to monitor, analyze, secure and protect your AWS and on-premises data sets. As AWS continues to expand, Elastic continues to add product integrations with AWS to streamline data ingestion and simplify the path to actionable insights.
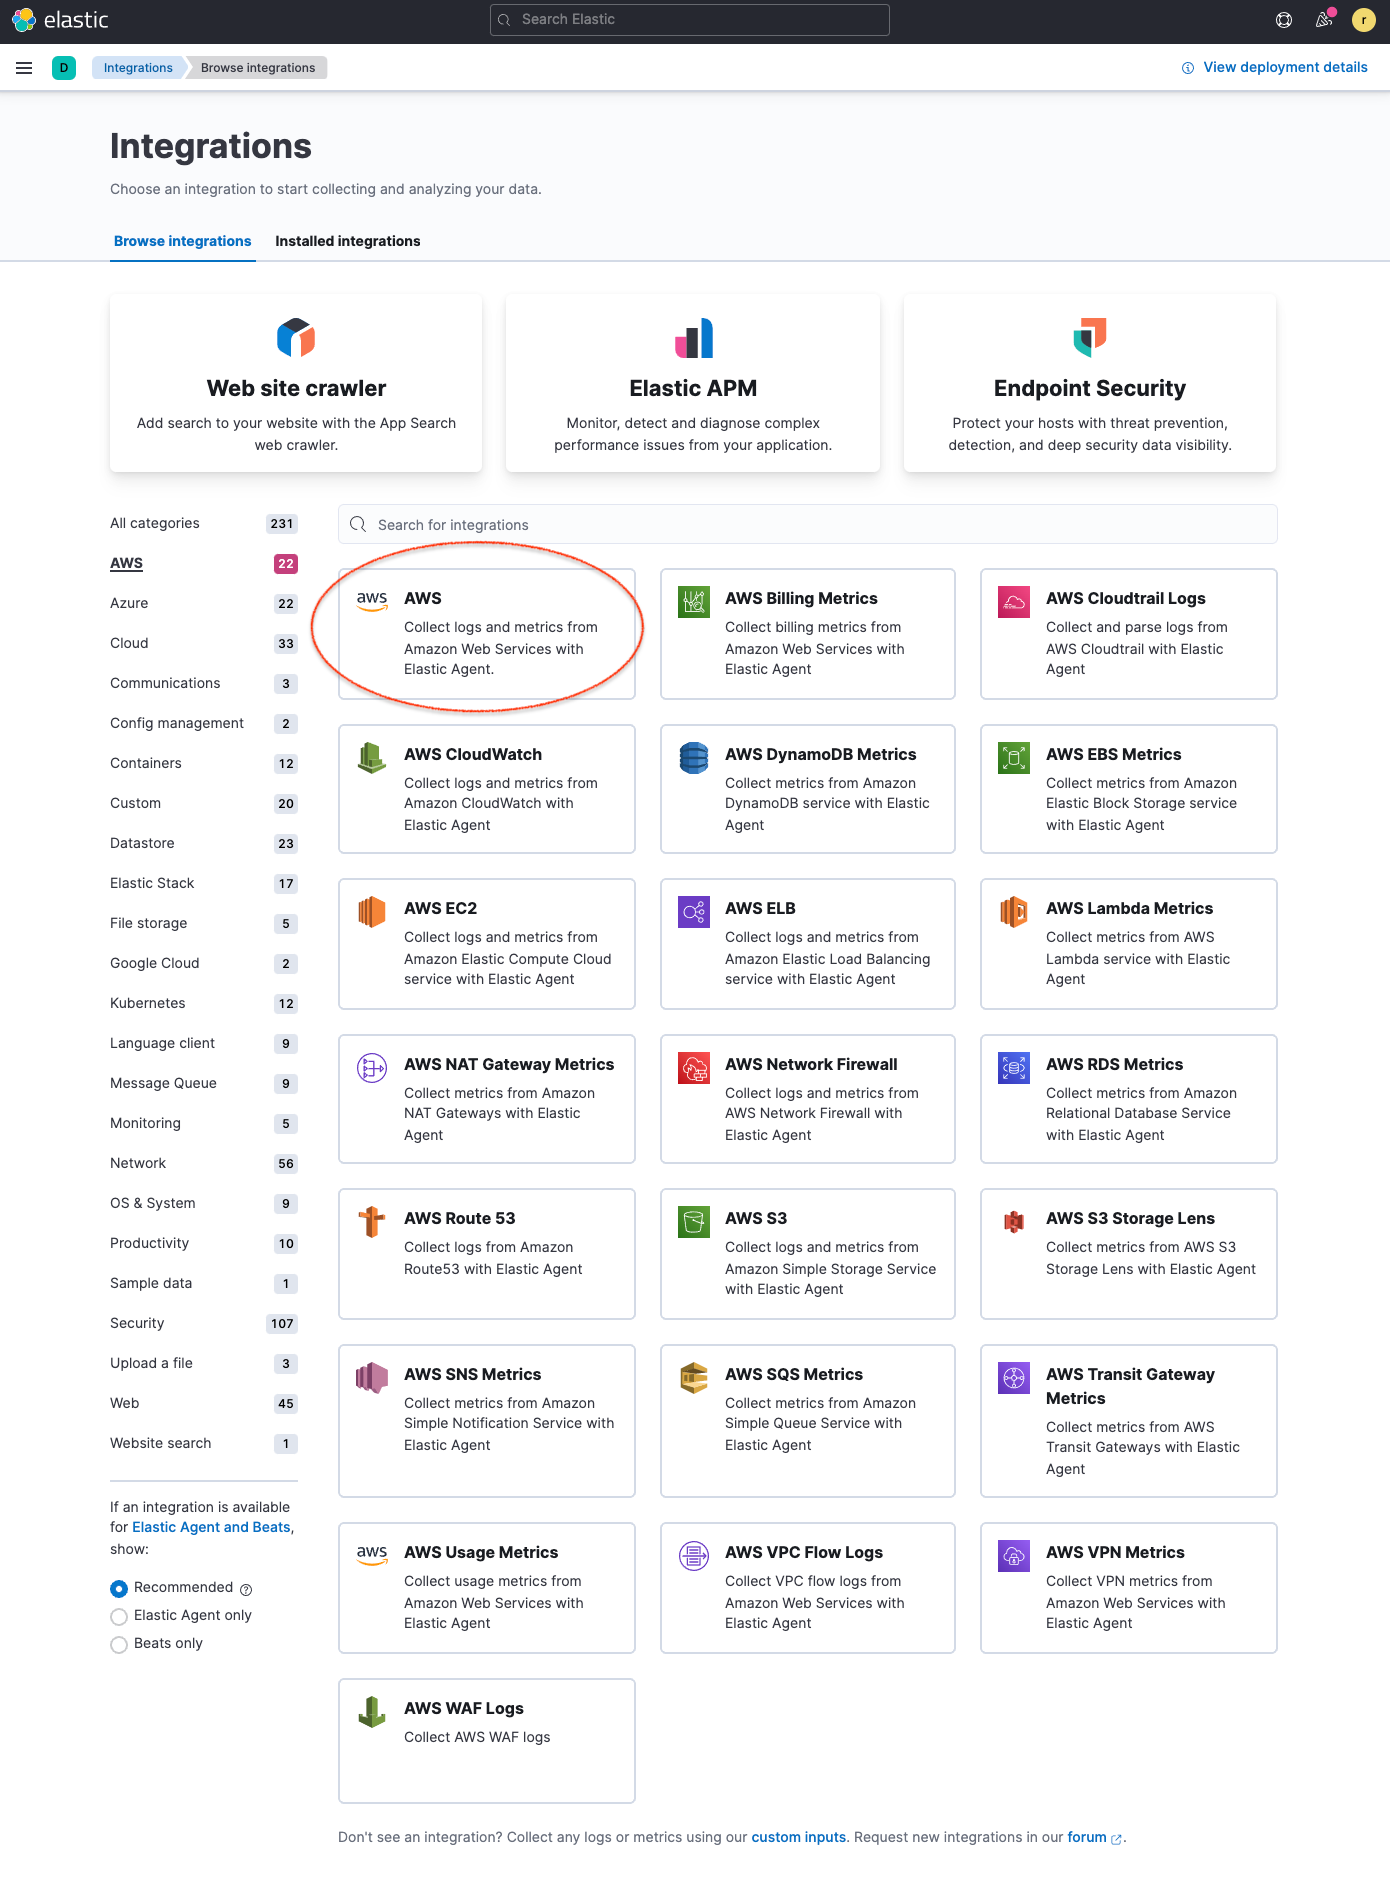
With 23 out-of-the-box integrations for AWS services and more under development, DevOps and security experts can seamlessly ship AWS logs, metrics, and events into Elastic — all you have to do is click to capture, store and search data from your AWS services.
In this blog, we will provide an overview of Elastic and AWS integrations that help you monitor and quickly react to events in your environment.
Go from zero to insights in no time
Observability is all about the data. Efficient ingestion and storage of metrics, logs, and traces is the foundation of Elastic Observability and allows you to monitor and visualize your entire AWS ecosystem from infrastructure to applications, accelerating the adoption of cloud. Lay the foundation of your unified observability solution on AWS and then that same observability data can be applied to your security use cases.
Here’s how we are making it easier for you to get started.
Simplify data ingestion with ready-to-use integrations
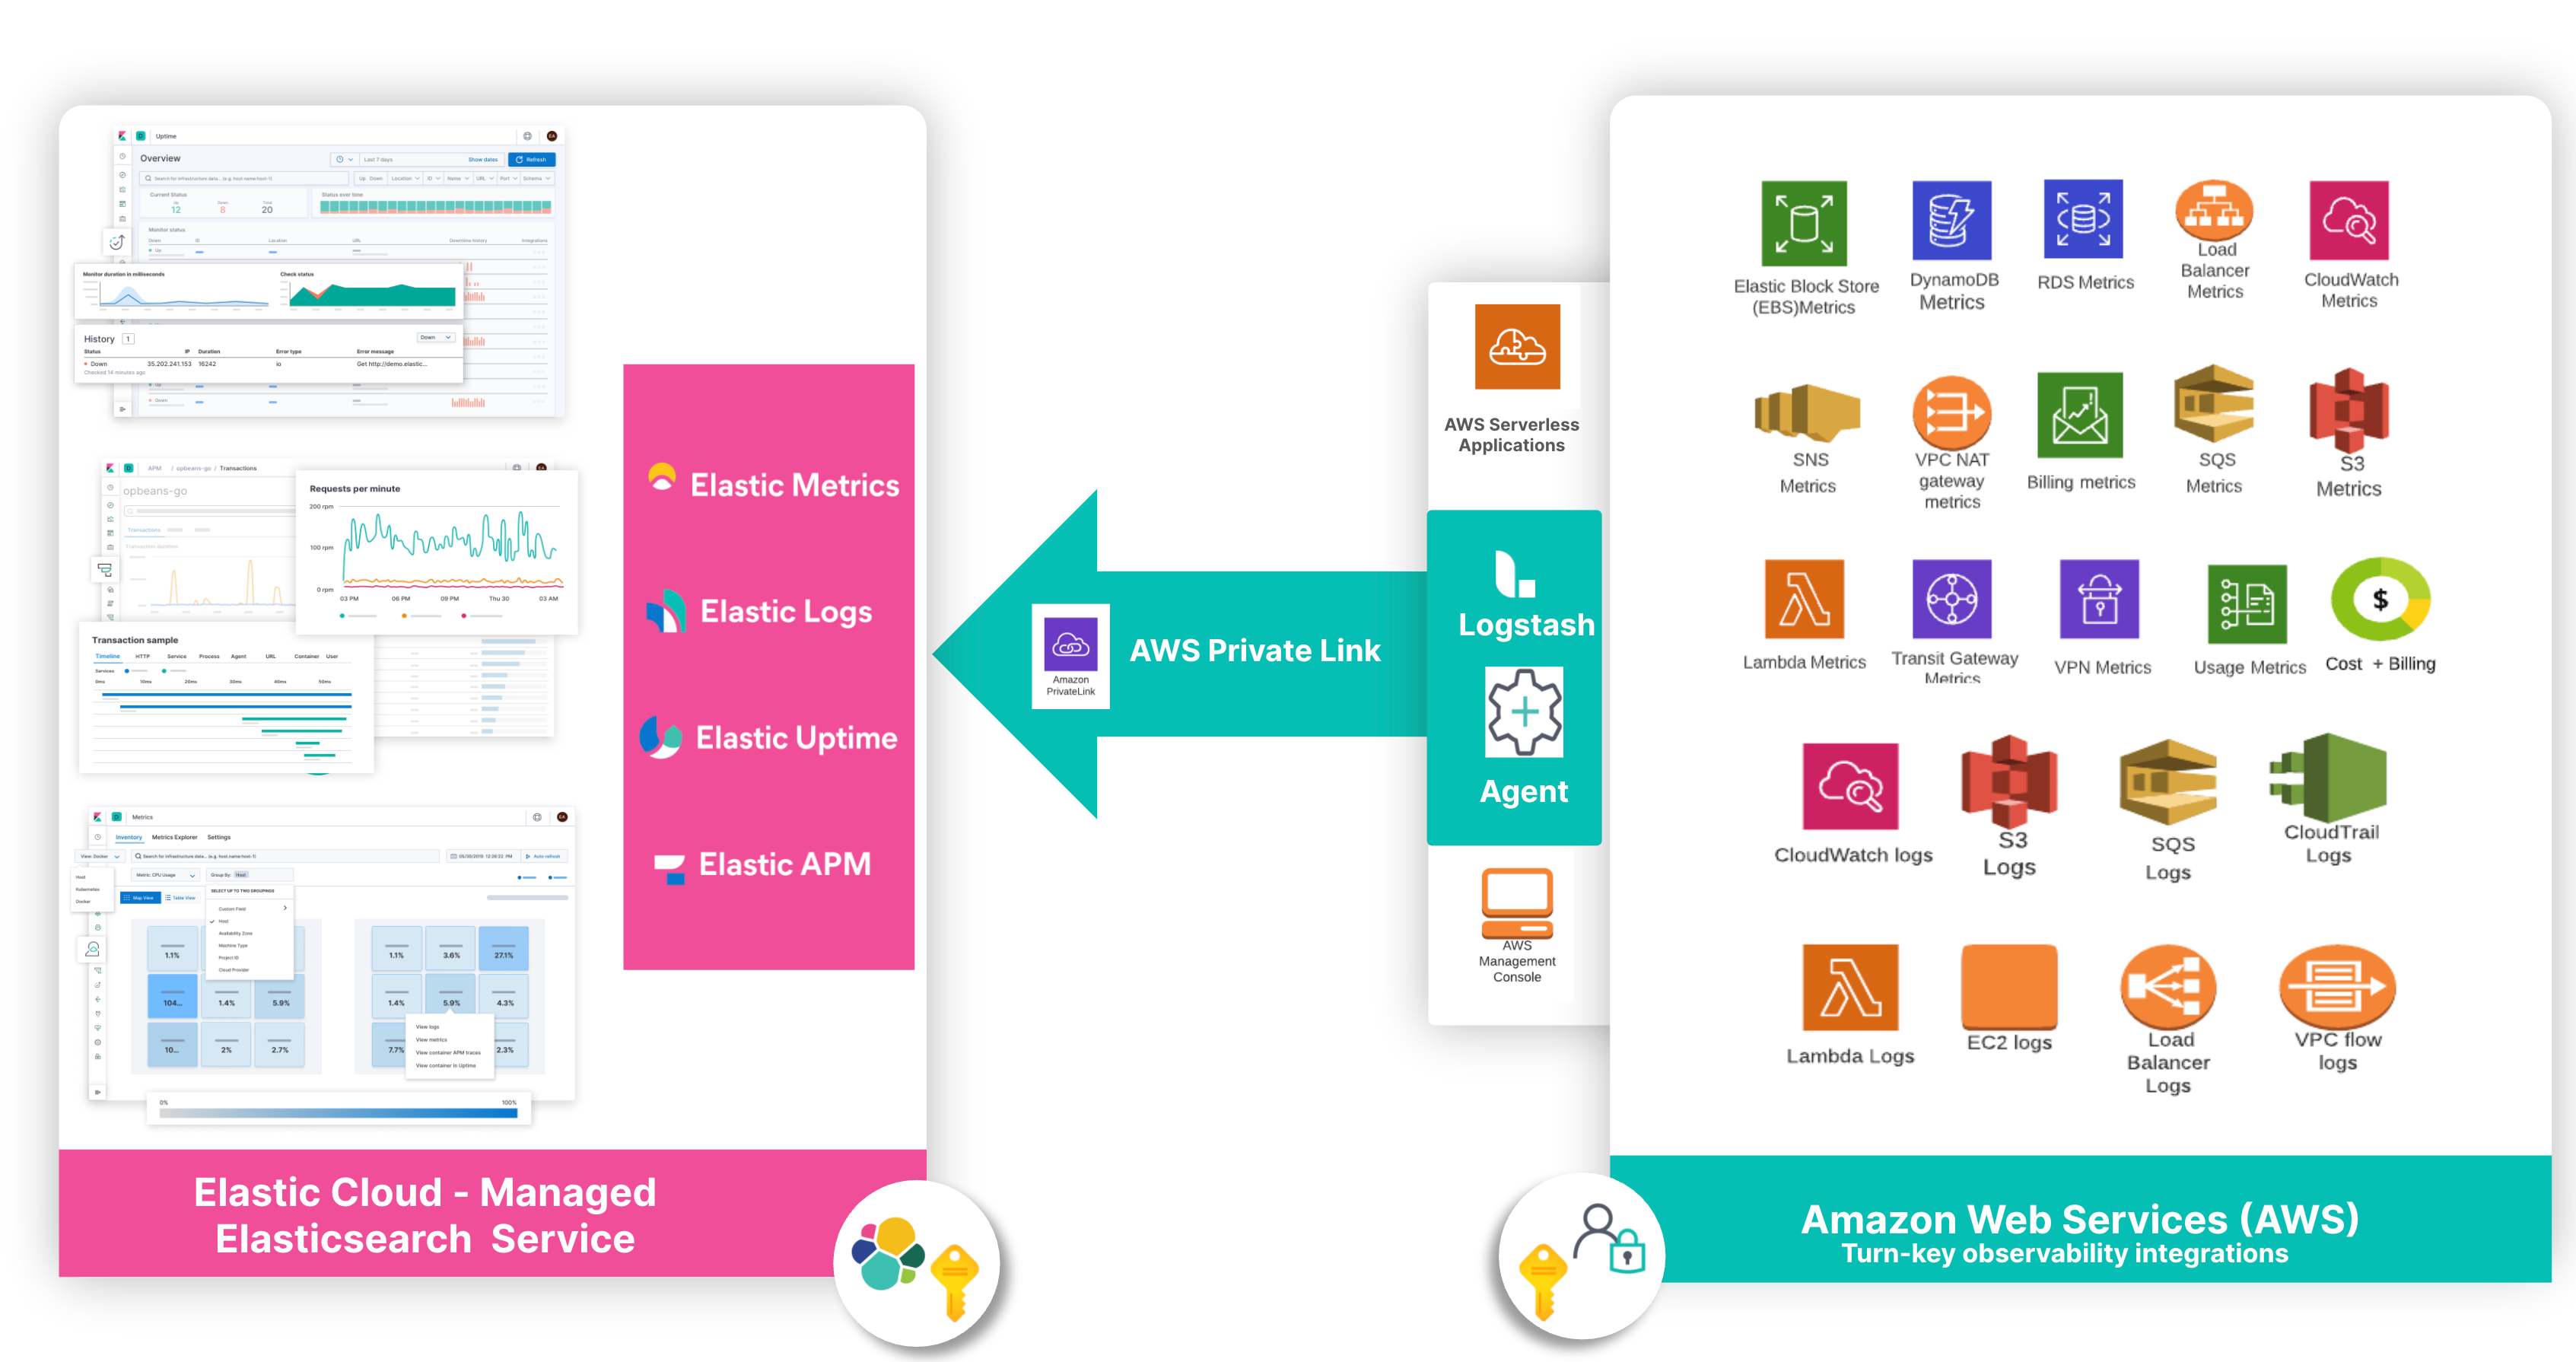
The Elastic and AWS partnership includes product integrations that streamline data ingestion for the most common AWS services. These integrations make it easy for you to analyze your data with prebuilt dashboards and also helps you react quickly to ever-evolving business needs with use case specific workflows and custom visualizations.
Elastic's AWS integrations enable you to unify visibility across your AWS and on-premises environments, providing better insights into the performance, availability and overall health of your infrastructure, applications, and business. Here are some key examples of Elastic and AWS integrations that help you ensure operational efficiencies, accelerate time to value, safeguard your environment and control costs. You can also find a full list of Elastic and AWS integrations here.
Unified observability for cloud-native environments
- Elastic and Amazon CloudWatch — Monitor and analyze Amazon CloudWatch Logs with Elastic and centralize logs from across your infrastructure, applications, and AWS services.
- Elastic and AWS CloudTrail — Visualize your AWS CloudTrail logs as well as account and user activity all within Kibana’s pre-built dashboards for faster analysis as well as track changes and resolve troubleshooting issues to ensure security and compliance.
- Elastic and Amazon Kinesis — Stream logs in real-time and analyze them with Elasticsearch and Kibana so you can derive insights quickly and make more informed decisions — even compress, convert, and encrypt the data in transit to reduce the amount of storage used while increasing security.
- Elastic and Amazon Elastic Compute Cloud (EC2) — View and analyze all of your AWS EC2 compute usage, and configure additional events like scheduled maintenance alerts based on the machine learning algorithms.
Full stack monitoring for applications, containers, and serverless workloads
- Elastic and AWS Serverless Application Repository (SAR) Integration — Ingest logs stored in Amazon Simple Storage Service (Amazon S3) with the new Elastic serverless forwarder, an AWS Lambda application, and view them in the Elastic Stack alongside other logs and metrics for centralized analytics.
- Elastic and AWS FireLens integration — Directly ship container logs and events to Elastic Cloud to streamline AWS log management from shipping and cost-efficient log retention, to monitoring and analyzing threats.
- Elastic and Amazon DynamoDB — Visualize slow queries, error rates, provisioned capacity, consumed capacity and more highly-granular data metrics in real time.
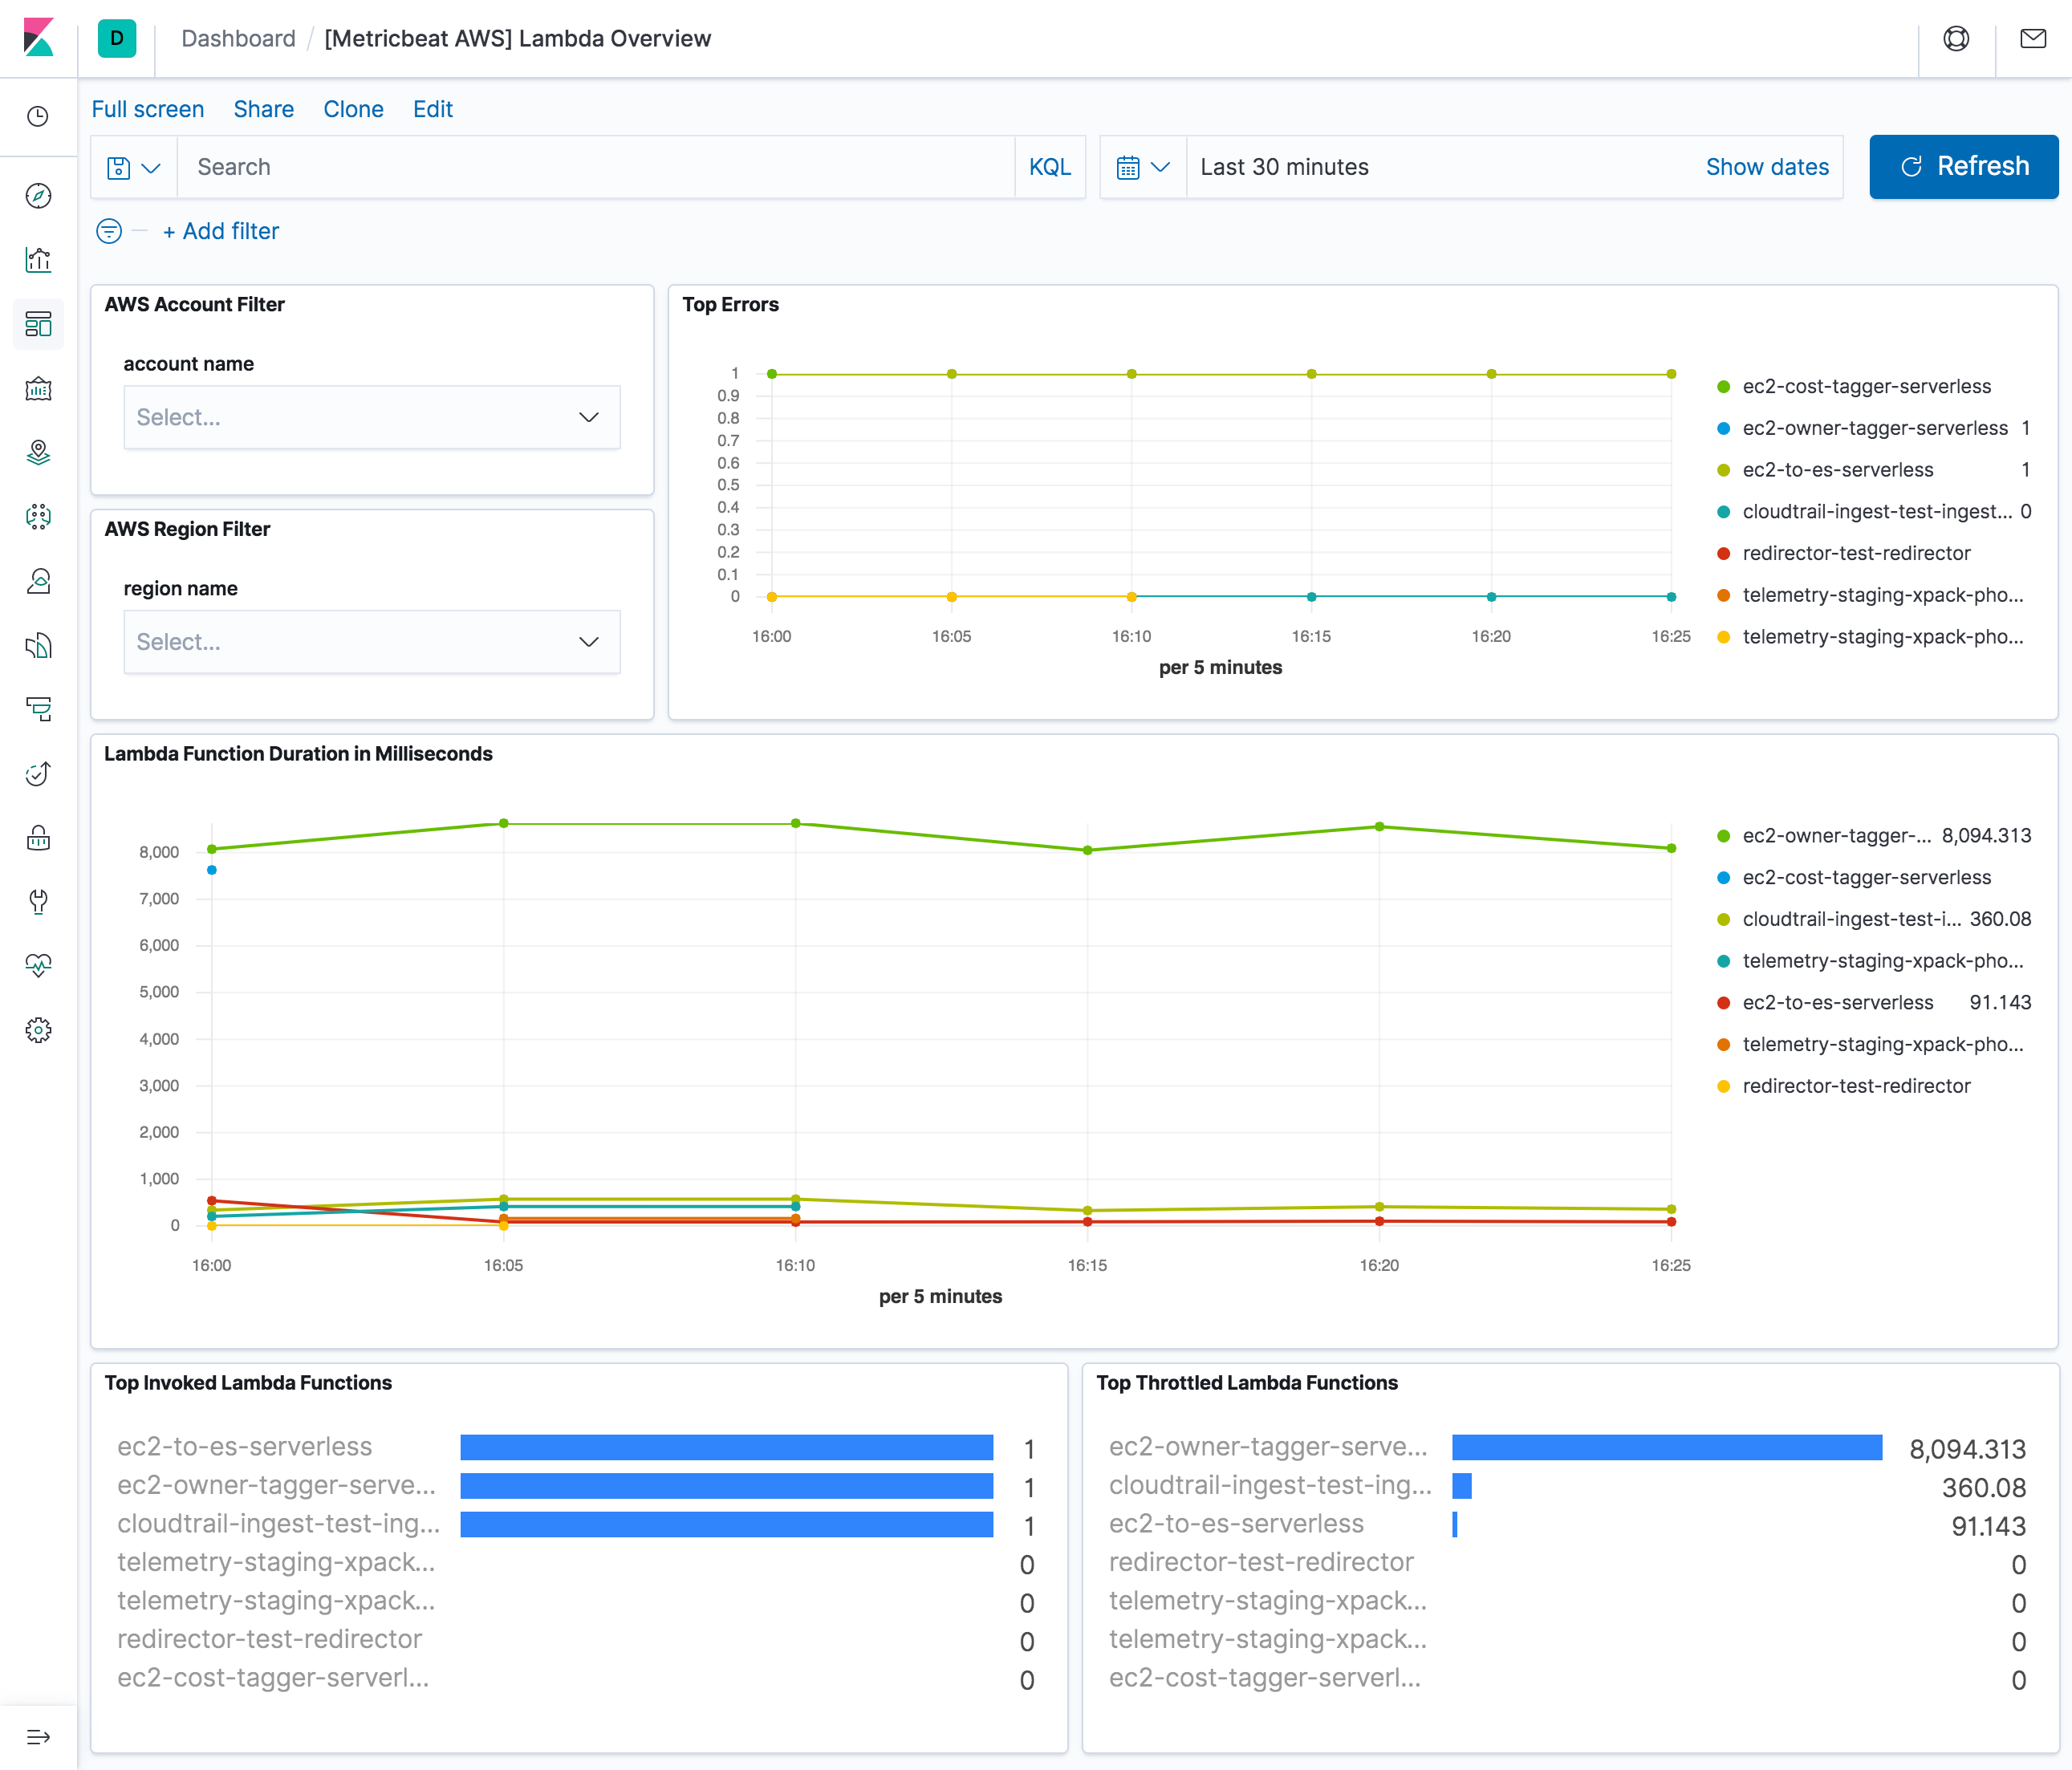
- Elastic and AWS Lambda integration — Monitor performance from different serverless applications, process logs and metrics in real-time and capture and correlate performance data to Elastic solutions.
Out-of-the-box insight into AWS infrastructure
- Elastic and AWS Web Application Firewall (WAF) integration — Process WAF logs in near-real time to identify security threats and specific requests based on parameters like cookies, host header or query string to understand why they are being blocked or allowed.
- Elastic and AWS Network Firewall integration — Maintain the reliability, availability, and performance of your AWS Network Firewall by logging and monitoring how the service is being used as well as network traffic and traffic filtering done by the stateful rule groups in your network firewalls.
- Elastic and Amazon Virtual Private Cloud (Amazon VPC) — Quickly search, view, and filter Amazon VPC Flow Logs to monitor network traffic within your Amazon VPC with Kibana. Analyze the flow log data and compare it with your security group configurations to maintain and improve your cloud security.
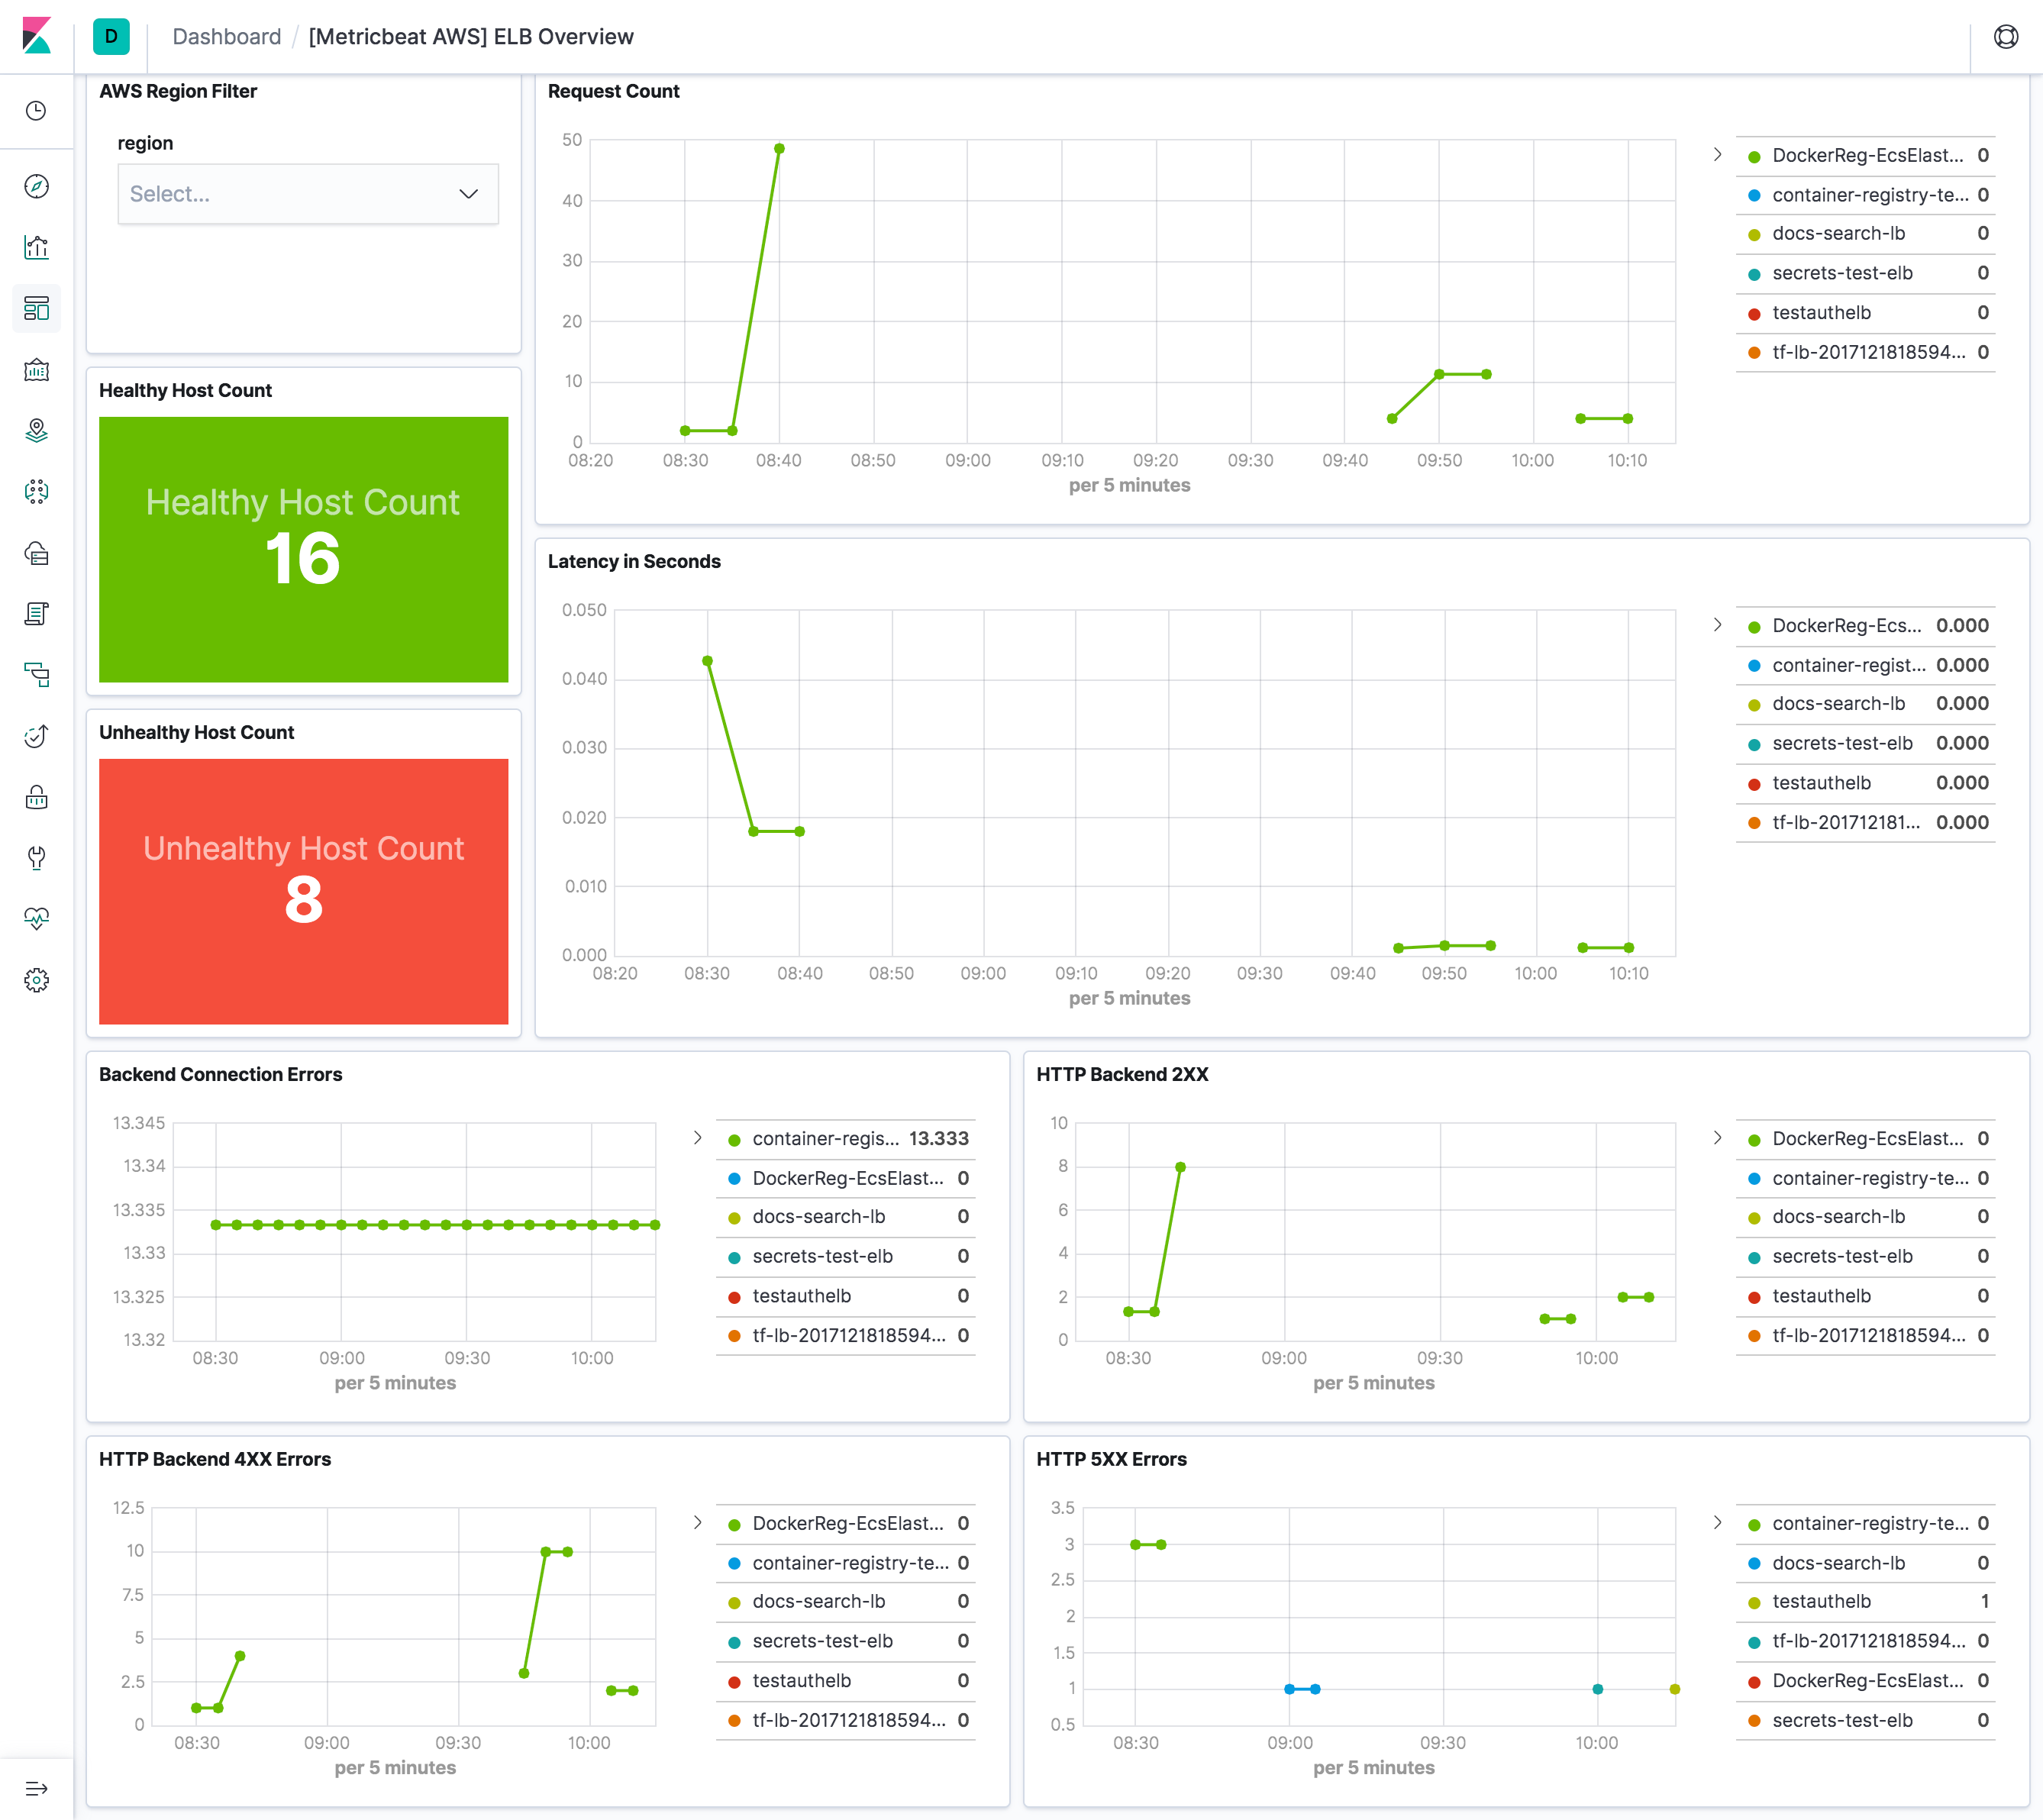
- Elastic with Amazon Elastic Load Balancing (ELB) — Publishes data points for Amazon CloudWatch for your load balancers and back-end instances.
Storage optimization with a holistic approach
- Elastic and Amazon S3 Storage Lens integration — View, aggregate, and analyze S3 Storage Lens metrics alongside security events, application metrics, and system logs across your environment to make informed decisions about storage optimization.
- Elastic and Amazon S3 integration — Establish baselines, analyze access patterns, and identify trends within Kibana’s predefined dashboards. Capture details of requests to get a better understanding of the nature of the traffic against your buckets and identify security and compliance issues.
Transform data into actionable insights
Elastic Observability delivers unified visibility across the entire cloud and on-premises ecosystem so users can monitor and react to events happening anywhere in their environment. Elastic brings logs, metrics, and traces together, at scale in a single stack with machine learning to help detect performance issues and surface root causes — before end users are affected.
- See all your data in one place — Unify metrics, logs, and traces for a full contextual view across your AWS and on-premises environment. Natively ingest telemetry data from applications, infrastructure, and more.
- Get immediate operational visibility — Easily integrate with CloudWatch and CloudTrail for Amazon native telemetry. Drive efficiency with agentless ingestion of aggregated logs through Amazon Serverless Application Model (SAM), and AWS FireLens.
- Monitor cloud-native infrastructure — Track performance across a broad range of services including Amazon EC2, Amazon Elastic Container Service (Amazon ECS), Amazon Elastic Kubernetes Service (EKS), Amazon Lambda, AWS Fargate, Amazon S3, Amazon Relational Database Services (RDS), and Amazon DynamoDB, among others.
- Troubleshoot application errors and performance issues — Get deep application insights with end-to-end distributed tracing. Map application service dependencies spanning multiple cloud or hybrid environments. Connect the dots in your data for faster problem identification and resolution.
- Search at unparalleled speed — Search directly on object storage, such as Amazon S3, without a tradeoff in performance or the need to rehydrate your data from backup. Perform ad-hoc analytics on any number of high-cardinality queries to slice and dice any metric by any dimension.
- Turn data into actions — Get the visibility you need with out-of-the-box dashboards, alerts, and ingest pipelines for extracting structured fields. Send alerts to your notification tool of choice.
- Automatically surface outliers — Detect anomalous behavior with scalable machine learning jobs and automatically correlate transaction performance to determine root causes including those related to custom metadata, application versions, or infrastructure resources.
Stop threats quickly across your environment
With the Elastic Common Schema (ECS) and single repository architecture, the same observability data from AWS and other data sets can also be used for extended detection and response (XDR) to drive mean time to detection towards zero.
Elastic Security brings together SIEM, endpoint security and cloud security allowing organizations to ingest and retain large volumes of data from diverse sources, store and search data for longer, and augment threat hunting with detections and machine learning. Eliminate data silos, reduce alert fatigue, and ready the organization to stop threats quickly, and at cloud scale.
Deploy anywhere, worldwide — get started with a free trial on AWS Marketplace today
Are you ready to transform endless data into endless possibilities with Elastic’s search-powered solutions? Start your own 7-day free trial by signing up via AWS Marketplace and quickly spin up a deployment in minutes on any of the Elastic Cloud regions on AWS around the world. Your AWS Marketplace purchase of Elastic will be included in your monthly consolidated billing statement and will draw against your committed spend with AWS.
The release and timing of any features or functionality described in this post remain at Elastic's sole discretion. Any features or functionality not currently available may not be delivered on time or at all.
Share
- Share on Twitter
Share on Twitter
- Share on LinkedIn
Share on LinkedIn
- Share on Facebook
Share on Facebook
- Share by Email
Share by Email
- Print this page
Print