Elastic Observability 7.15: Automated correlations, frictionless log ingestion from Google Cloud
Elastic Observability 7.15 introduces the general availability of automated correlations, unified views across application service logs and dependencies, and agentless log ingestion from Google Cloud Platform (GCP), accelerating troubleshooting of root causes of application issues and making it even easier to ingest telemetry from cloud services.
These new features allow customers to:
- Automatically surface attributes of the APM data set that are correlated with high-latency or erroneous transactions
- Effortlessly troubleshoot application issues by viewing all associated application or service logs from within the APM user interface
- Seamlessly ingest log data into Elastic from within the Google Cloud console and extend monitoring to native Google Cloud services
Elastic Observability 7.15 is available now on Elastic Cloud — the only hosted Elasticsearch offering to include all of the new features in this latest release. You can also download the Elastic Stack and our cloud orchestration products, Elastic Cloud Enterprise and Elastic Cloud for Kubernetes, for a self-managed experience.
Automated root cause analysis with APM correlations is now GA
DevOps and SRE teams are constantly challenged with an overwhelming amount of data and dependencies to sift through to keep modern applications performant and error-free. As such, automation and machine learning have become essential components of the troubleshooter’s toolkit. Elastic APM correlations accelerate root cause analysis by automatically surfacing attributes of the APM data set (such as infrastructure components, versions, locations, and custom metadata) that are correlated with high-latency or erroneous transactions and have the most significant impact on overall service performance. Visualize the latency distribution of any attribute compared to overall latency and use these attributes to filter and isolate the root causes of performance problems.
Unified observability for APM troubleshooting across logs, third-party dependencies, and backend services
Elastic is the only observability solution built on a search platform that natively ingests high dimensionality and cardinality telemetry data of any type or source, adds context, and correlates it for fast, relevant analysis. Over the last twelve months we have reworked almost the entire user experience within the APM user interface and will continue to deliver visualization and workflow improvements for unified visibility and analysis across the entire application ecosystem.
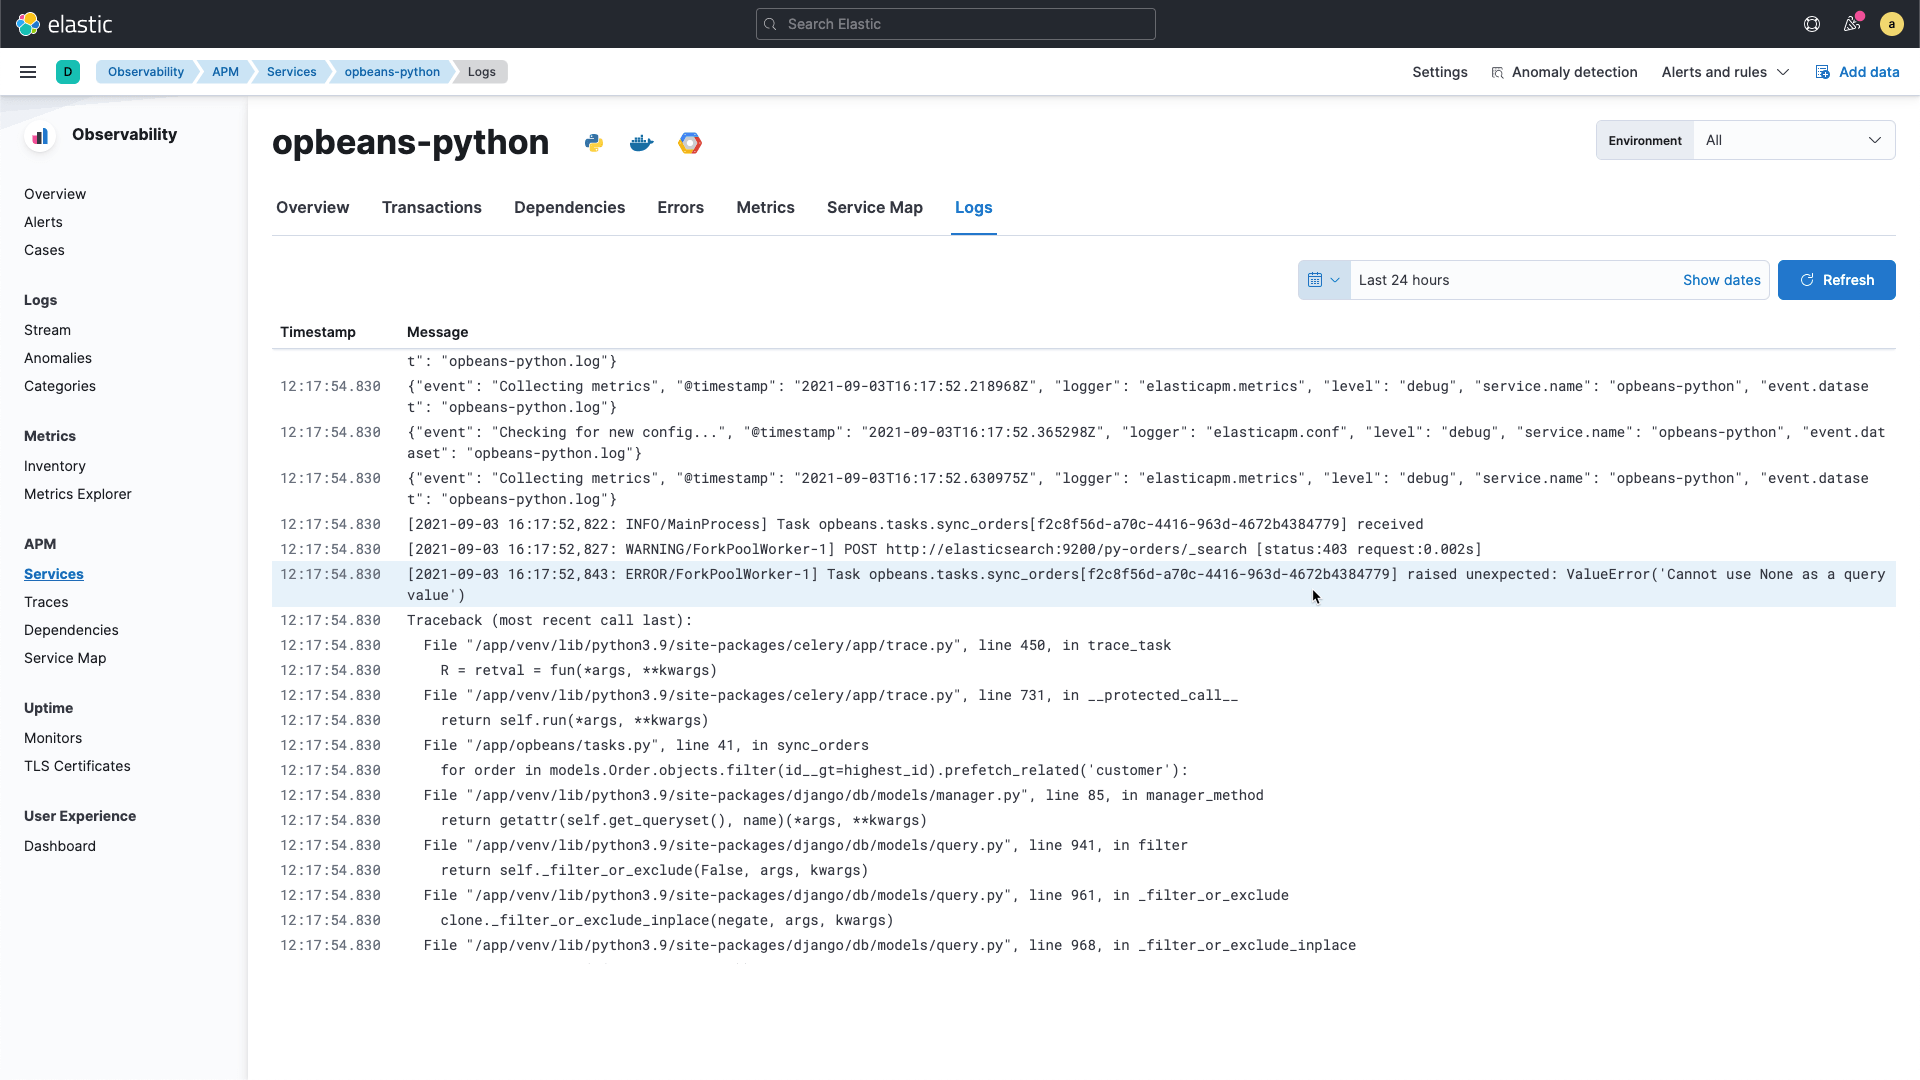
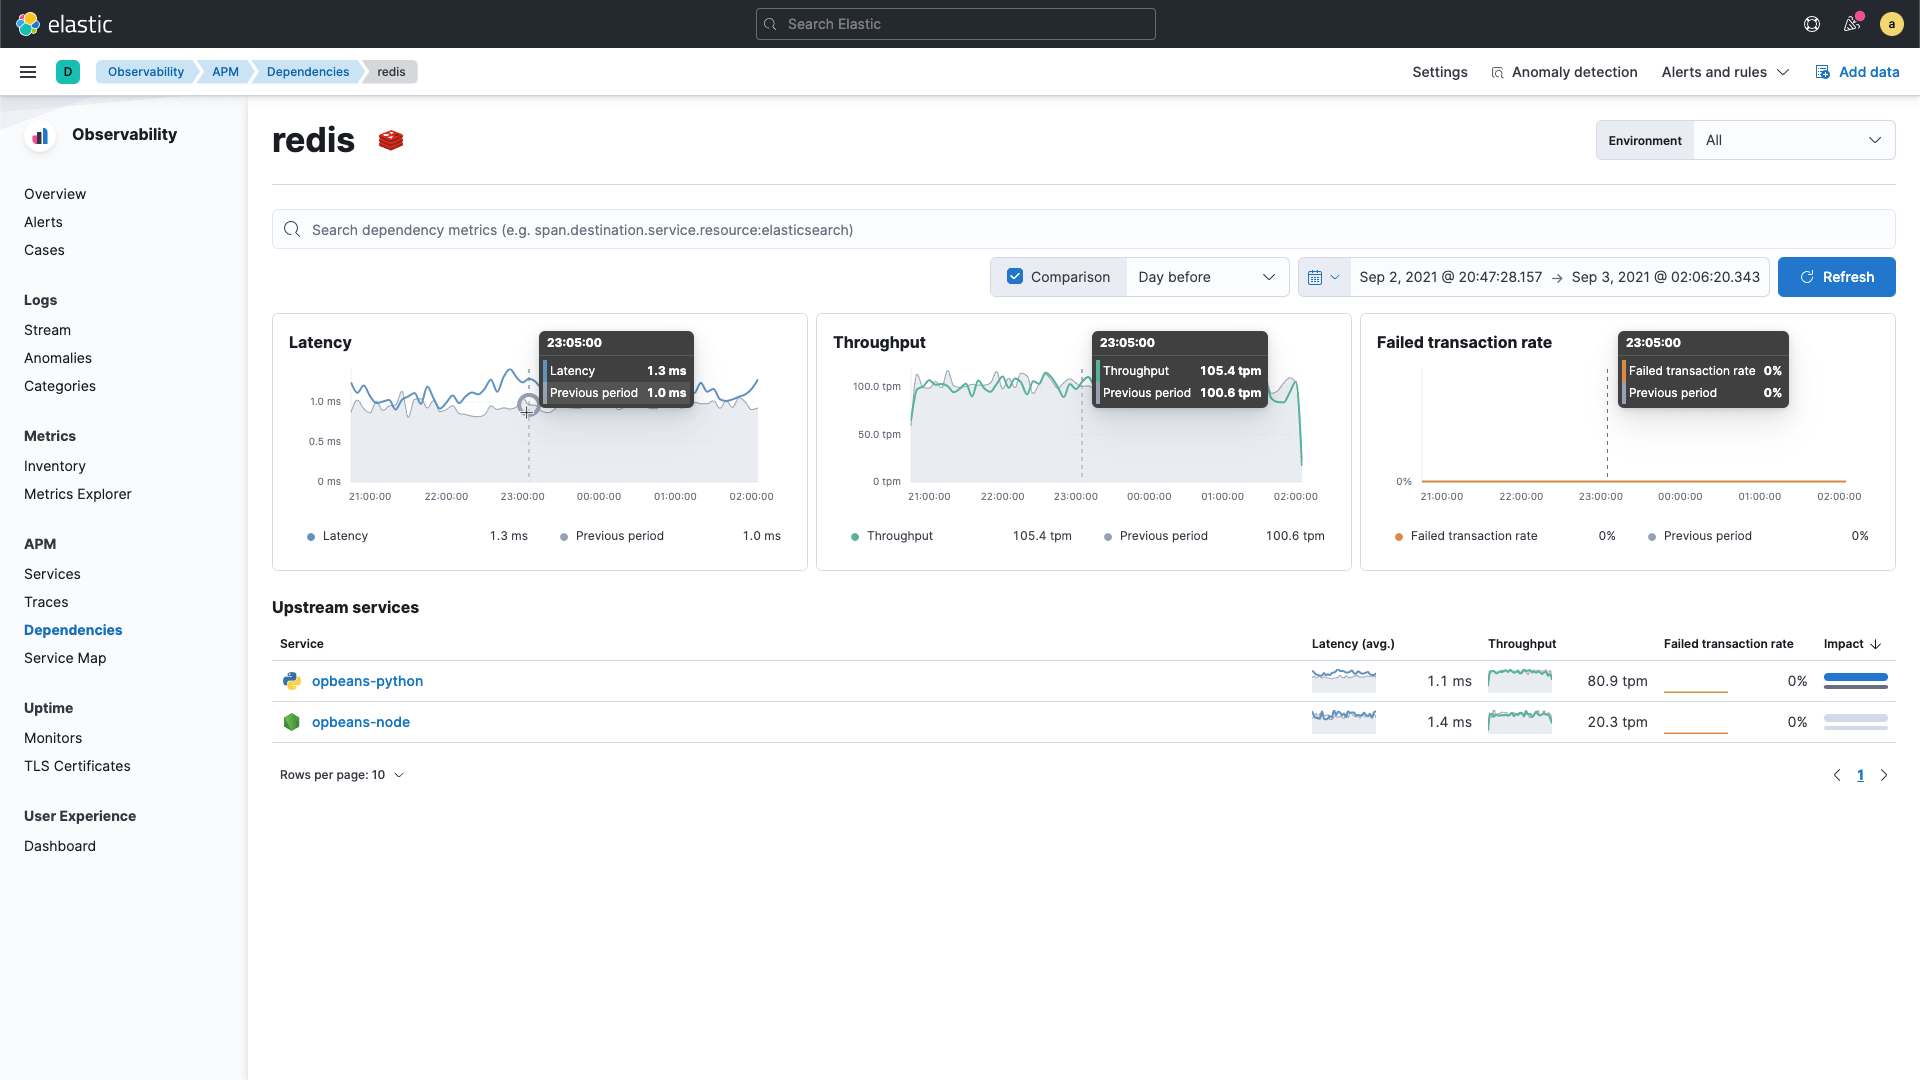
Two new troubleshooting views have been added in 7.15. Logs are now available on any level, at the top level for the service, as well as at the level of specific transactions and container or pod instances. We're now also able to show external dependencies, such as backends, caches, and databases, including how they are performing, their upstream dependencies, and how they have changed over time.
We’ve also enhanced the existing transaction latency distribution chart and trace selection with more granular buckets and the flexibility to drag-select all application traces that fall within a desired range of latencies.
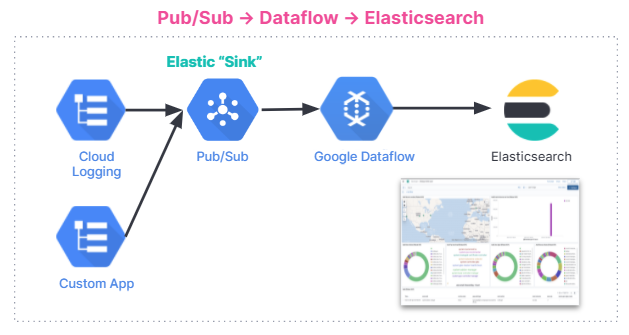
Agentless ingestion of logs from Google Cloud Platform (GCP) for frictionless observability
Elastic’s new GCP Dataflow integration drives efficiency with frictionless ingestion of log data directly from the Google Cloud console. The agentless approach provides an “easy button” option for customers who want to avoid the cost and hassle of managing and maintaining agents, and further extends monitoring to native GCP services.
Additional data sources: JVM metrics support for JRuby, Azure Spring Cloud logs integration, and Osquery metrics in host details panel
With the 7.15 release, we have also enhanced our application and cloud data collection for JRuby and Azure. Now you can get visibility into system and JVM metrics for JRuby applications and continuously monitor and quickly debug issues encountered in Spring boot applications running on Azure (beta).
Osquery provides a flexible and powerful way to collect any data from a target host it's installed on. The Osquery integration with the Elastic Agent, introduced in 7.13, opened up a spectrum of capabilities to support troubleshooting of security and observability use cases. Previously, Osquery could be used via Kibana to perform live and scheduled queries, with the query results stored in a dedicated data stream. With 7.15, Osquery is now directly integrated into the enhanced host details panel and delivers ad hoc querying capabilities on the target host.
Self-managed version of Elastic Package Registry (EPR) now available for air-gapped deployments
If you host your Elastic Stack in an air-gapped environment and want to take advantage of the recently GA Elastic Agent and Fleet, we have good news for you. Elastic Package Registry (EPR) is now available as a Docker image that can be run and hosted in any infrastructure setting of your choice. In environments where network traffic restrictions are mandatory deploying your own instance of EPR enables Kibana to download package metadata and content in order to access all available integrations and deliver the relevant out-of-box components and documentation. Currently, the EPR Docker image is a beta standalone server that will continue to grow and evolve. For more information, check out the Elastic guide for running EPR in air-gapped environments.
Try it out
Existing Elastic Cloud customers can access many of these features directly from the Elastic Cloud console, or, if you'd prefer, you can download the latest version.
If you’re new to Elastic Cloud, take a look at our Quick Start guides (bite-sized training videos to get you started quickly) or our free fundamentals training courses. You can always get started for free with a free 14-day trial of Elastic Cloud.
Read about these capabilities and more in the Elastic Observability 7.15 release notes, and other Elastic Stack highlights in the Elastic 7.15 announcement post.
The release and timing of any features or functionality described in this post remain at Elastic's sole discretion. Any features or functionality not currently available may not be delivered on time or at all.