What’s new in 7.15
editWhat’s new in 7.15
editHere are the highlights of what’s new and improved in 7.15.
Other versions: 7.14 | 7.13 | 7.12 | 7.11 | 7.10 | 7.9 | 7.8 | 7.7 | 7.6 | 7.5 | 7.4
Give 7.15 a try
editTry 7.15 now by deploying Elasticsearch and Kibana on Elastic Cloud or by downloading them.
Agentless ingestion of logs from Google Cloud Platform (GCP)
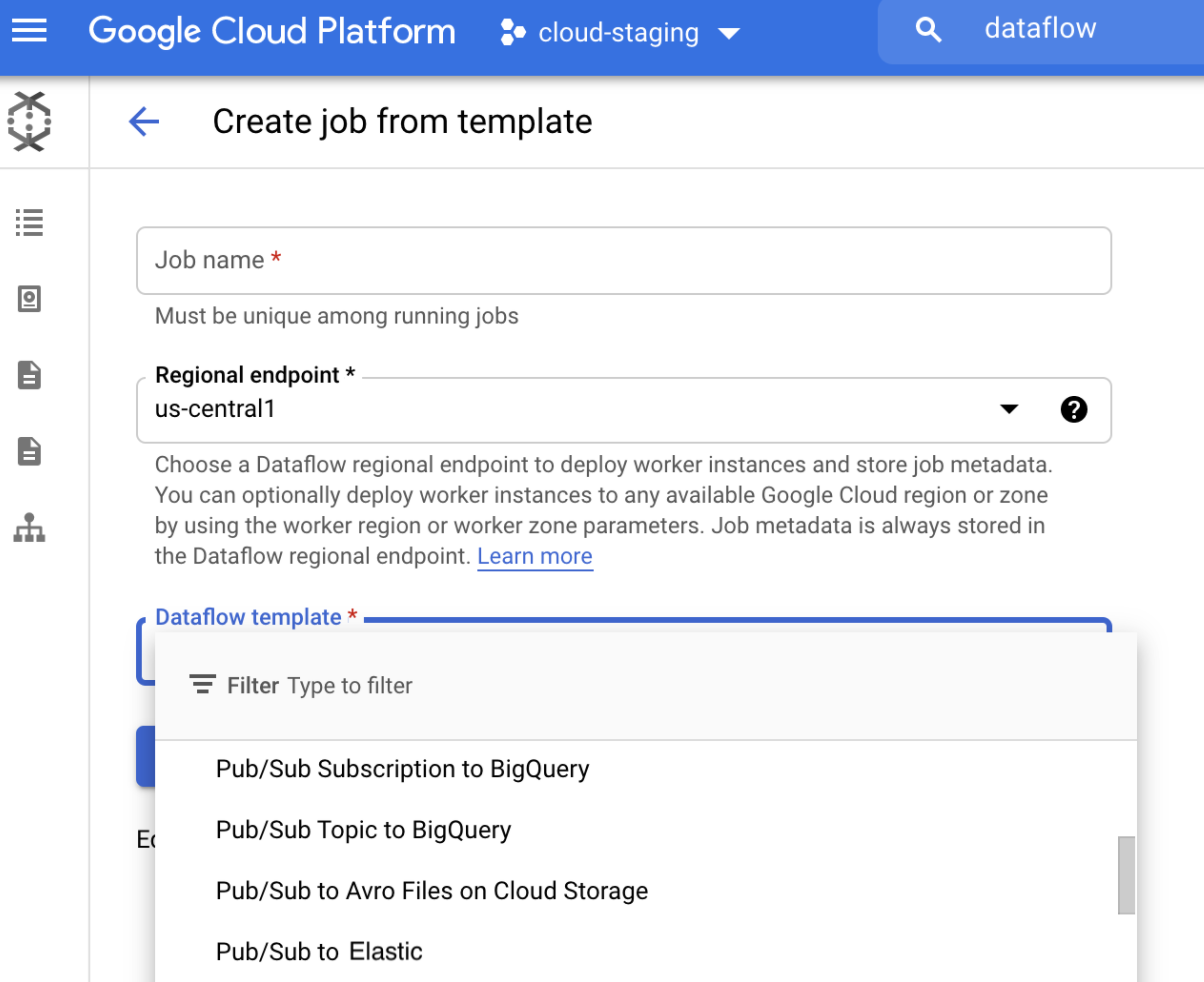
editOur new GCP Dataflow integration in 7.15 drives efficiency with frictionless ingestion of log data directly from the GCP console. The Pub/Sub to Elastic template provides an easy agentless way to eliminate the cost and hassle of managing and maintaining Elastic Agents, and extends monitoring to native GCP services.
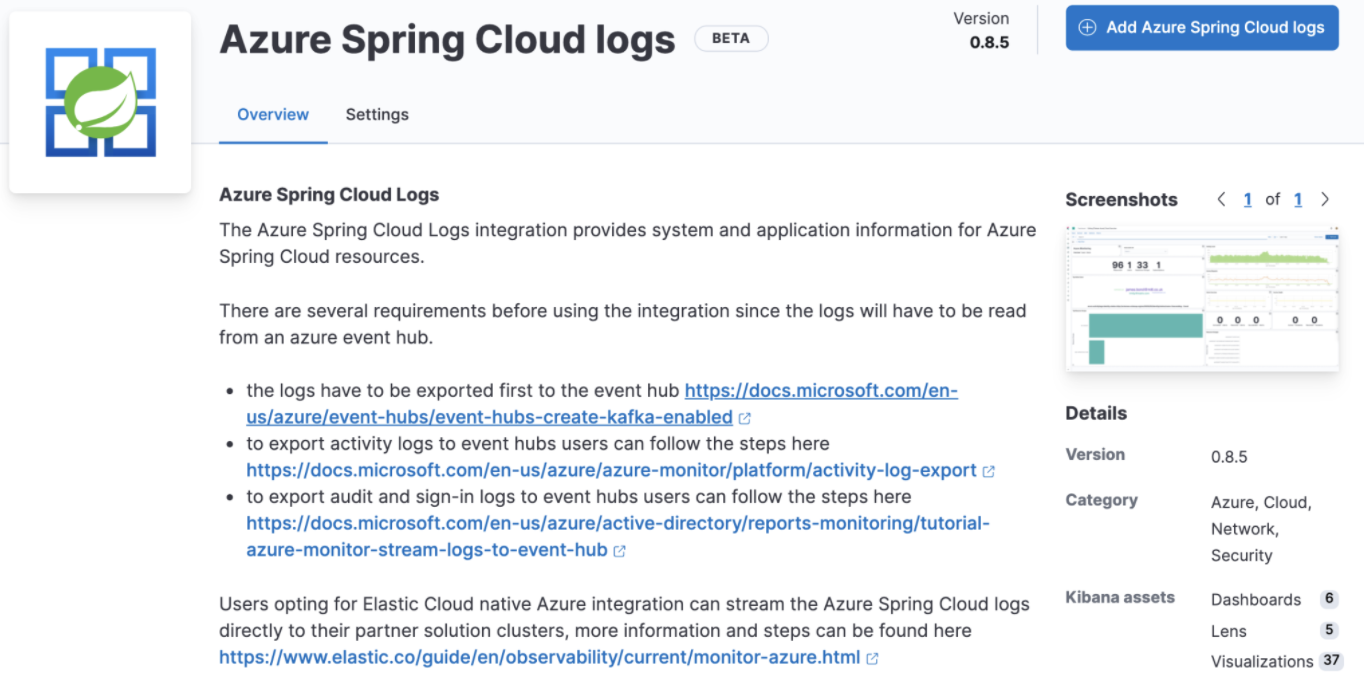
Azure Spring Cloud logs integration (Beta)
editGet started in minutes with our new turnkey Elastic Agent integration, and continuously monitor and debug issues encountered in Spring Boot applications running on Azure.
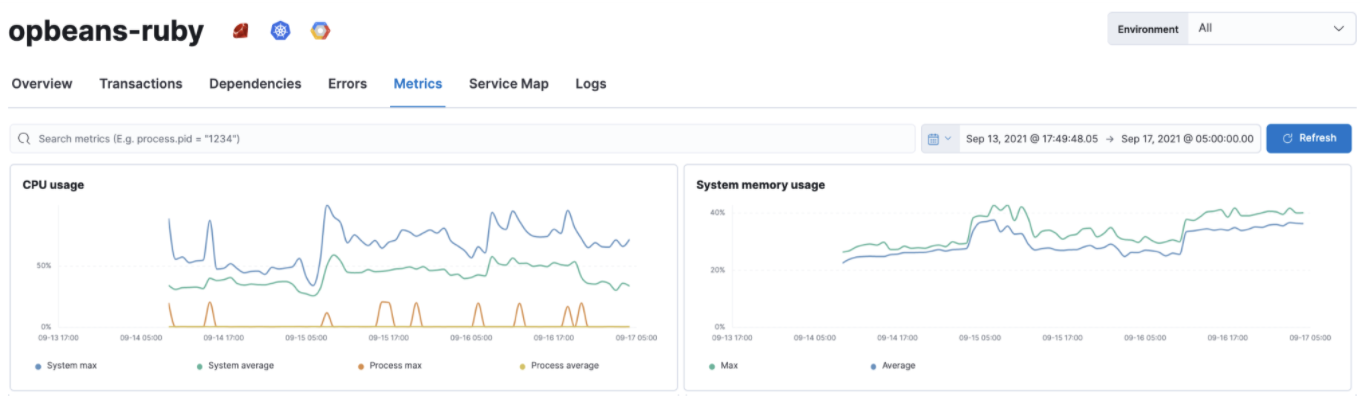
JVM metrics support for JRuby
editTroubleshoot JRuby based applications faster in 7.15 with resource metrics automatically collected and integrated into APM workflows.
Self-managed Elastic Package Registry (Experimental)
editElastic Stack needs to understand the external data sources and available data formats to integrate, collect, and visualize data using Elastic Agents. Today, Kibana receives this information as packages from the Elastic Package Registry (EPR) endpoint.
If you host your Elastic Stack in an air-gapped environment and want to take advantage of Fleet and Elastic Agent, we have good news for you. EPR is now available as a Docker image that you can run and host in any infrastructure setting of your choice. It will enable Kibana to understand all available integrations and provide you with the out-of-box assets and documentation for all the desired Integrations.
This EPR Docker image is an experimental standalone server that will grow and evolve further in the future.
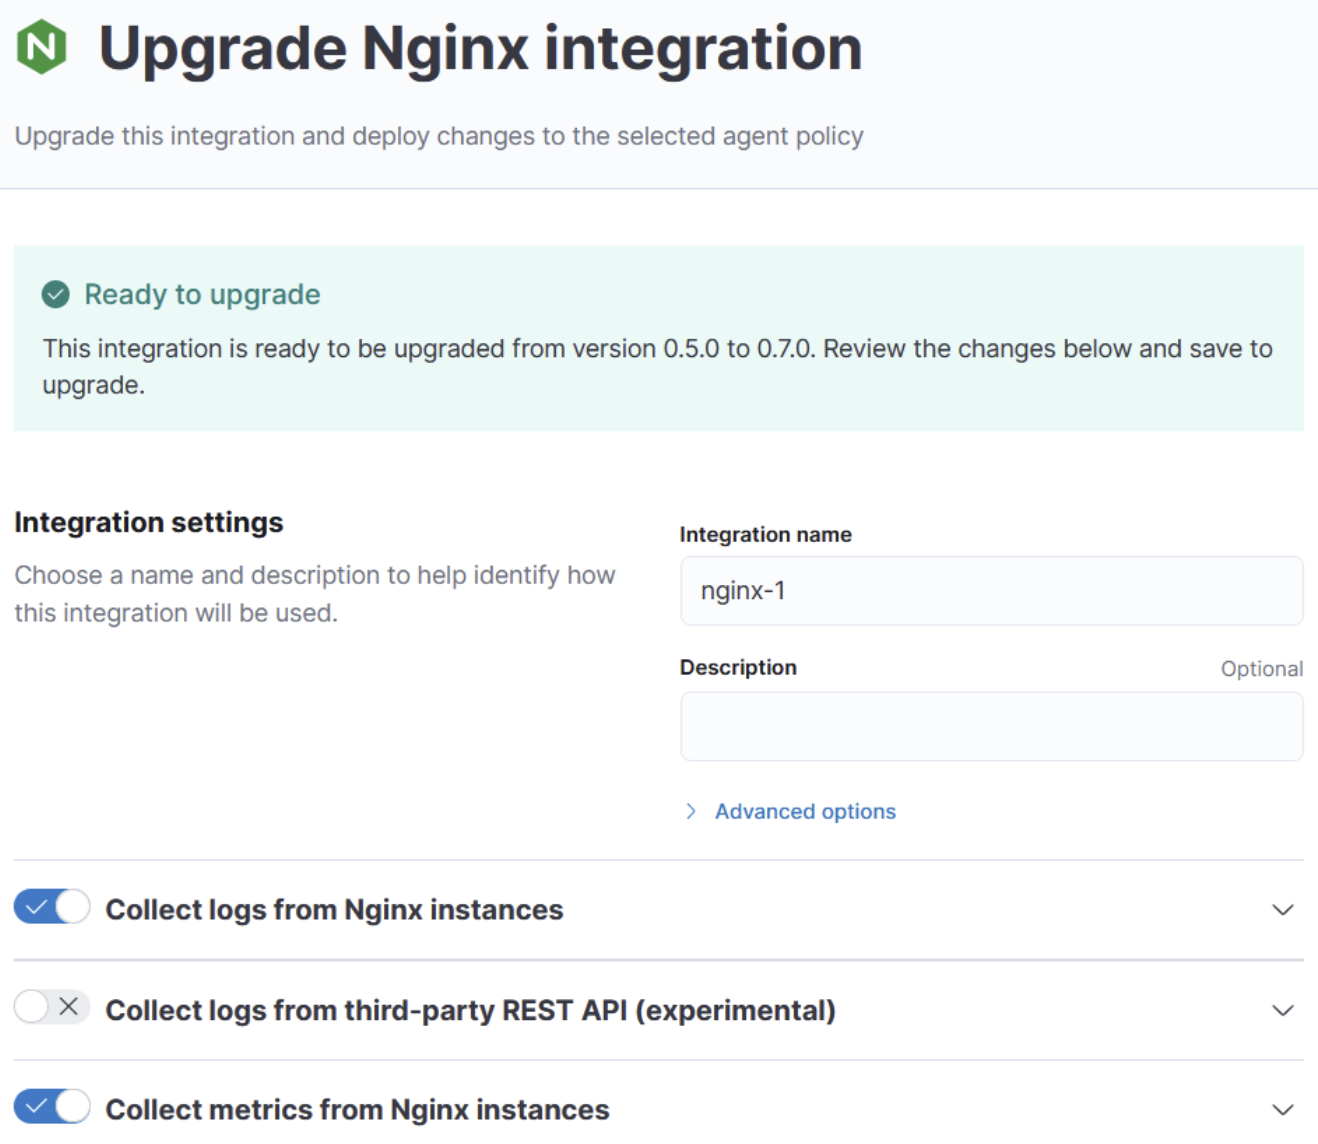
Upgrade integration policies
editIn previous versions of Integrations and Fleet, when you upgraded an integration to a newer version you could not easily upgrade its integration policy. Instead, you had to delete the old integration policy and add a new one.
In 7.15 we’ve added the ability to upgrade the version of an integration used by an integration policy. You can do this from the Policies page for the integration. If it’s eligible for an upgrade, you’ll see a blue Upgrade button that you can click to trigger the upgrade.
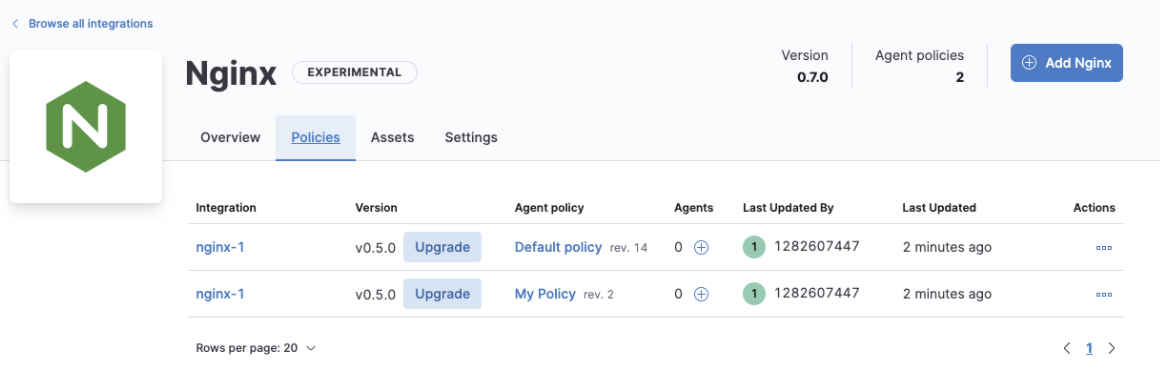
We’ll attempt to automatically upgrade the integration policy and will show a green success message if all goes well. Most Integrations should automatically upgrade. However, if there is a conflict, we’ll show a yellow notification and you must manually create a new integration policy for the latest version.
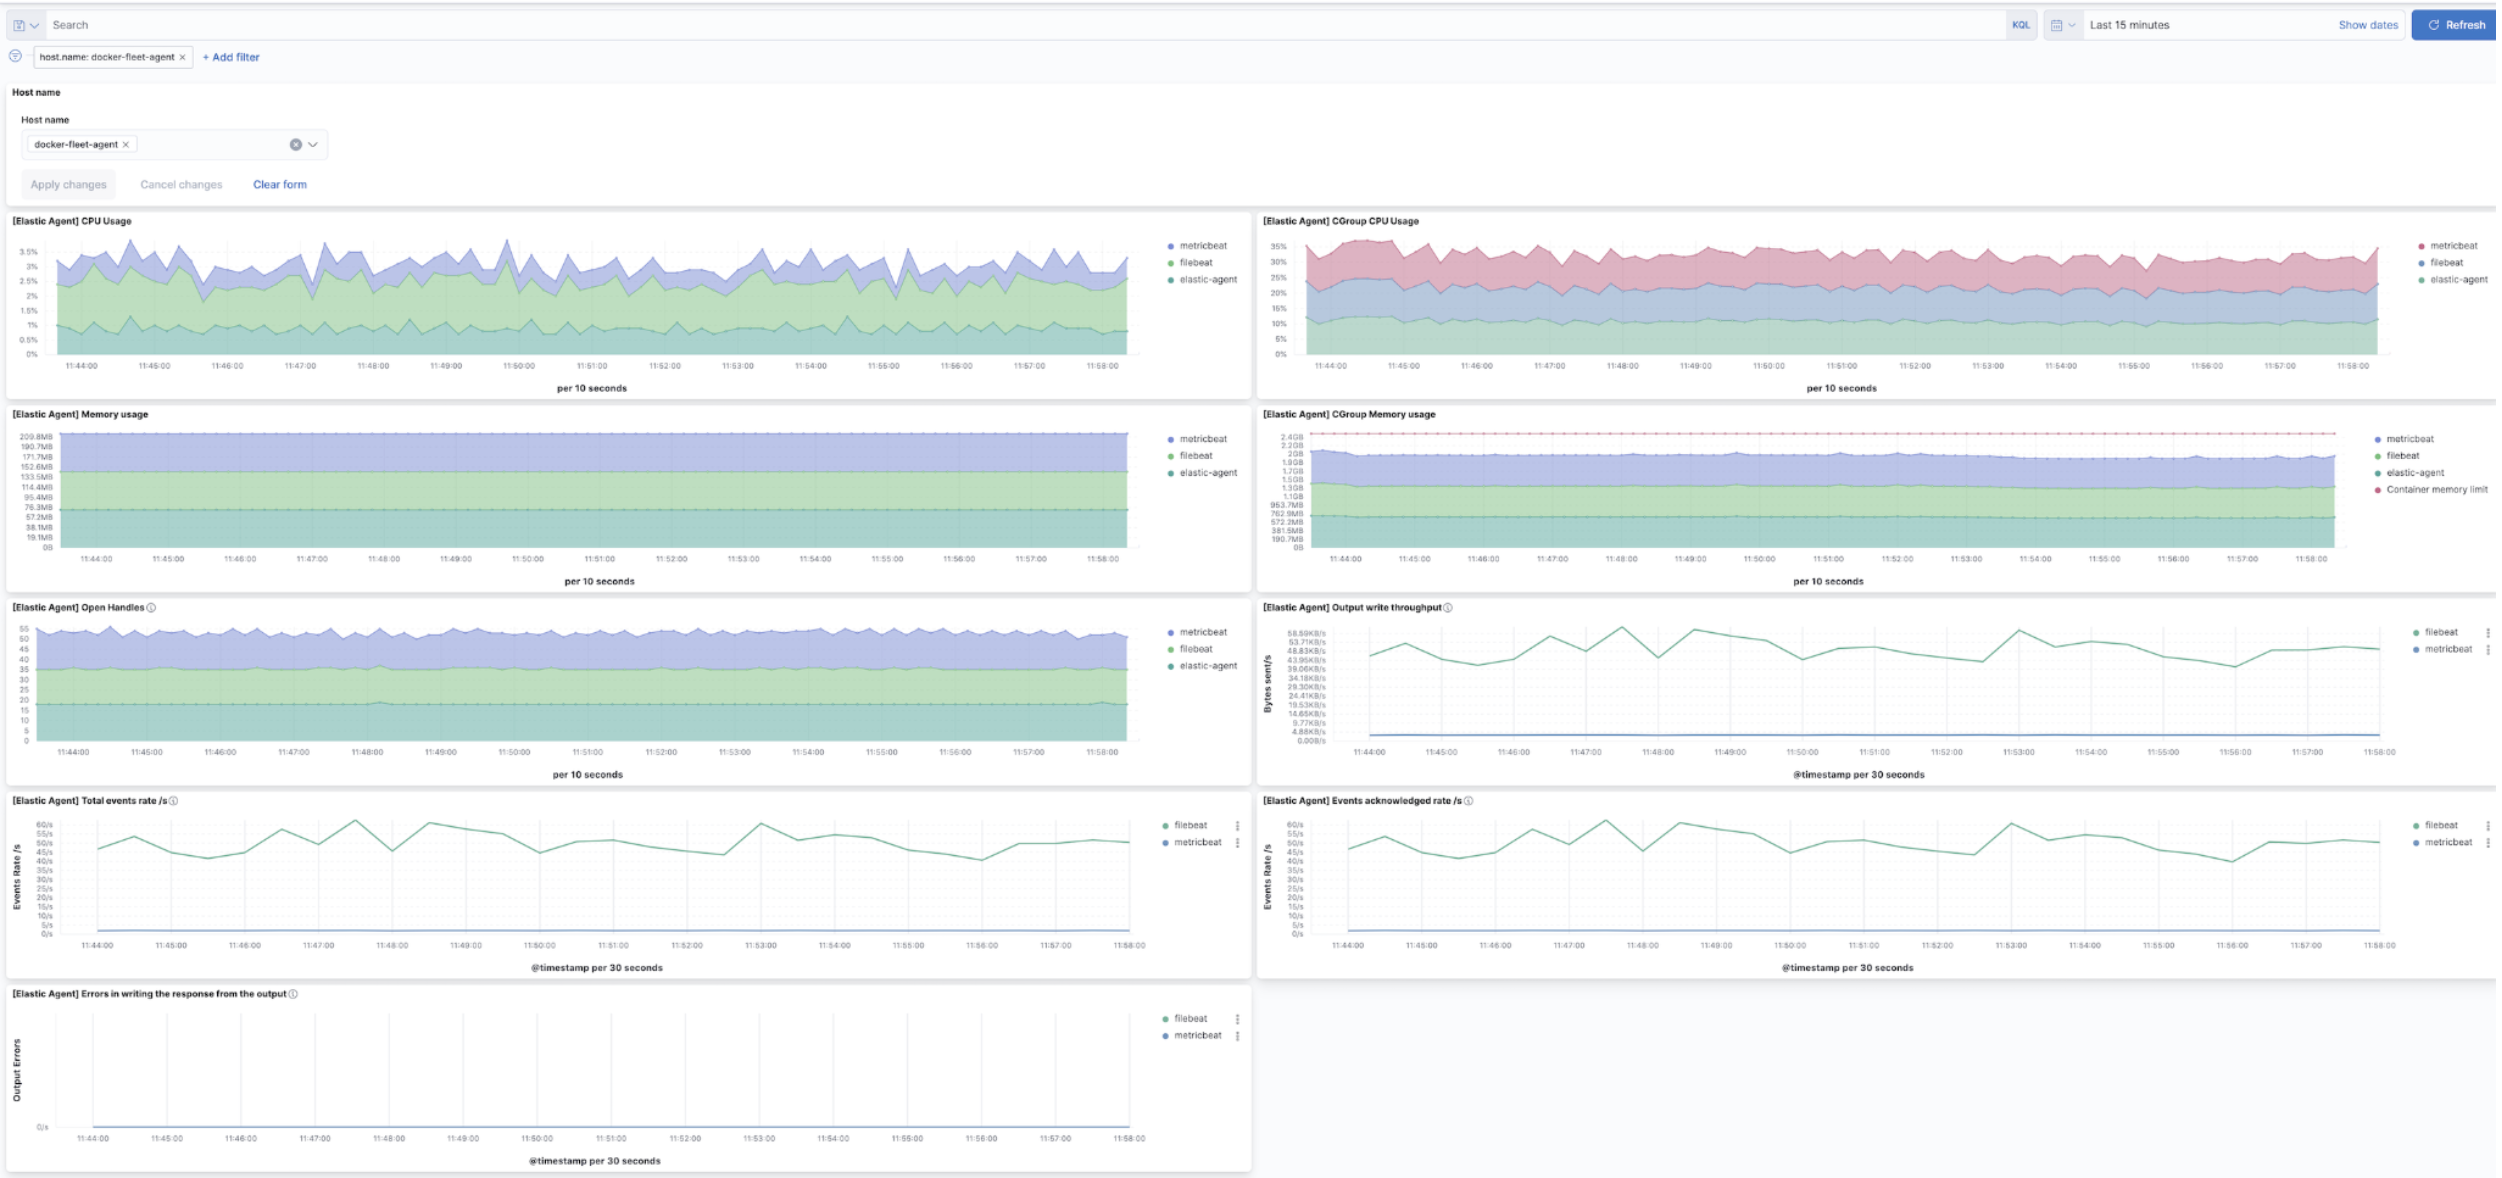
Improved Elastic Agent monitoring
editWe now provide a new and improved dashboard in 7.15 for monitoring Elastic Agents. We have added visualizations for containers with cgroup metrics, including CPU and memory usage. We have also added visualizations for things like event rate, throughput, and errors.
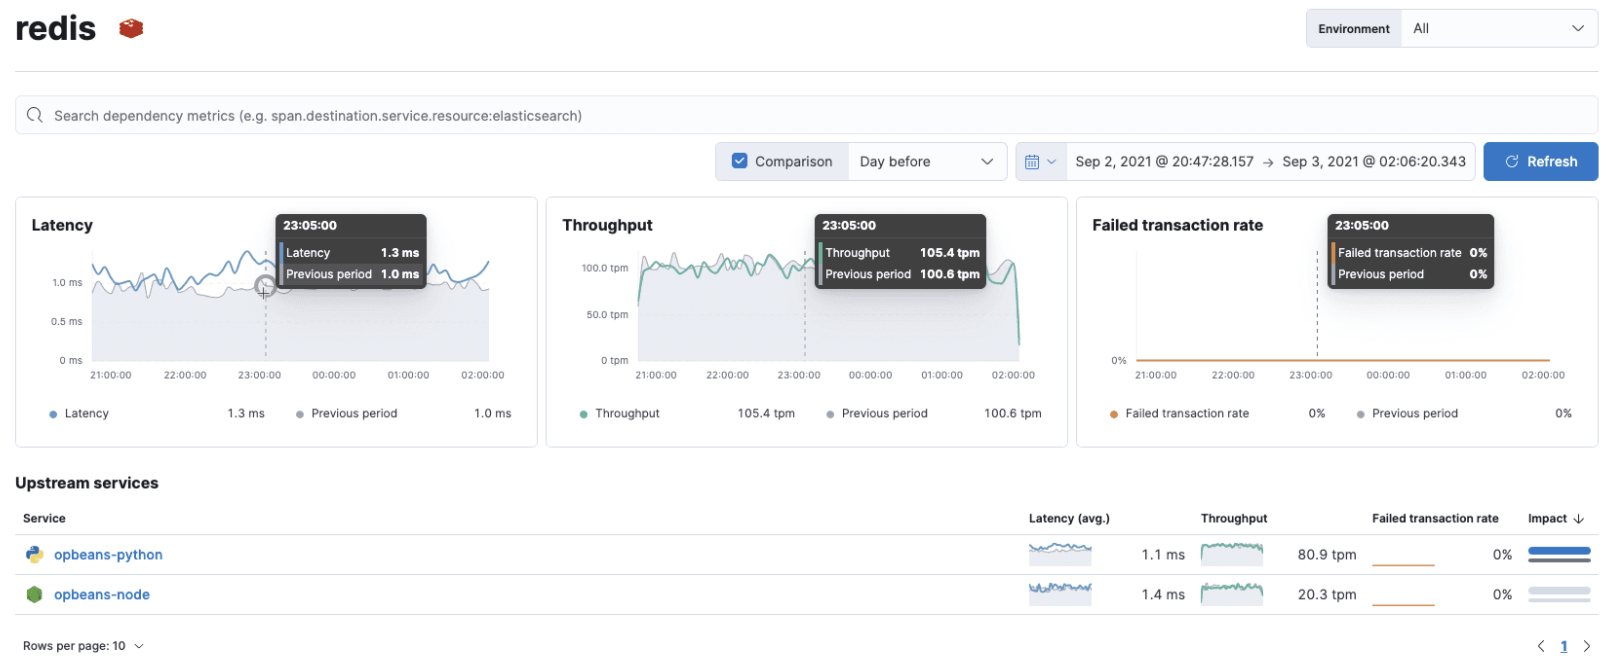
APM dependencies view
editIn 7.15 we introduce a dedicated experience to monitor the performance and impact of uninstrumented 3rd party backend services for faster root cause analysis. This includes any databases, queues, caches, cloud services, and services you haven’t yet instrumented with APM agents.
You can now easily understand backend services performance, compare it to historical trends, and assess any backend impact on upstream services.
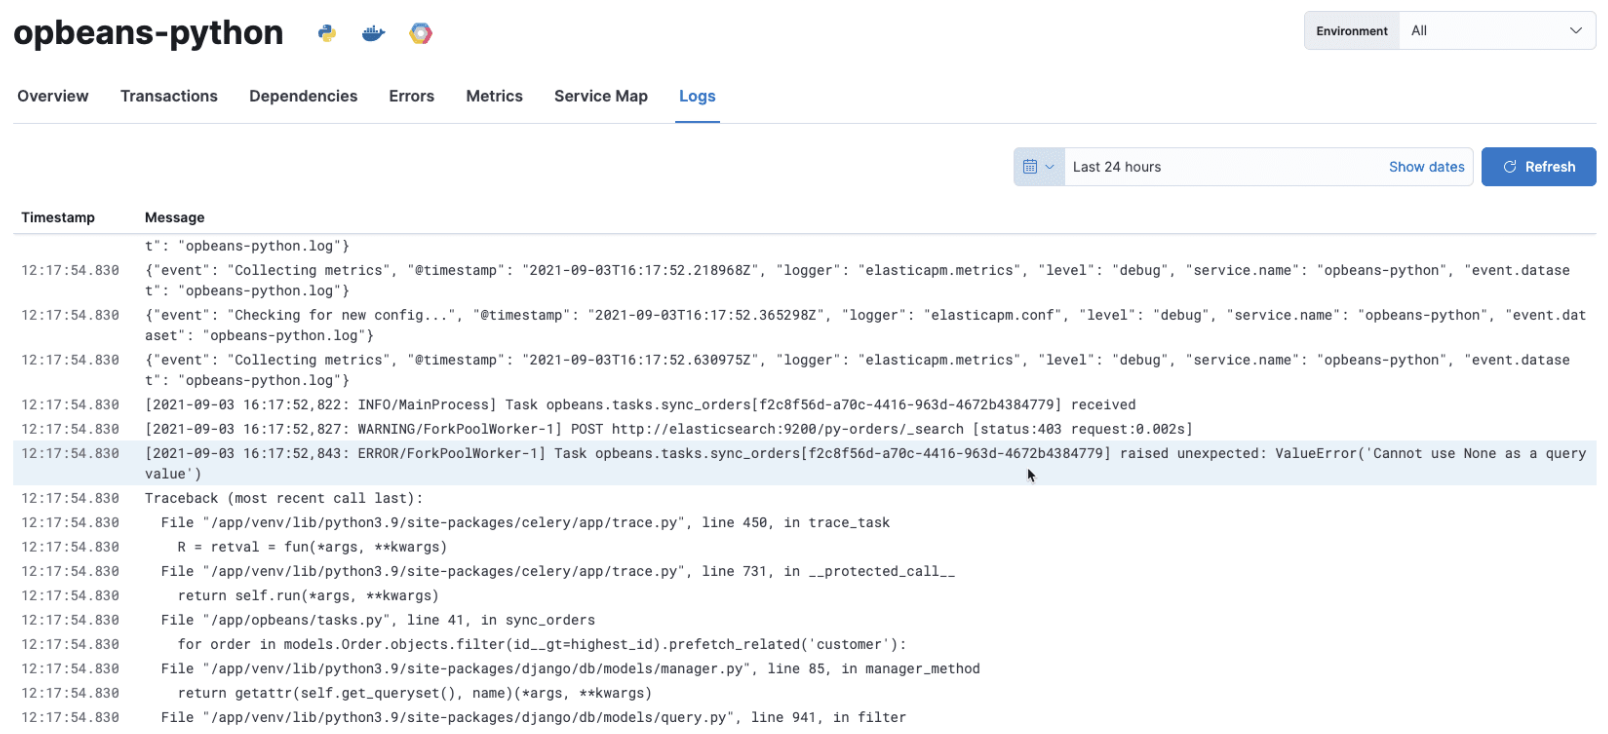
APM service logs view
editWe continue bringing application logs closer to you by integrating contextual logs across the APM UI. The 7.15 release brings the Logs view to the APM service overview, which is incredibly useful for ephemeral environments like containers or cloud.
Having one place to view logs across all instances enables you to focus on finding a root cause instead of jumping around multiple screens or tools.
Logs have been integrated into various contextual experiences in previous releases:
- 7.13: APM service instances allow direct links to the logs per container, pod or host instance.
- 7.12: The ability to add logs viewer to any Kibana dashboard.
- 7.11: With the release of ECS logging libraries, APM introduced logs as part of a distributed end-to-end trace view.
- 7.11: Introduced an enhanced host view to help diagnose any problem occurring on the visual or physical hosts.
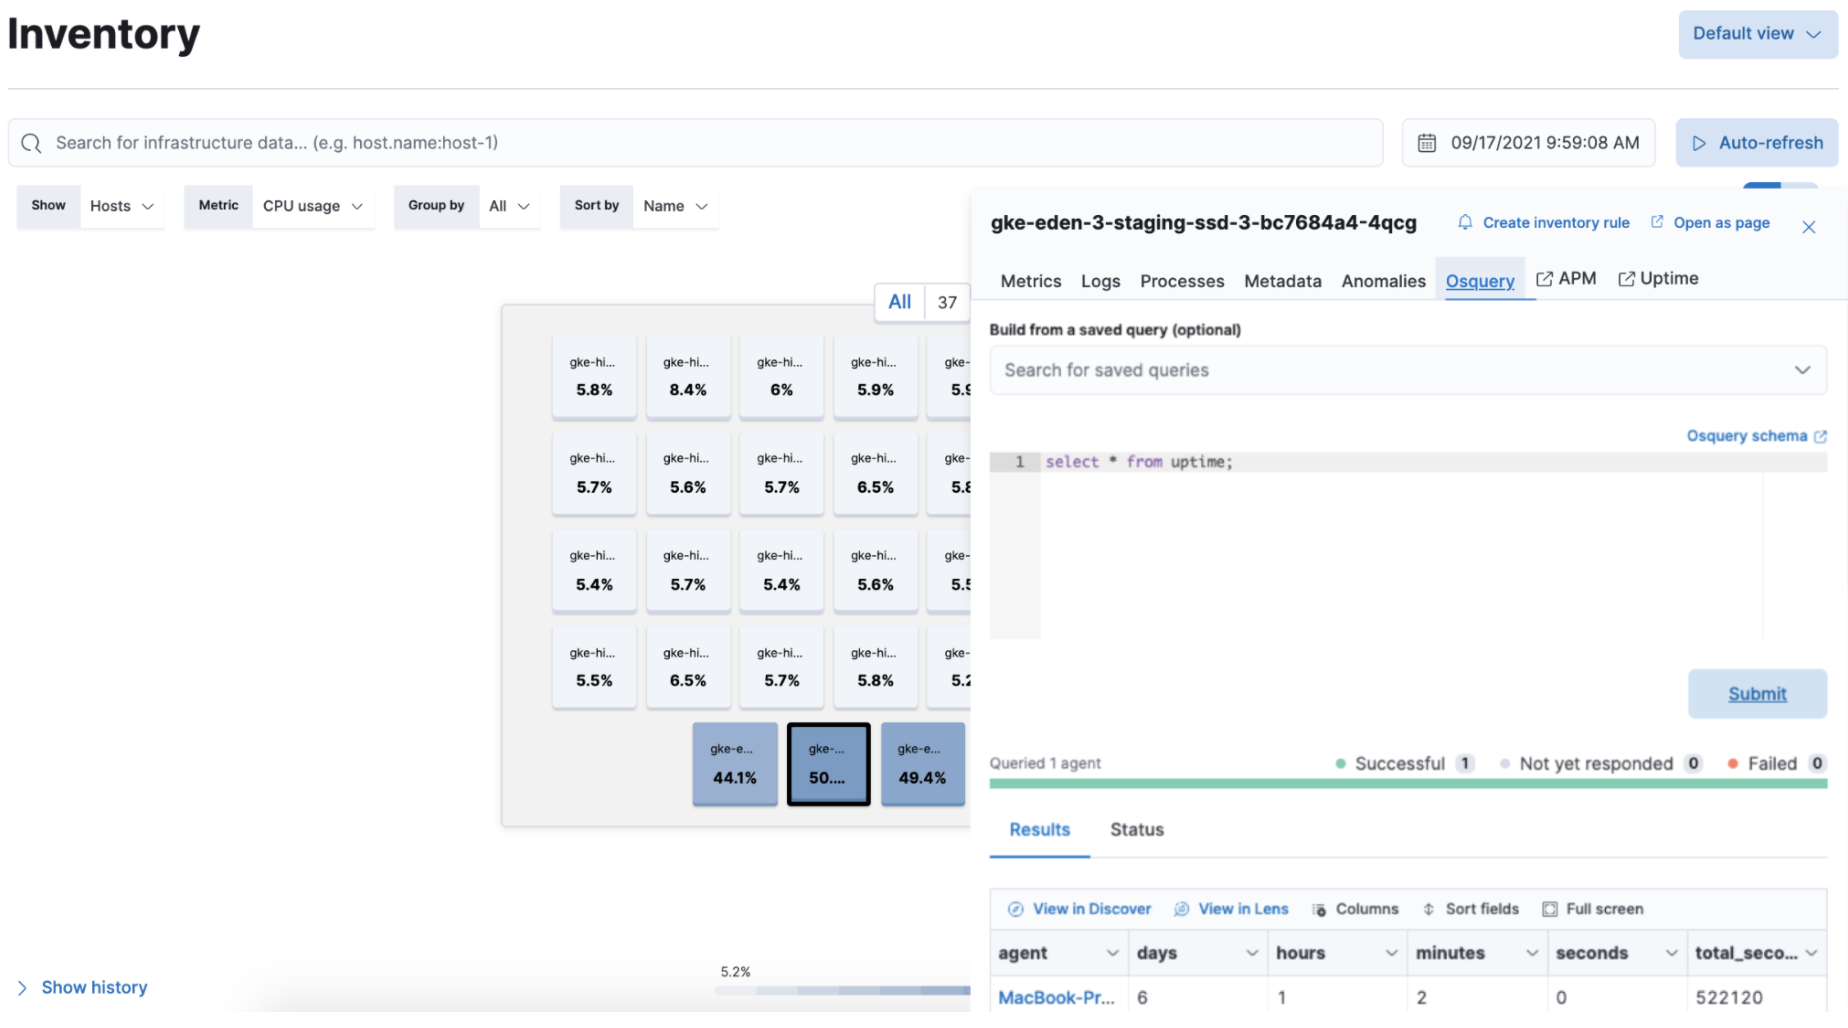
Interactive host inventory asset queries via osquery
editUsing interactive queries powered by osquery, you can discover more details on hosts, such as active processes, installed software packages, or running versions.
Centrally managed and interactive osquery search at scale, powered by Elastic Agent, is democratizing asset monitoring for everyone. To learn more, see our 7.13 blog.
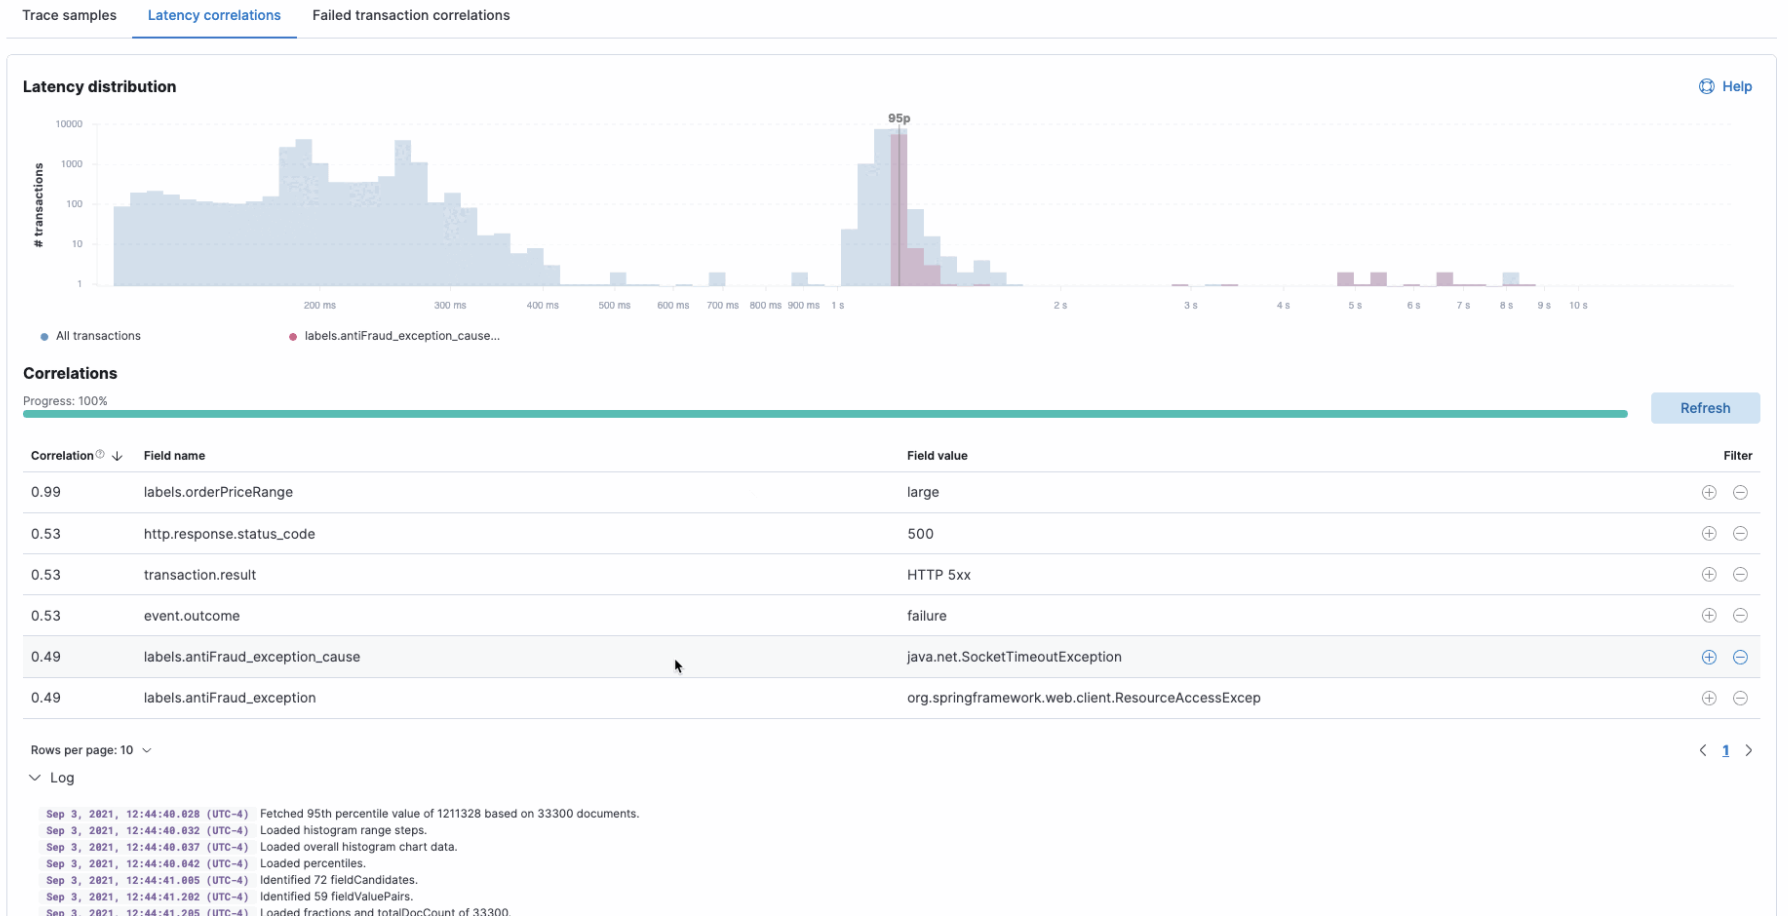
APM latency correlations (GA)
editAccelerate root cause analysis of transaction performance issues with APM correlations. Now in GA, this version brings an improved workflow, user experience, and better performance.
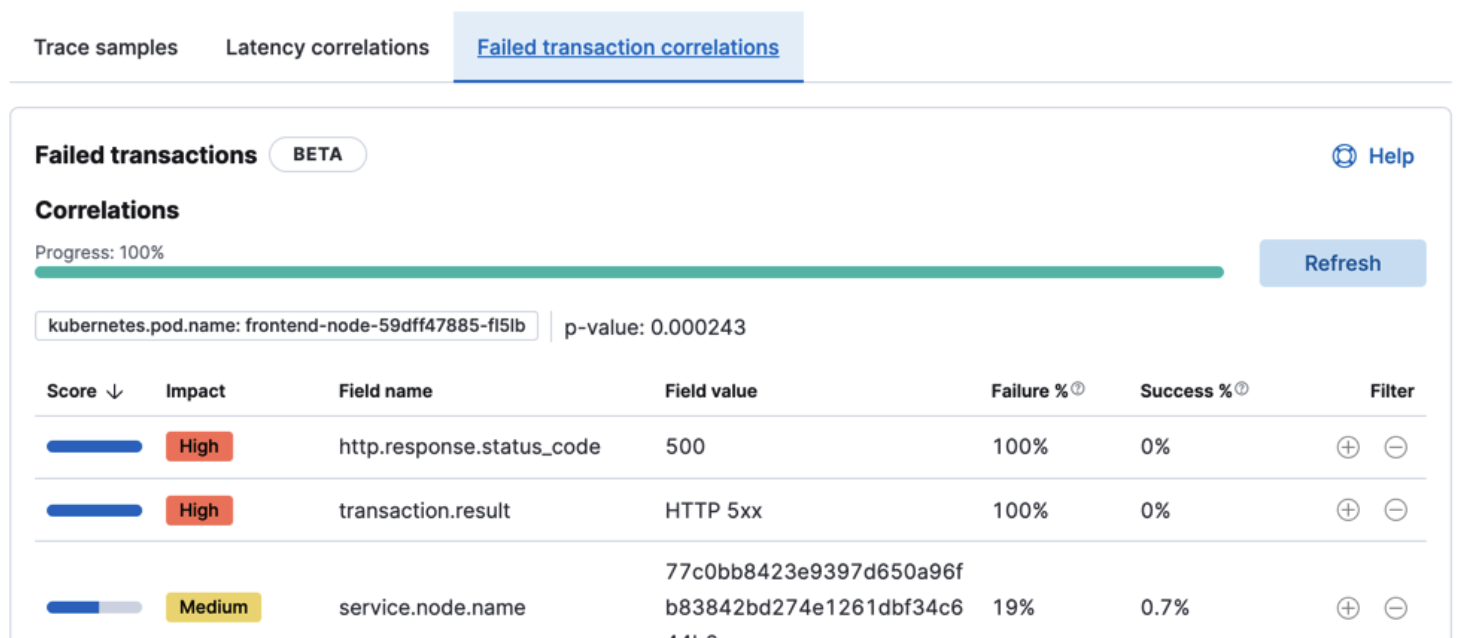
APM failed transactions correlations (Beta)
editIn 7.14 the latency correlations in APM were updated with new distribution charts and improved calculations, which help you find the biggest influencers on slow transactions.
In 7.15 the failed transaction correlations are enhanced to help you find attributes that occur more frequently in failed transactions than in successful transactions. Both features have also been moved from the Services page to the Transactions detail page. To learn more, see Correlations.