What’s new in 7.11
editWhat’s new in 7.11
editHere are the highlights of what’s new and improved in 7.11.
Other versions: 7.10 | 7.9 | 7.8 | 7.7 | 7.6 | 7.5 | 7.4
Give 7.11 a try
editTry 7.11 now by deploying Elasticsearch and Kibana on Elastic Cloud or by downloading them.
APM service overview page
editUnderstanding your services' performance and detecting a root cause just got easier with our new service overview page in the APM app.
In 7.11, the new service overview page is now your default starting point for investigating any services monitored by Elastic APM agents or with OpenTelemetry and Jaeger.
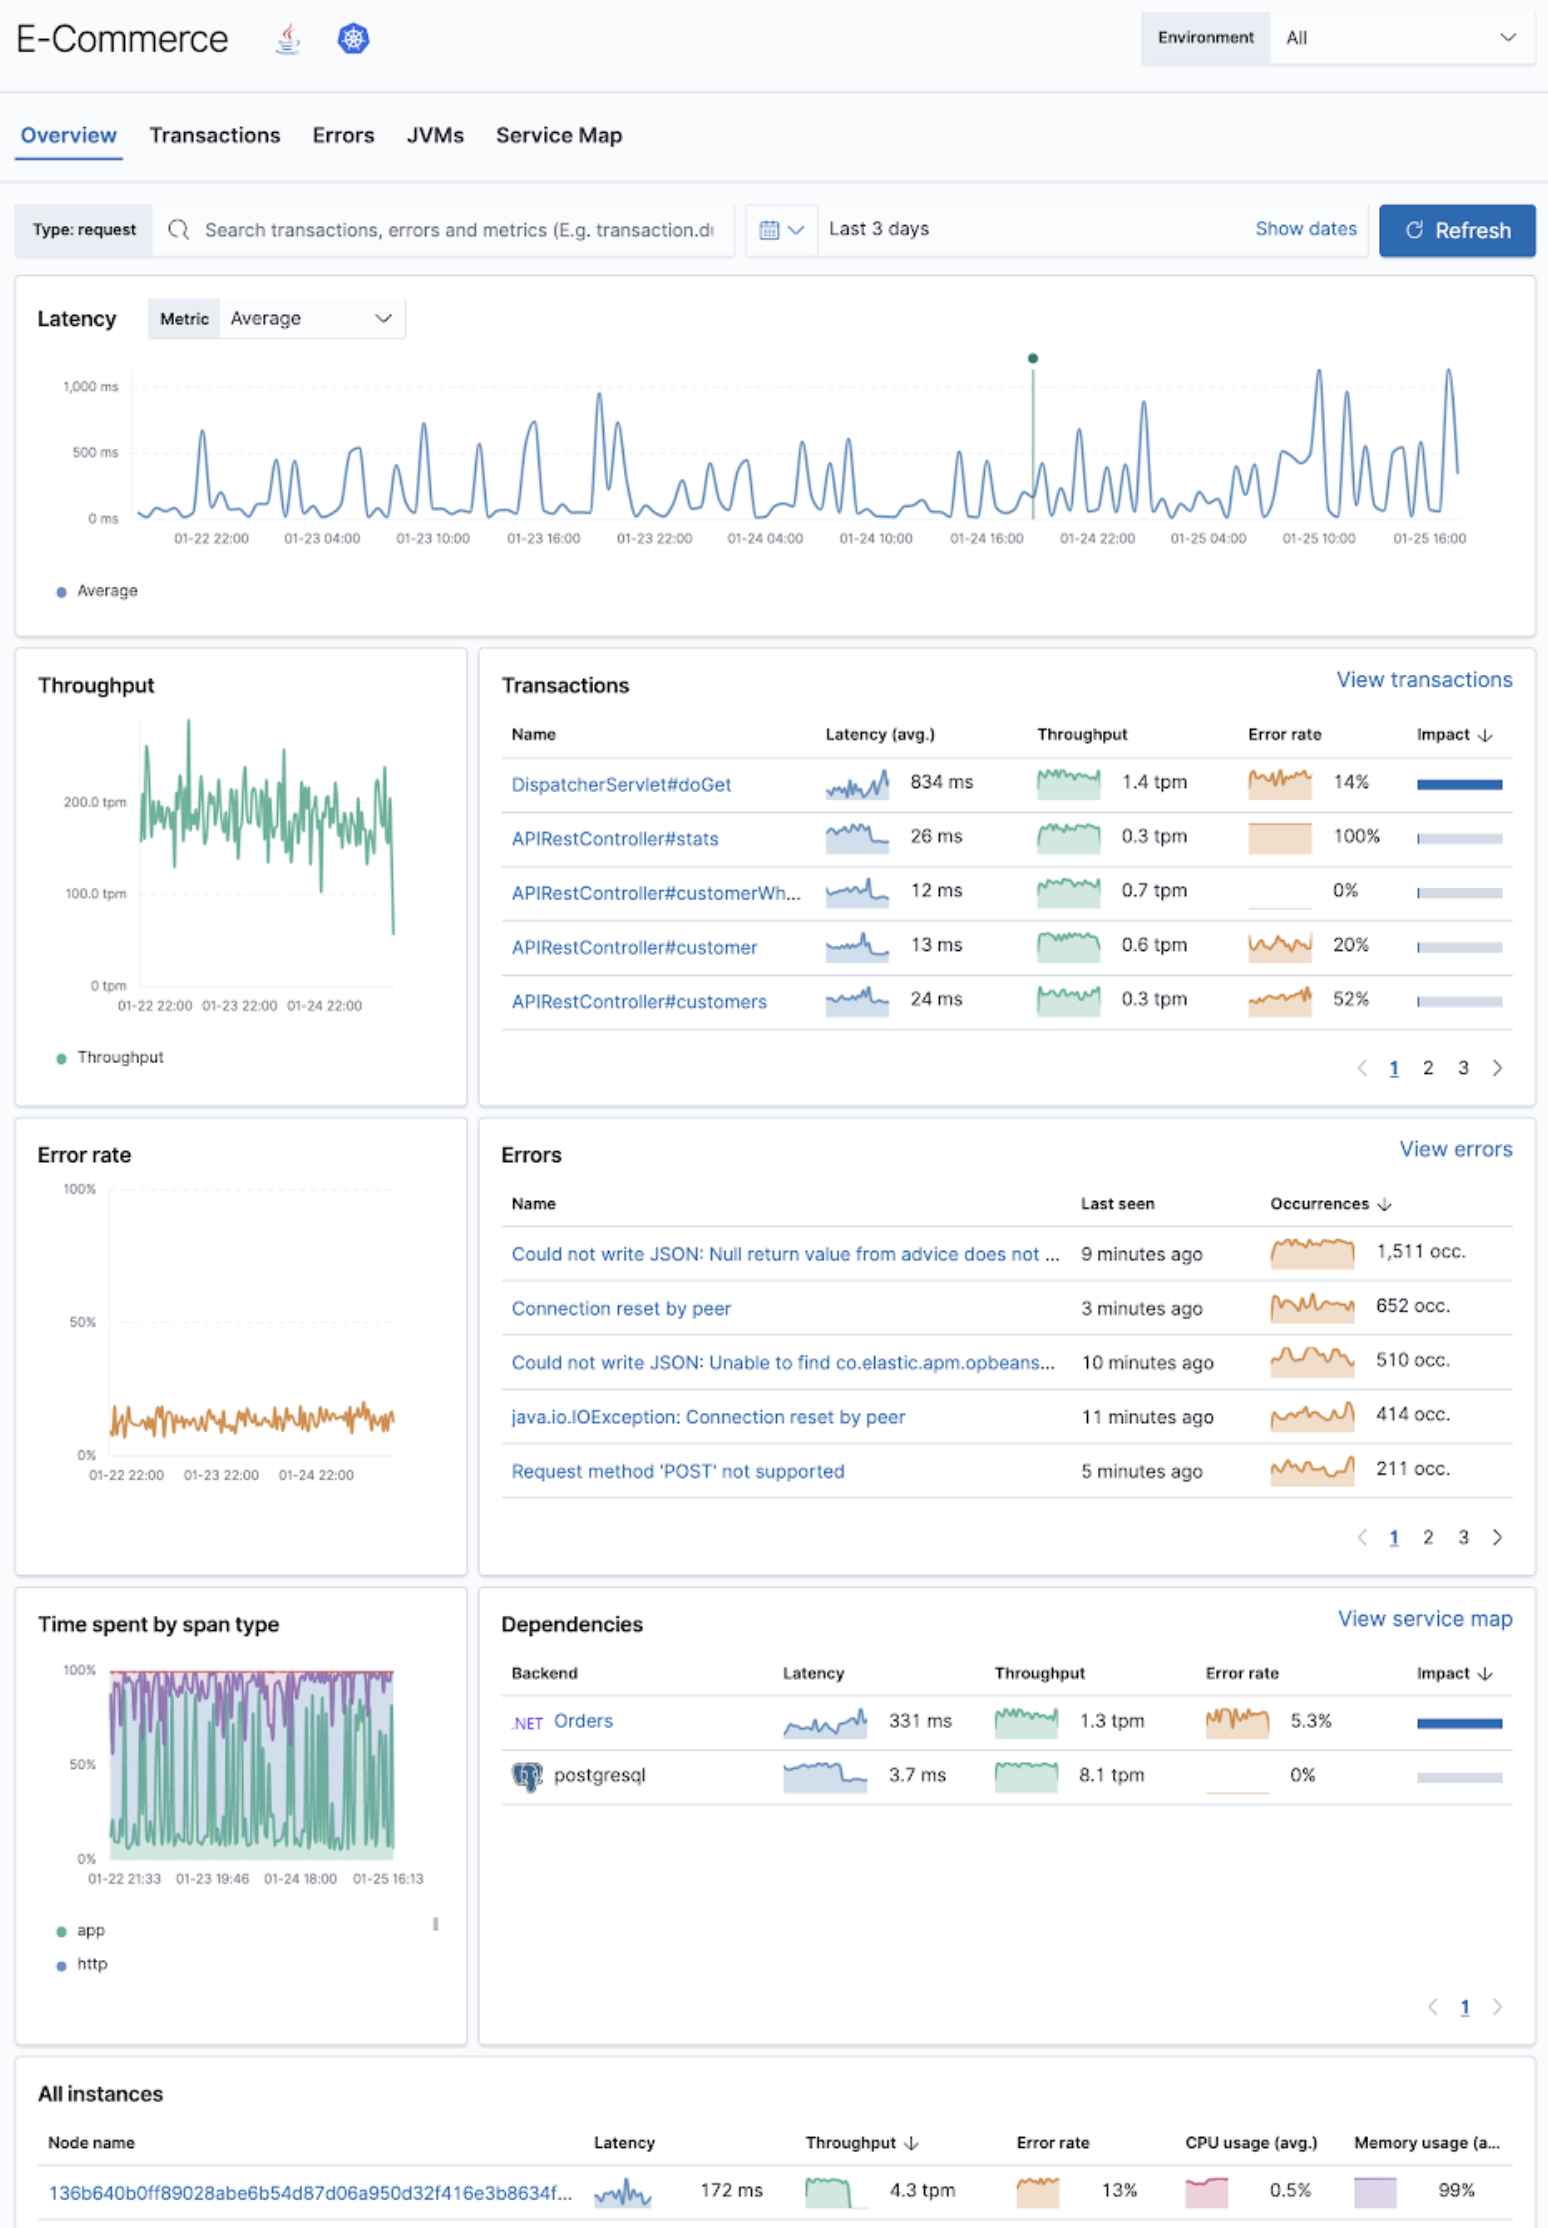
The improved APM service overview page provides you with:
- High-level details including service, runtime and framework versions, container and Kubernetes information, along with cloud metadata, if applicable.
- Latency timeline overlapped with deployment events, alert violations, and anomalies that occurred during the same period.
-
Top contributors grouped by separate dimensions:
- Transactions - quickly identify which transactions are impacted and drill down for details.
- Errors - correlate the rate of errors and exceptions and their start time to the service experience.
- Backends - understand which services and backends you depend on and how they impact your service performance.
- Instances - identify whether the problem is occurring on specific instances or across your entire cluster.
For more details, see Service overview.
APM and logs
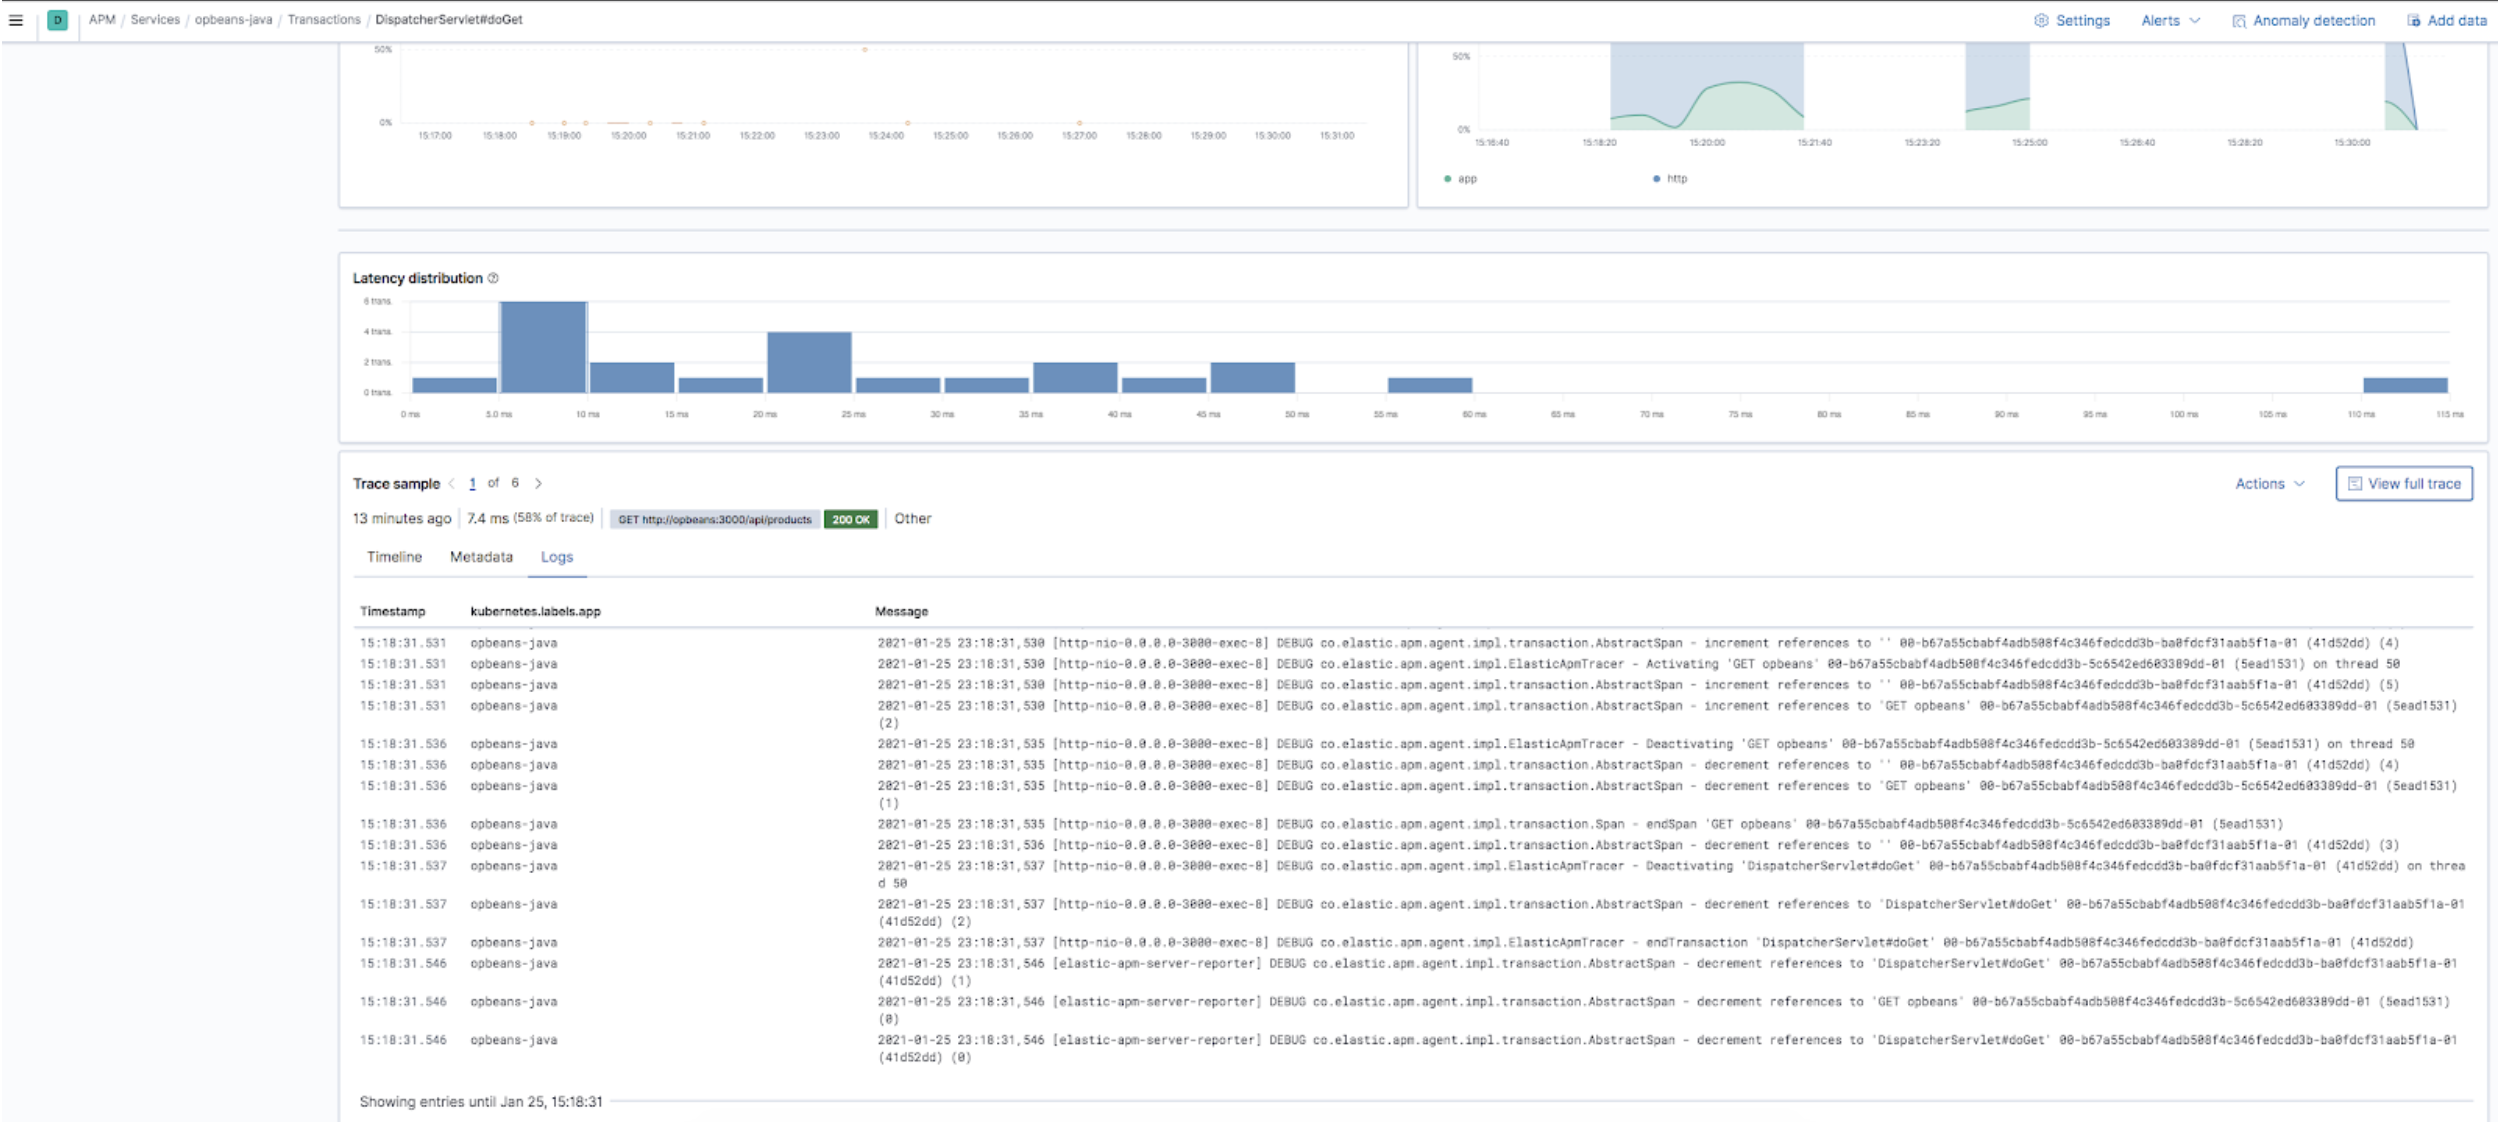
editInspecting application log data and contextual traces can be extremely helpful to troubleshoot a performance problem quickly. Since 7.5, the APM app has offered an easy navigation option that allows you to navigate from your distributed traces into the logs.
For 7.11, we have two exciting announcements:
- Elastic Common Schema (ECS) logging libraries are now generally available! You can now use ECS logger plugins to format your logs into ECS-compatible JSON. Using these libraries, along with an Elastic APM agent, means that you do not have any manual configuration to correlate logs to your application traces.
- Embedded trace logs are now available in the curated APM app, which means you no longer have to navigate outside the trace view to visualize your application logs. These contextualized and correlated logs quickly point you to the underlying issues within your application.
Enhanced host details view
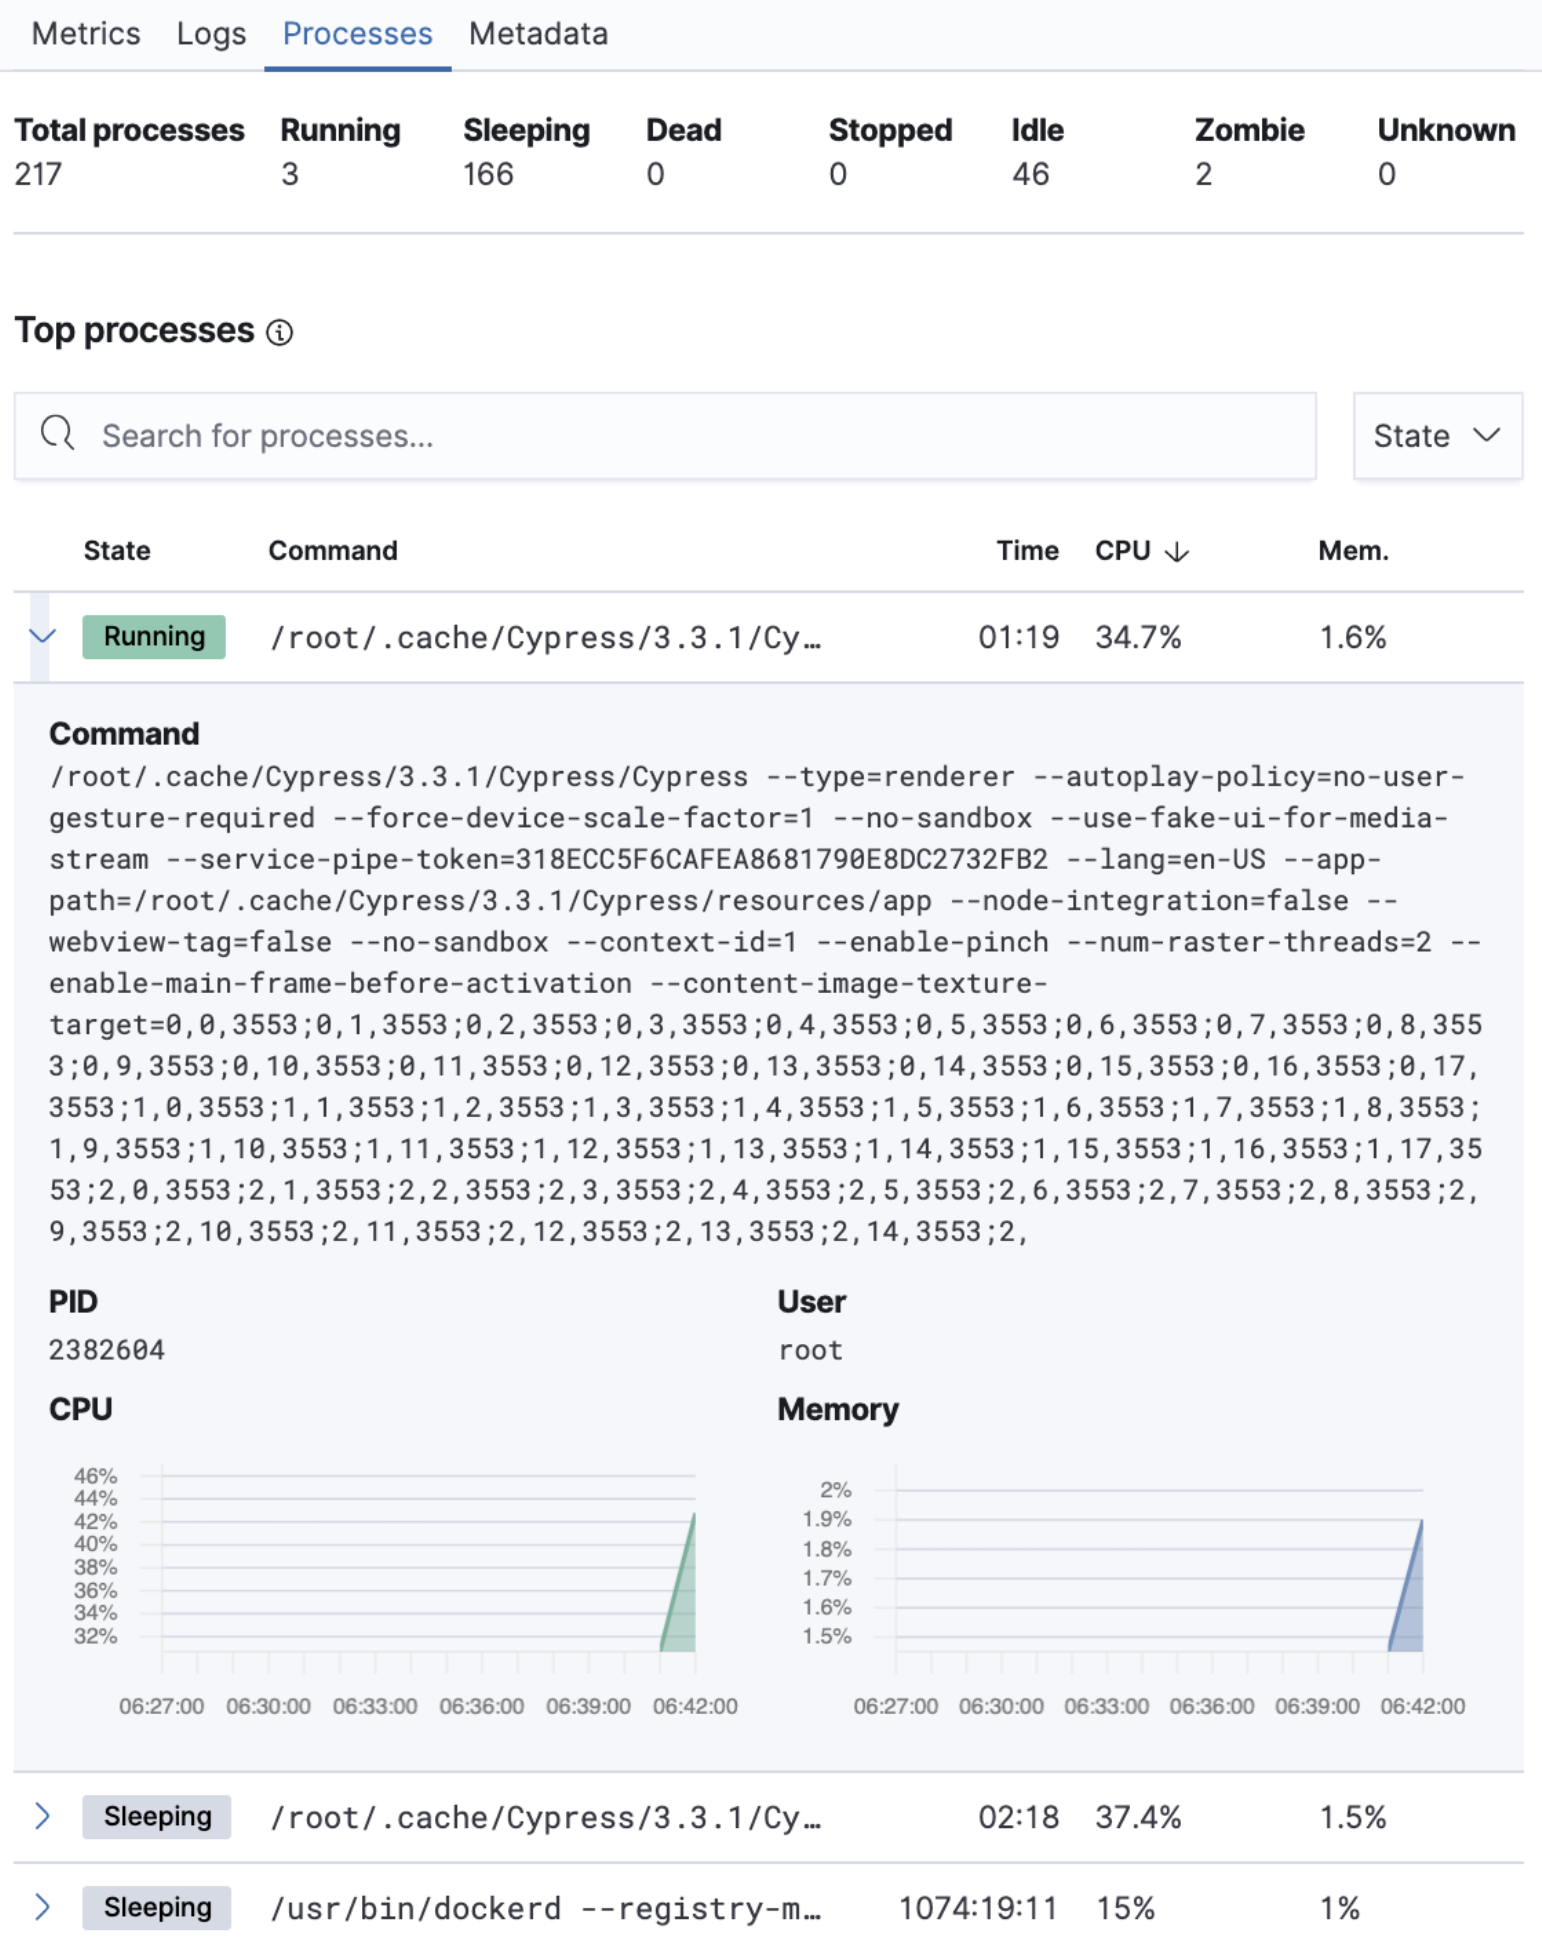
editMonitoring large infrastructures can be a complicated and time-consuming task. To get to the root cause of a problem, you may need to analyze multiple data streams from various infrastructure parts and keep track of related information. To help you minimize the time it takes to troubleshoot a problem, you want quick access to all the relevant details on the host, including the main KPIs, processes running on the host, logs originating from it, and other detailed host information.
In 7.11, we’re delighted to introduce an enhanced view of hosts or VMs to the Metrics app. Without leaving the Inventory page, you can view the following information about the host or VM:
- Time charts of key host metrics: CPU, memory, load, and network
- Logs generated by the host or the services running on the host
- Top processes running on the host by CPU or memory
- Host metadata: host, cloud, and agent information
The enhanced host details help accelerate root cause analysis by tightly aligning how the information is presented and accessed to a typical investigative workflow. This makes it easier for infrastructure ops teams to monitor and troubleshoot infrastructure issues.
For more details, see Host details.
Synthetics waterfall view
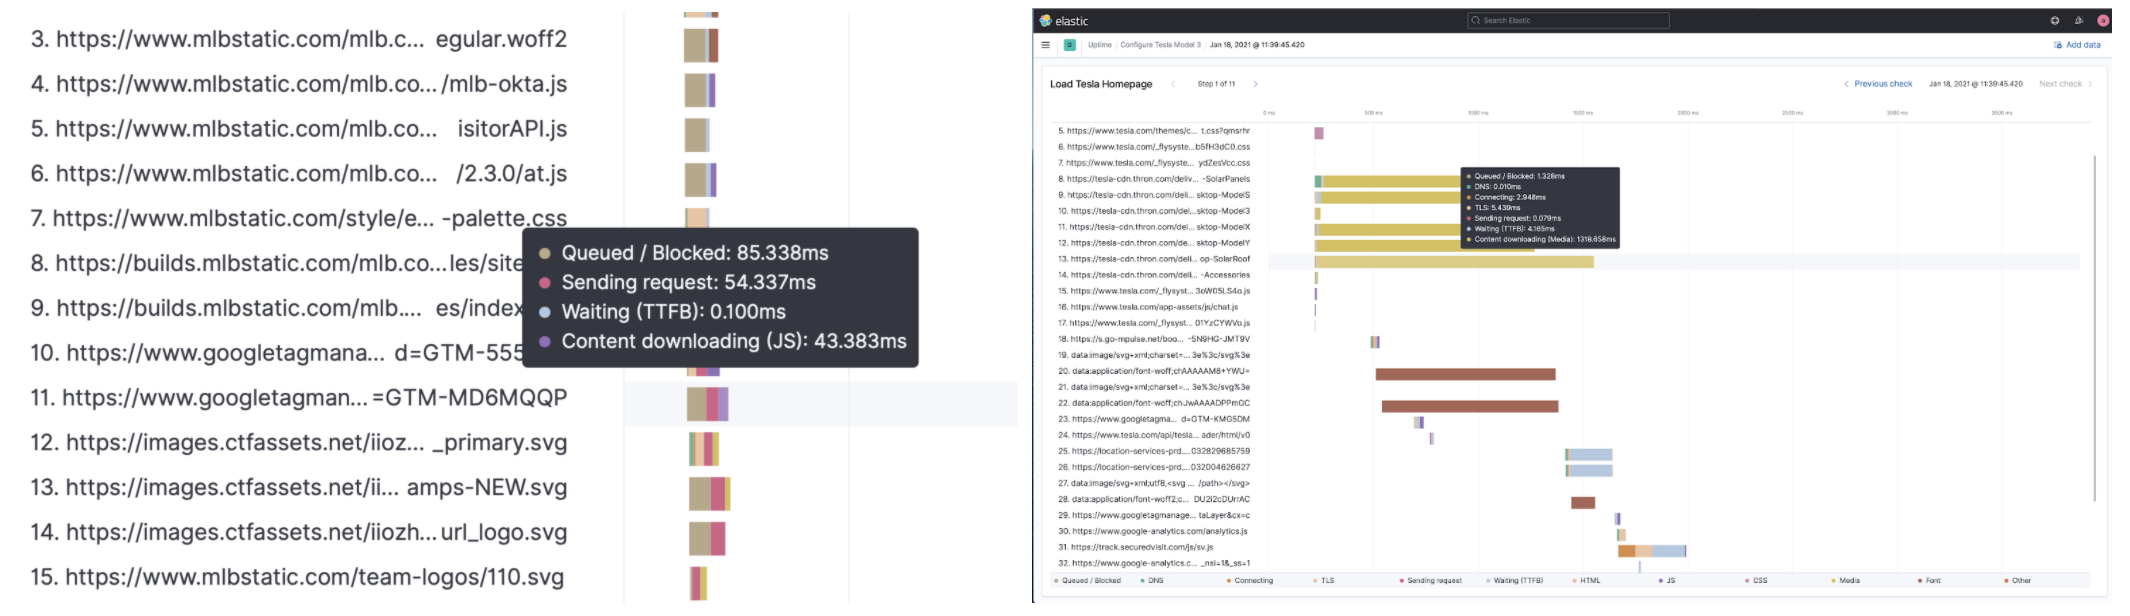
editWhen a webpage loads, what the end user sees on the screen is the combination of hundreds of HTML files, images, web fonts, Javascript, and other media objects. Browsers need to connect to servers, download, parse, and then render each of these for the user to do what they came to the website to do. There are many moving parts, and this is why a synthetic monitoring product must have the ability to see the object by object load of the website.
In 7.11, we’re excited to release the first iteration of our page load waterfall that displays each object’s connection stats. This iteration is a significant increase in functionality for our users, along with some unique capabilities in the market. There is a lot more coming in subsequent releases!
For more details, see Visualize synthetic monitoring.
Runtime fields in logs
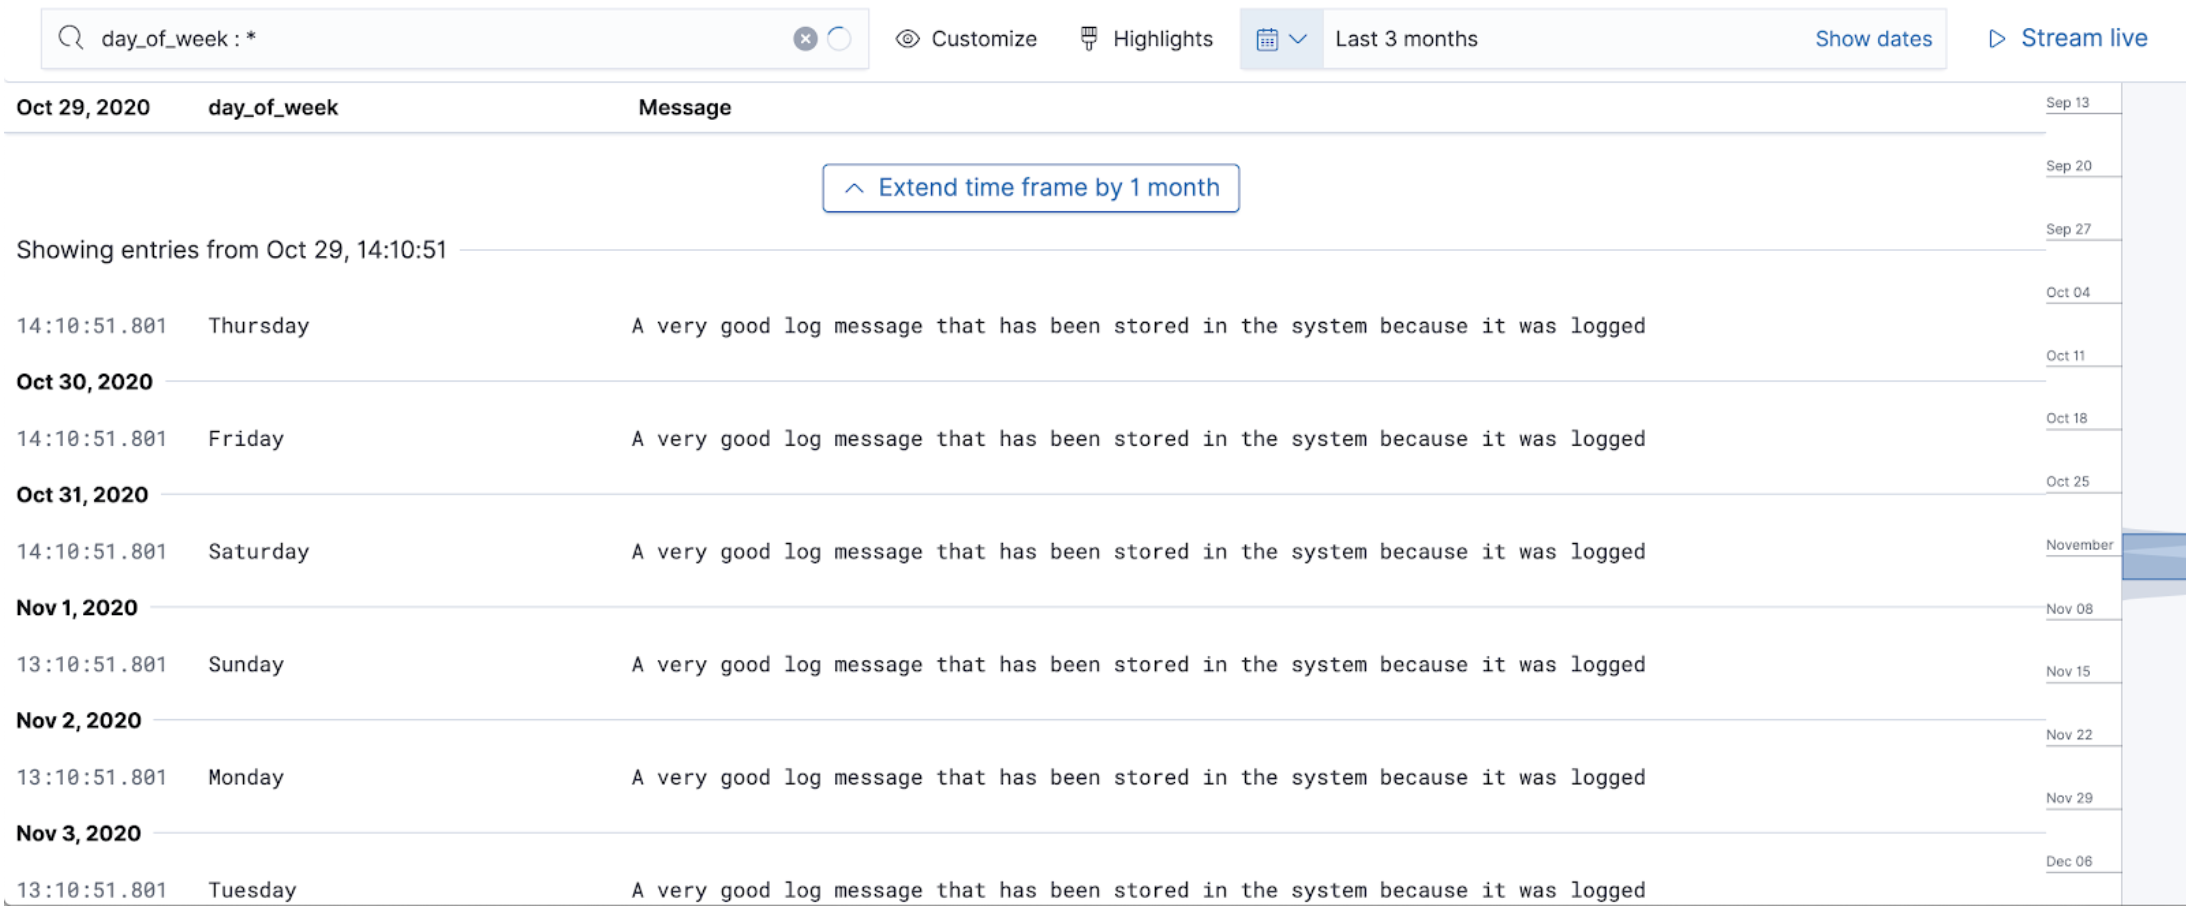
editFor 7.11, we are delighted to announce that Elasticsearch now supports creating
runtime fields in the Elastic Stack. Once a runtime field is created, for example, the
day_of_week field, you can view and filter them in the Logs app’s stream page,
just like standard fields.
For more information, see our latest blog.
Fleet and Elastic Agent (Beta 3)
editIn 7.11, we’re excited to release our third beta of Fleet and Elastic Agent. So you can identify and troubleshoot issues faster, we have added better observability to Elastic Agent integrations, logs, and metrics. This helps you gain visibility into issues with Elastic Agent right inside the Fleet app.
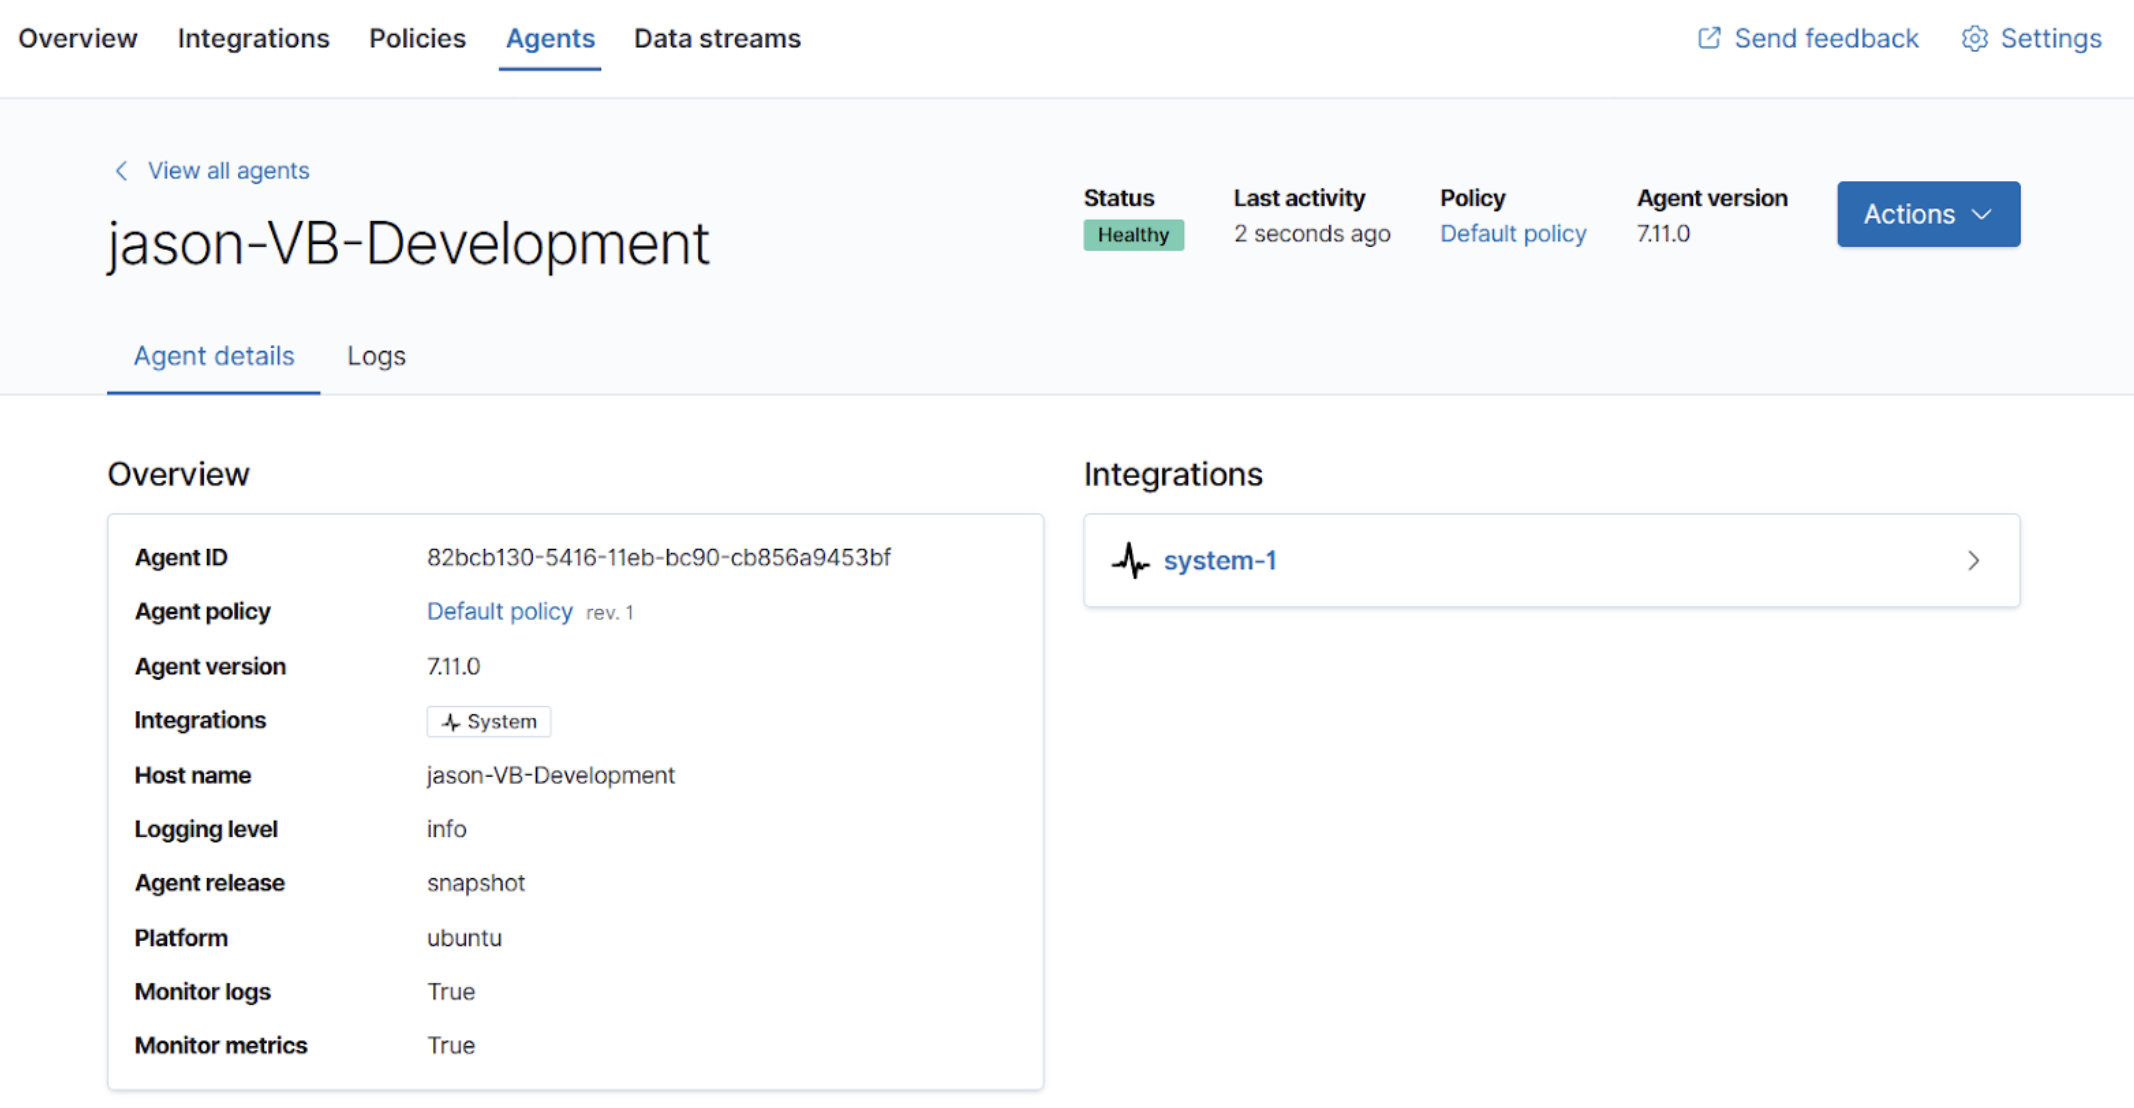
The agent details page now shows information about the agent settings, the host, and which integrations are running.
Additionally, the status information from the Elastic Agent is now available in Elasticsearch. We added a simple log viewer that lets you easily search and filter. It is only compatible with Elastic Agents version 7.11 or higher. For a richer experience, you can also open the Logs app to view the logs.
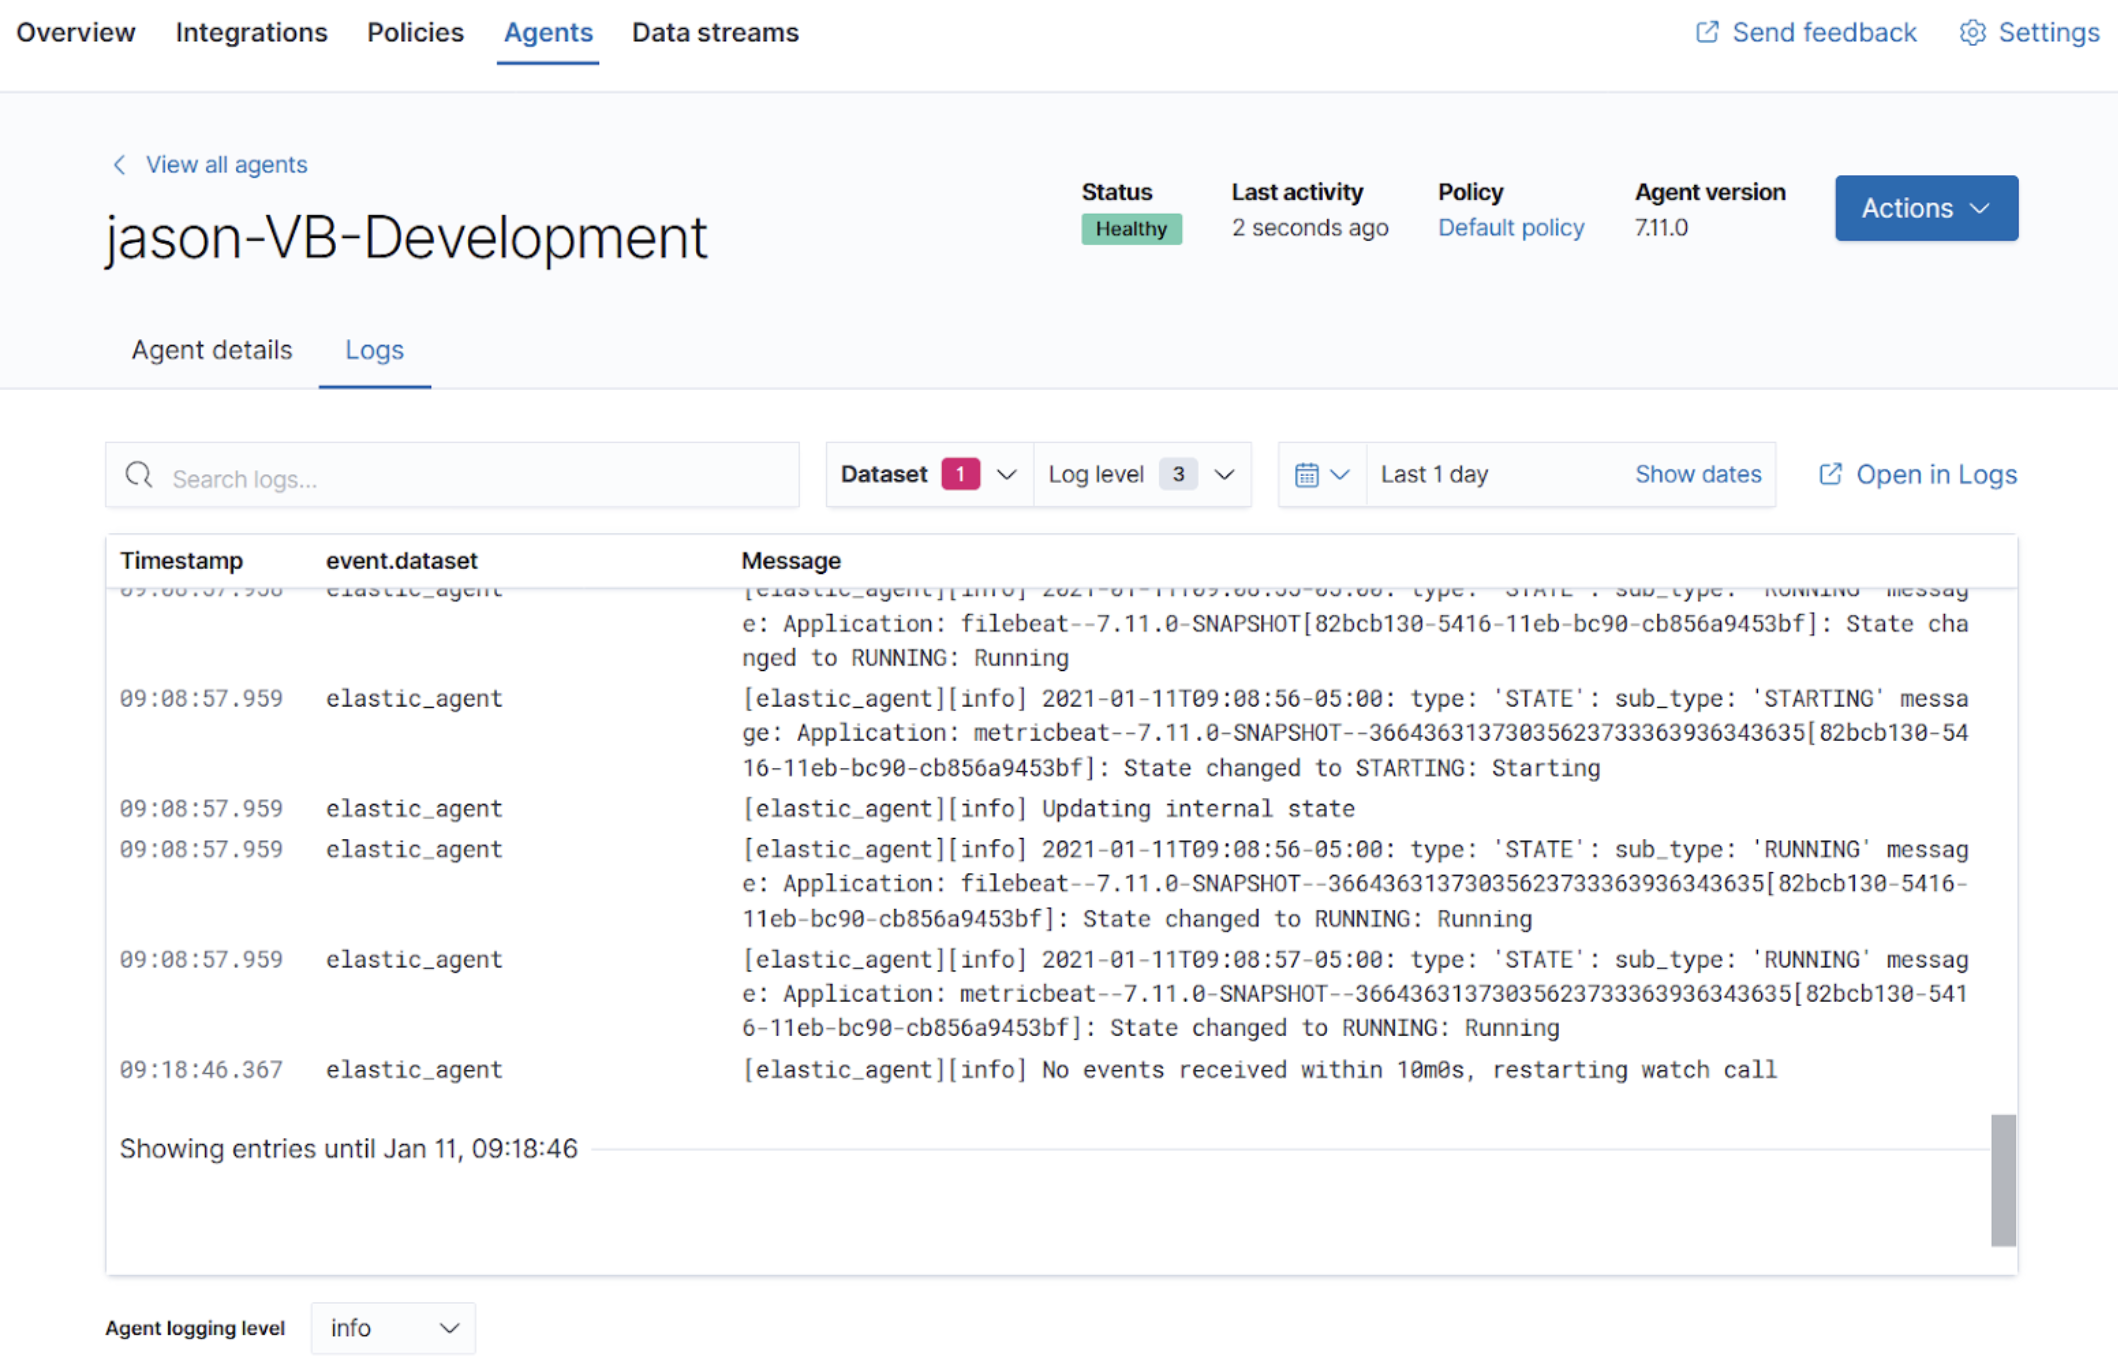
For more in-depth insight when troubleshooting, we’ve made it easier to debug logging. At the bottom of the page, you can change the log level for the agent. You can apply it selectively on a per-agent basis to avoid sending a high volume of data from all your agents.
We’ve also improved agent binary upgrades. To ensure that the agent remains functioning and reachable from the Fleet app, we will automatically roll the agent back to the previous version during an upgrade, if it has an error.
Finally, Elastic Agent can self-protect when the Endpoint Security integration is enabled. Self-protection means that Endpoint Security guards against users and attackers interfering with Elastic Agent’s functionality. Over time, we will enhance these guards to prevent interference with Elastic Agent.
APM Prometheus metrics client
editIn 7.11, the APM Python agent learned a new trick! The latest version can automatically detect and monitor Prometheus metrics by auto-instrumentation of the Prometheus Python library.
Your application custom metrics are now monitored with zero effort whenever you monitor your Python applications with APM. Once you hook up custom metrics, you can quickly build a Kibana dashboard using TSVB or Lens to analyze them and correlate with other performance metrics.
Elastic Logging Plugin for Docker (GA)
editFor 7.11, the Docker logging plugin for enabling a simpler user experience for application logging is now generally available.
You can use the Elastic Logging Plugin for Docker to forward logs to Elasticsearch, Logstash, Kafka, or Redis, for all Docker containers or on a per-container basis. Unlike other Beats, the Elastic Logging Plugin for Docker requires no elevated permissions to read container logs, and the installation is performed entirely within the Docker CLI.
Filebeat and Metricbeat modules (GA)
editFor 7.11 we’re excited to announce the general availability of the following modules:
These integrations are now stable, production-ready, and fully supported!
Natively collect AWS Fargate metrics
editIf you’re running Amazon’s ECS or EKS, the chances are you’re using AWS Fargate to manage these deployments, because Fargate removes the responsibility of provisioning and managing the underlying EC2 infrastructure. You only need to specify your containers and tasks.
In 7.11, we’ve added a metric collection from AWS Fargate service to our cloud integrations list.
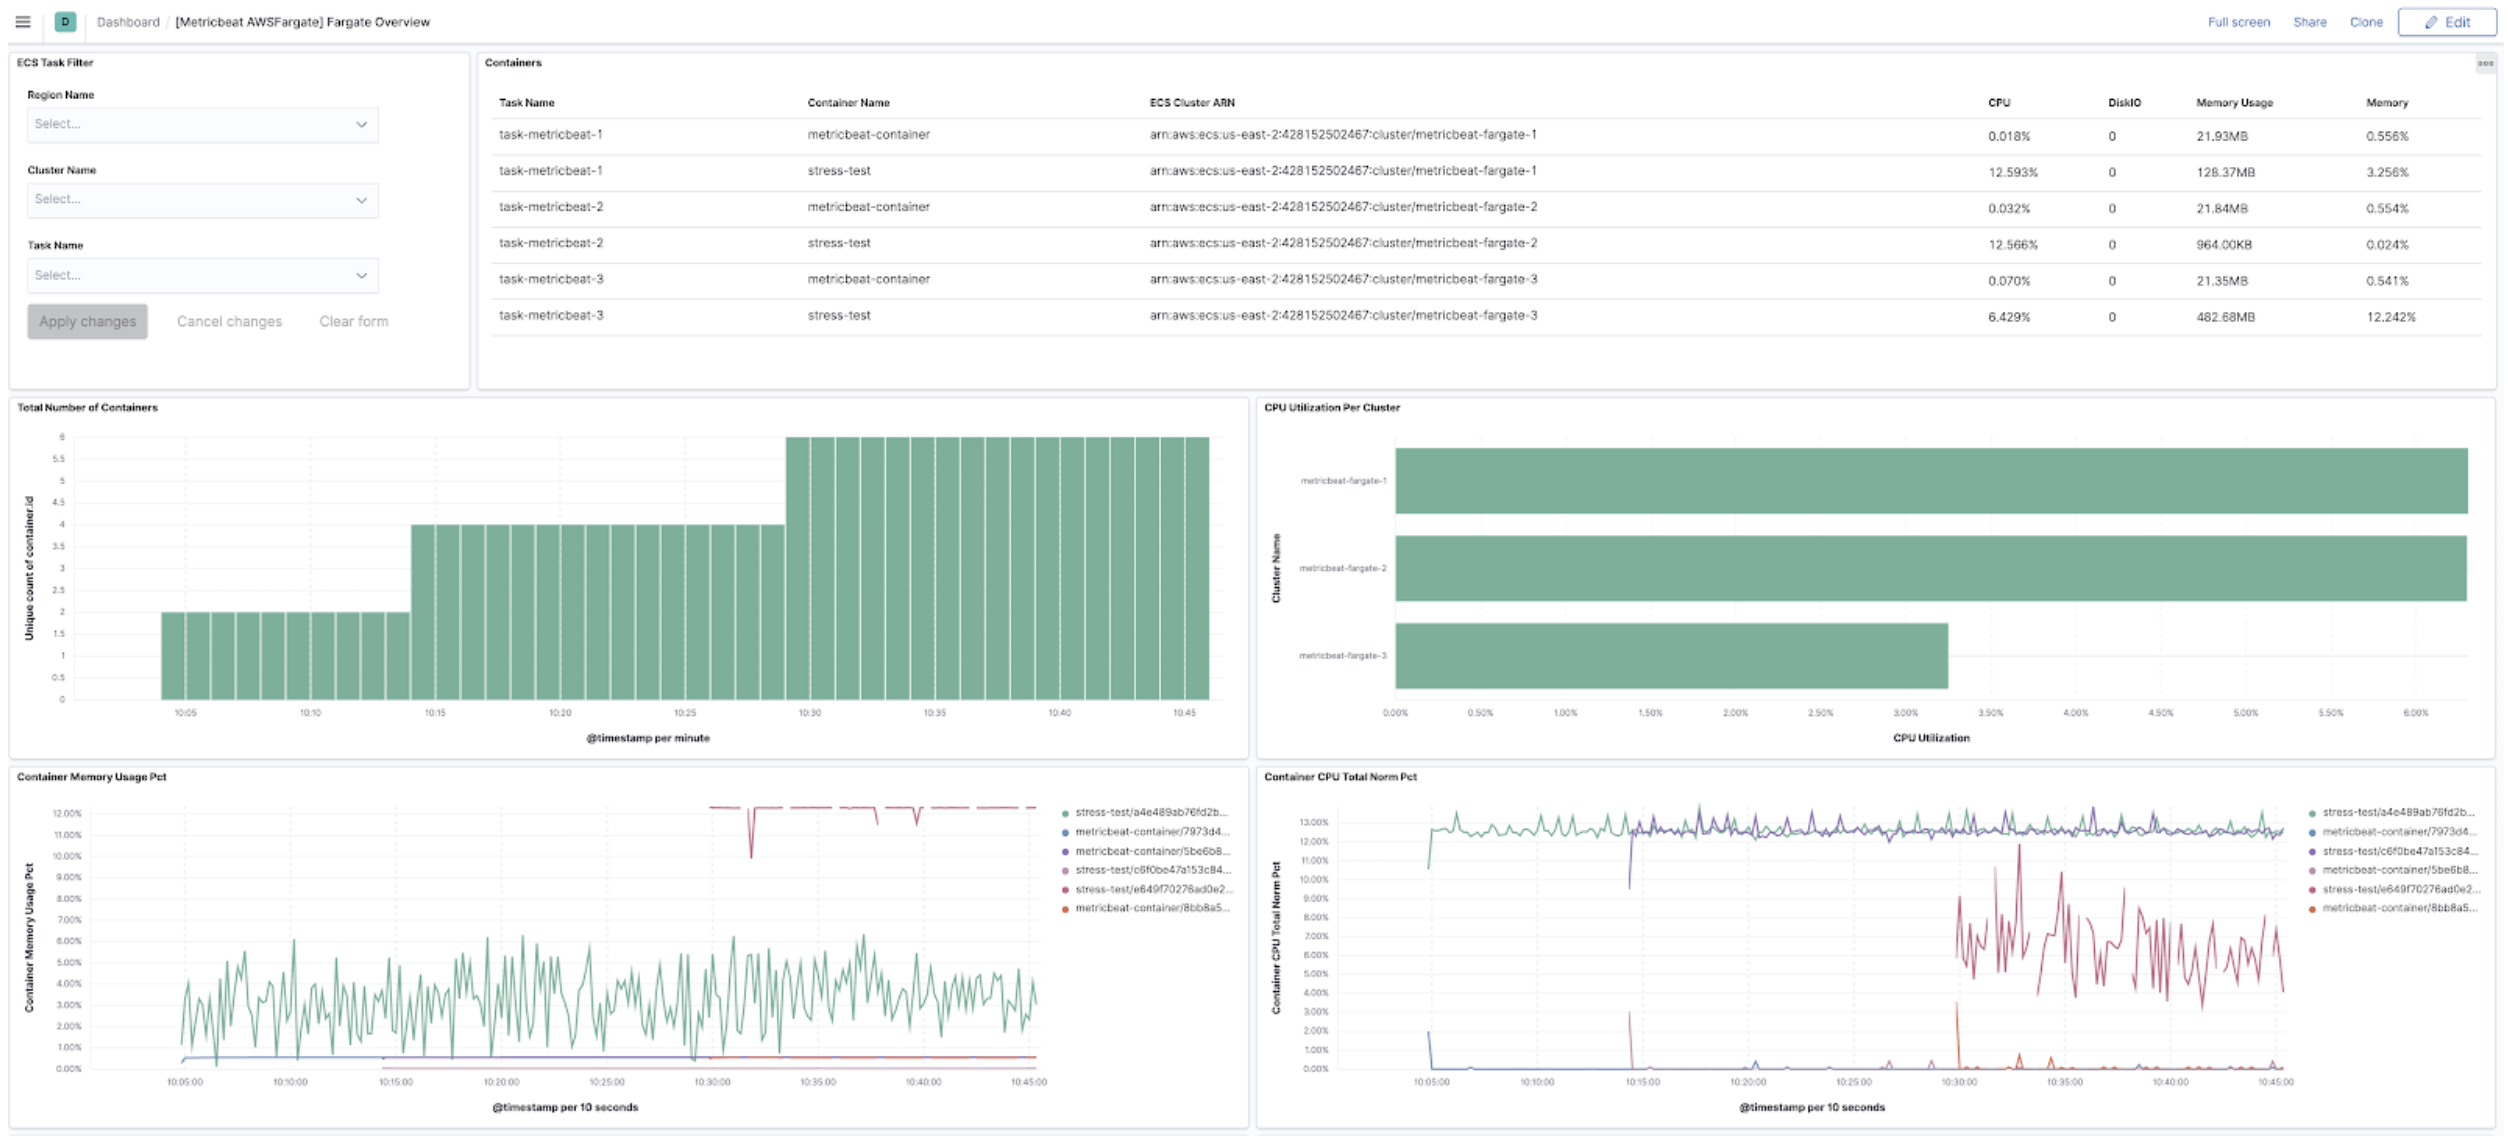
The new AWS fargate Metricbeat module collects
container metrics and metadata from the Fargate task metadata endpoints and allows you to
monitor containers inside the same AWS Fargate task.
The fargate module comes with a prebuilt dashboard where you can see all your containers and
their key metrics in a given cluster or region, giving you an overview of all your Fargate tasks.
Kibana alerting framework (GA)
editFor 7.11, we are delighted to announce the Kibana alerting framework’s general availability. It has been in beta for the past few minor releases, during which we have improved scalability and architecture.
With Kibana alerting integrated with Elastic Observability, you can create alerts and route notifications to external systems for further triaging.
Searchable snapshots in Elastic Cloud (GA)
editRetain and search more data with searchable snapshots on low-cost object stores and the new cold data tier. Double your storage density or save on infrastructure costs with the new cold tier powered by searchable snapshots and object stores like S3.
Native support of CCR and CCS in Elastic Cloud
editReplicate and search data across regions and cloud providers to increase availability and better search performance with enhanced cross-cluster replication (CCR) and cross-cluster search (CCS).