What's new in Elastic Observability 7.9: Unified agent and KPI overview dashboard
We are pleased to announce version 7.9 of the Elastic Observability solution, adding several exciting new capabilities that focus on reducing time to value for observability teams. Our latest version adds a single, unified agent for collecting all kinds of telemetry data that dramatically simplifies data onboarding down to just a few clicks; a new observability overview page that surfaces key insights across all your telemetry data and provides a curated at-a-glance view of the health of your technology stack; and 50+ turnkey security detections that help security teams get instant value from observability data.
Experience the latest version of Elastic Observability on our Elasticsearch Service on Elastic Cloud (a free 14-day trial is available) or install the latest version of the Elastic Stack for a self-managed experience.
And now, without further ado, here are the release highlights.
Onboarding data gets radically simpler with a single, unified agent
Data ingest is a critical — and often time-consuming — piece of observability and security workflows. How easy is it to instrument the system you want to monitor? Is the collected data parsed and structured to be usable? How quickly can you visualize and get key insights from this data? Now multiply this by the thousands of components — hosts, containers, applications, middleware, and more — in your environment, and the operational aspects such as deployment, configuration, and upgrades become just as critical.
Our vision is to simplify the ingest process down to one agent, one-click so that observability engineers can spend more time acting on insights, and less time managing their ingest to get to the insight. We are excited to announce that we are taking our first step (a really BIG step) towards achieving this vision with the launch of a single unified agent, along with several new ingest capabilities in version 7.9.
These new capabilities are in beta in 7.9, and we invite our users to try these features out and provide us with feedback.
- Elastic Agent, one agent to collect it all: Elastic Agent is a single, unified way to collect all kinds of telemetry data from a host. Elastic Agent (beta) supports logs, metrics, and endpoint security data collection in 7.9, with plans to expand to include APM and other data types in the future. Having a single agent to install, configure, update, upgrade, and maintain is a huge efficiency boost for operators. And, with a single configuration file, adding or removing sources is just a click away.
- Integrations for popular services and platforms: 7.9 has support for ~40 integrations, with plans to port all 100+ Beats modules over in the next few releases. Integrations ship with prepackaged content like dashboards and a data transformation pipeline that let you go from data to insight in literally minutes.
- Centrally manage all your agents with Fleet — the control tower for all deployed agents: A typical enterprise will usually have agents deployed on tens of thousands of hosts. Our goal with Fleet is to make it easy for operators to manage this spread from a single place. When you make a change to a configuration, all the agents using that configuration will get the new configuration, often within seconds, simplifying the operational aspects even further. Goodbye SSH and automation playbooks.
- Ingest Manager, one UI to control i(nges)t all: Ingest Manager (beta) is a brand new Kibana app to control all aspects of your ingest universe from a central place. Create, edit, and update your agent configuration using the convenient Configuration Editor. So long, YAML files.
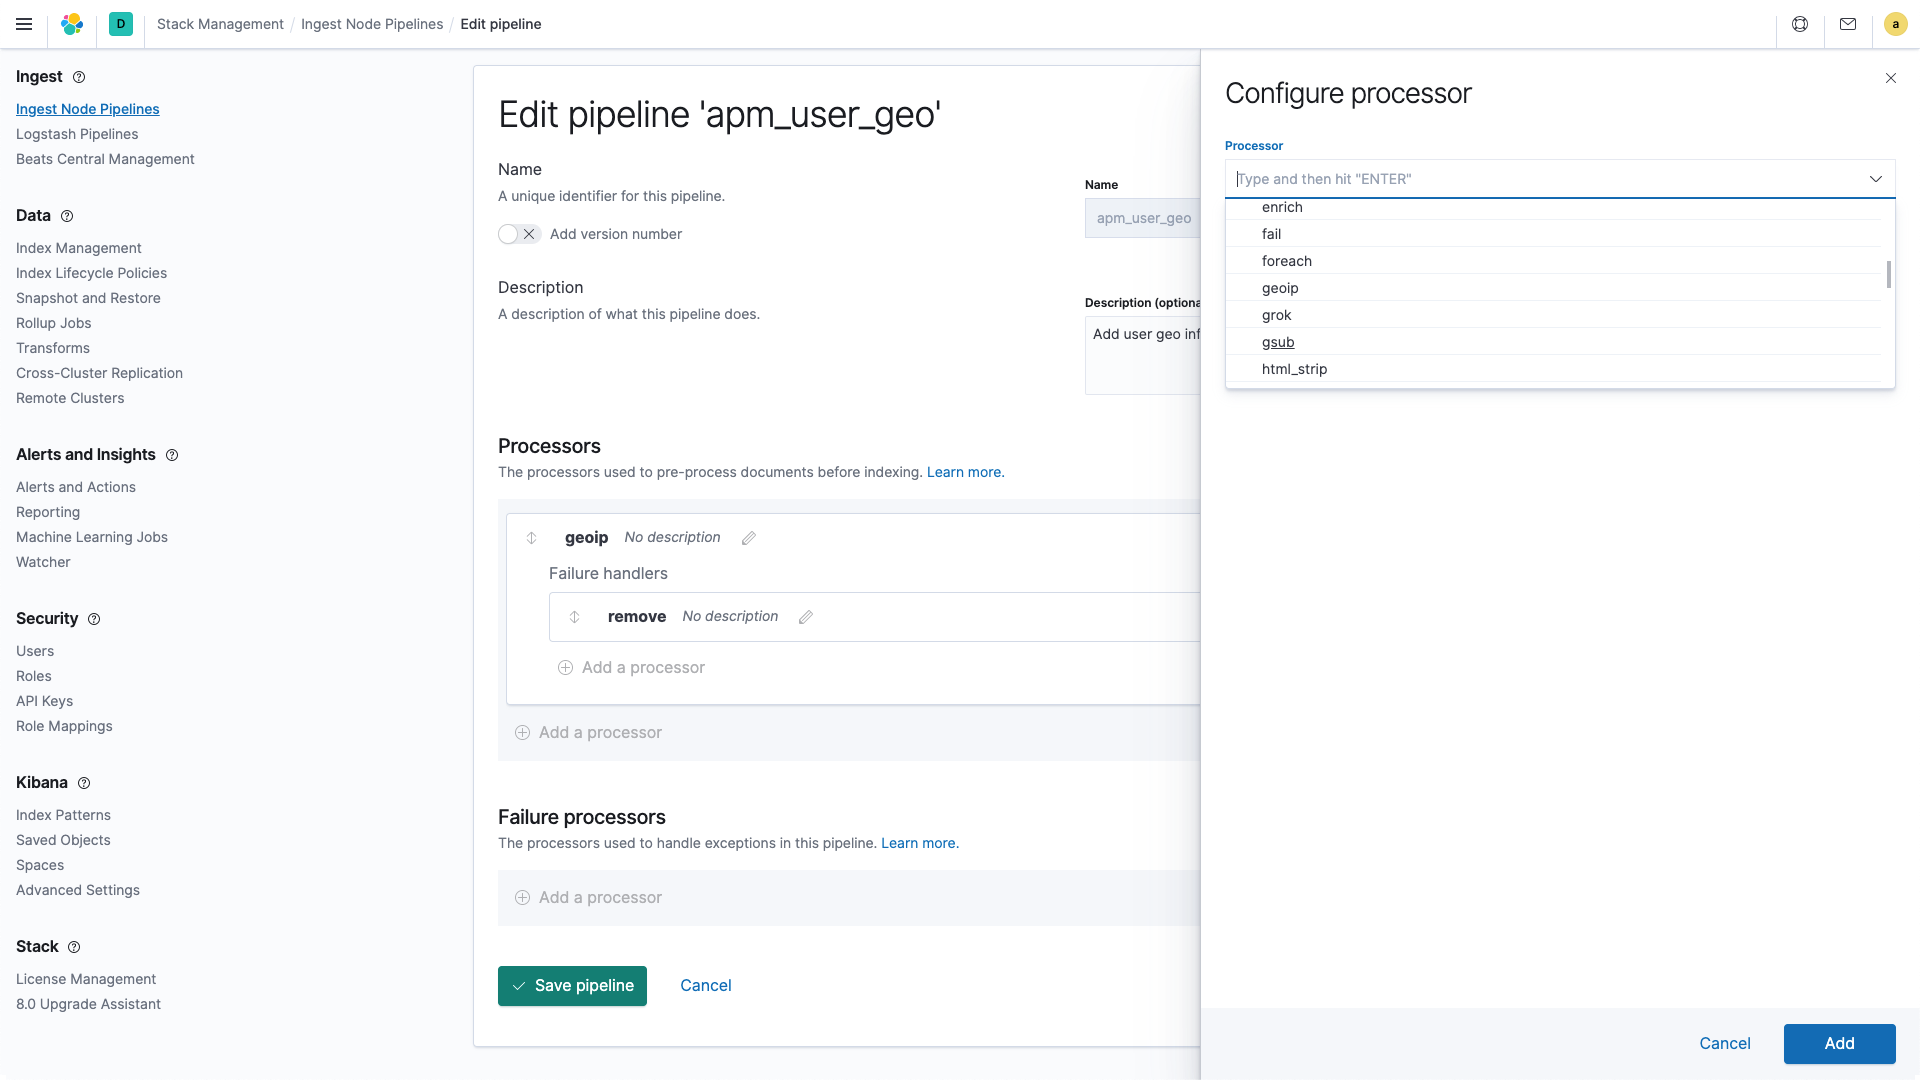
- Ingest Node Pipelines UI, a more visual and intuitive way to parse logs: The benefits of schema on write — parsing and extracting fields from unstructured logs before indexing them — is well established. Even as we have added more out-of-the-box integrations that automatically extract structured fields for common sources, we recognize that users will always need the flexibility to parse and transform custom log formats. In 7.9, we are making this process much simpler and approachable through the general availability of the Ingest Node Pipeline UI in Kibana. Adios, JSON files.
Read more about these features in this detailed blog. Note that given the beta status of these features (with the exception of Ingest Node Pipeline UI), we recommend against using these in production environments.
Enhancing analyst experience with a unified observability overview page
Unification of the three pillars of observability (logs, metrics, and traces) at the data layer is a core differentiator of Elastic Observability. A single datastore for all your observability data is essential for cross-source investigative workflows and helps lower mean time to resolution.
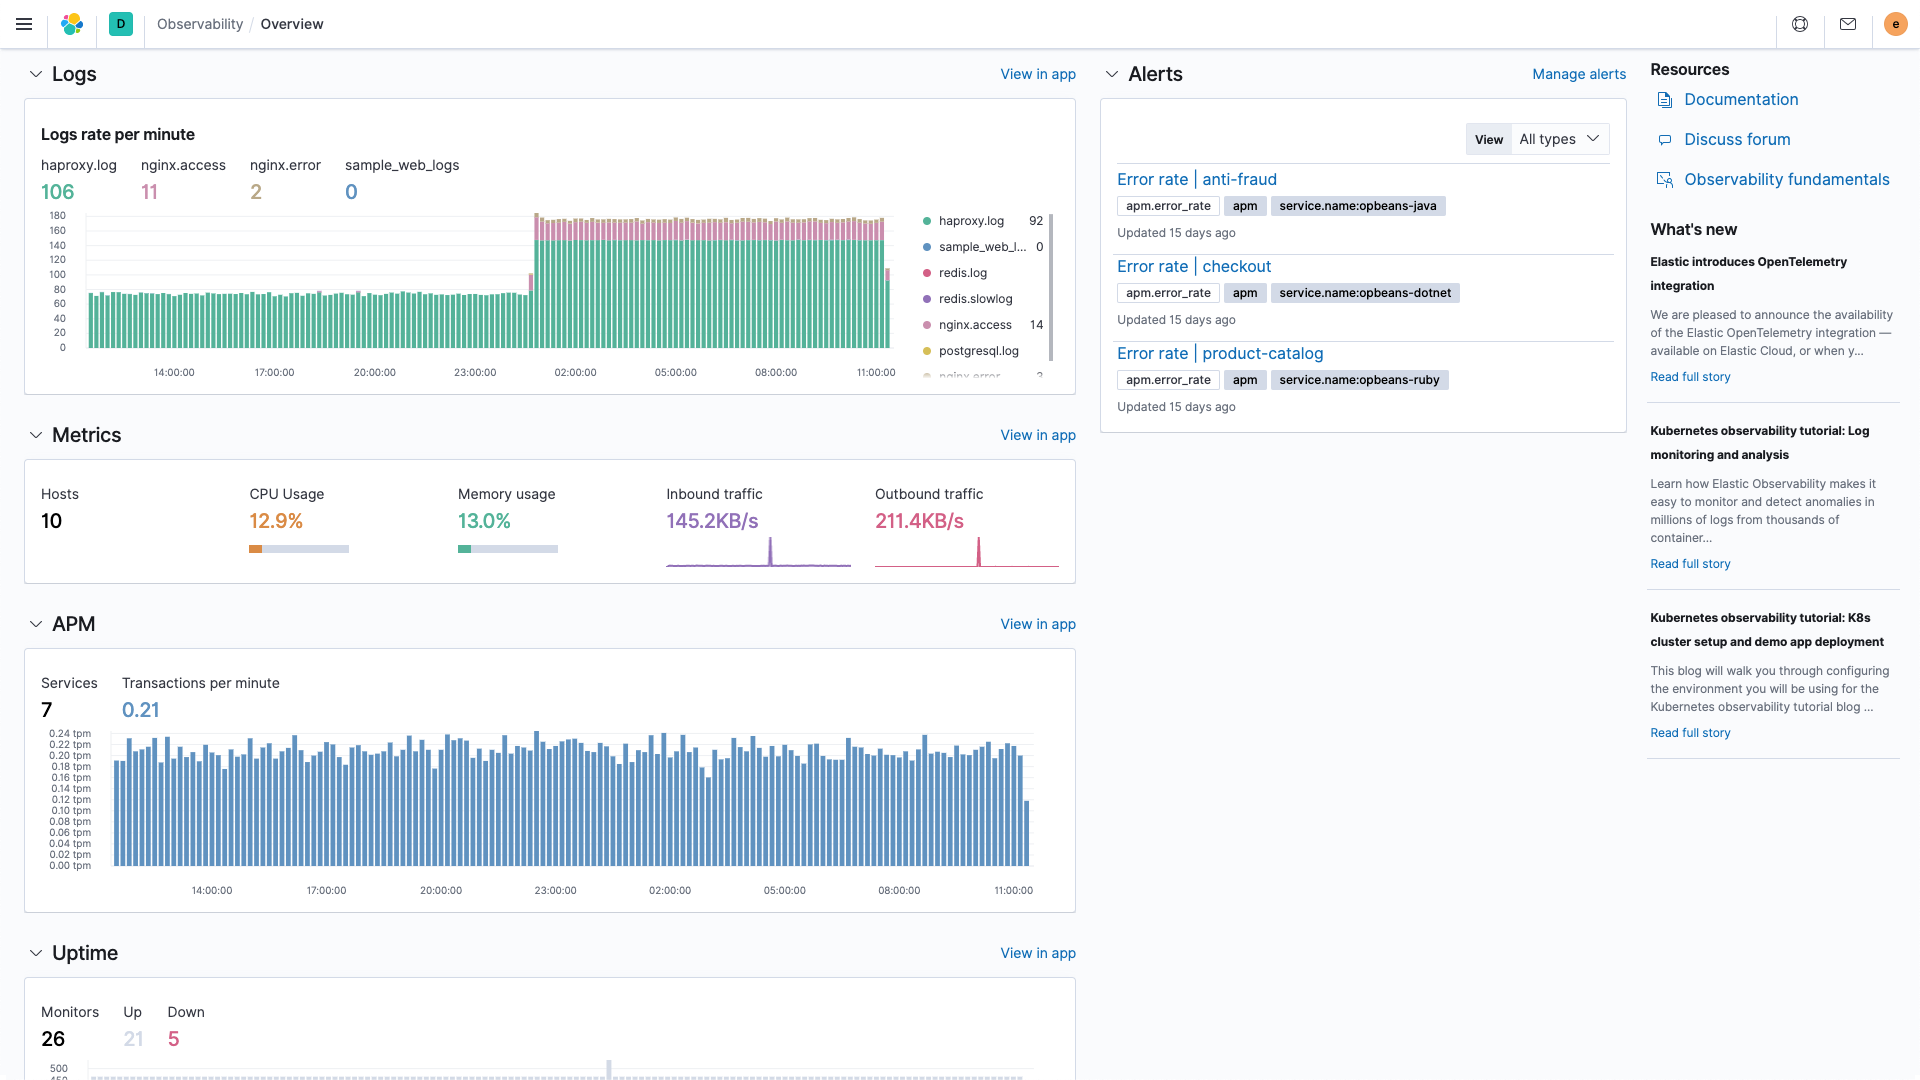
Building on this unified data foundation, we are excited to extend that unification to the visualization layer with the launch of a new observability overview page in Kibana. The landing page presents a curated at-a-glance view of the health of your entire ecosystem by bubbling up key insights from all data streams (logs, metrics, traces, etc.) across all sources (apps, infrastructure, etc.). While you could always create this type of view using the flexible dashboarding features in Kibana, this out-of-the-box page gets you there faster — especially for new users or new setups. The overview page also embeds helpful widgets like newsfeed and training to enhance your in-product experience.
Embracing open standards with the OpenTelemetry integration in Elastic APM
From open code to open community, Elastic is built on transparency. That mindset extends to our support for open standards in the observability space such as OpenTracing, Jaeger, and W3C Trace-Context. We are happy to add the recently formed OpenTelemetry standard to that list. Our goal is to enable users that have instrumented their system using these methods to migrate their apps to Elastic with minimal effort.
OpenTelemetry is a Cloud Native Computing Foundation (CNCF) sandbox project (currently in beta) that provides vendor-neutral, language-specific agents, SDKs, and APIs to collect all observability data (such distributed traces, metrics, and logs) from all your monitored elements. We have added the Elastic Exporter (and contributed it to the OpenTelemetry collector contrib repo) that takes the trace data collected using OpenTelemetry Collector, translates it to Elastic compatible protocol, and sends it to Elastic APM. This means that you can start exploring your OpenTelemetry data in Elastic APM with zero changes to your instrumentation. Just configure the Elastic Exporter into your OpenTelemetry setup and start exploring your trace data in Elastic APM, alongside other logs, metrics, and traces, in minutes.
OpenTelemetry is a fast evolving project, and will expand to include metrics and logs. As a member of the OpenTelemetry project, we are following the roadmap closely and will enhance our support to match their progress. Read more about our OpenTelemetry integration here.
Surfacing security signals in observability data with 50+ prebuilt detections
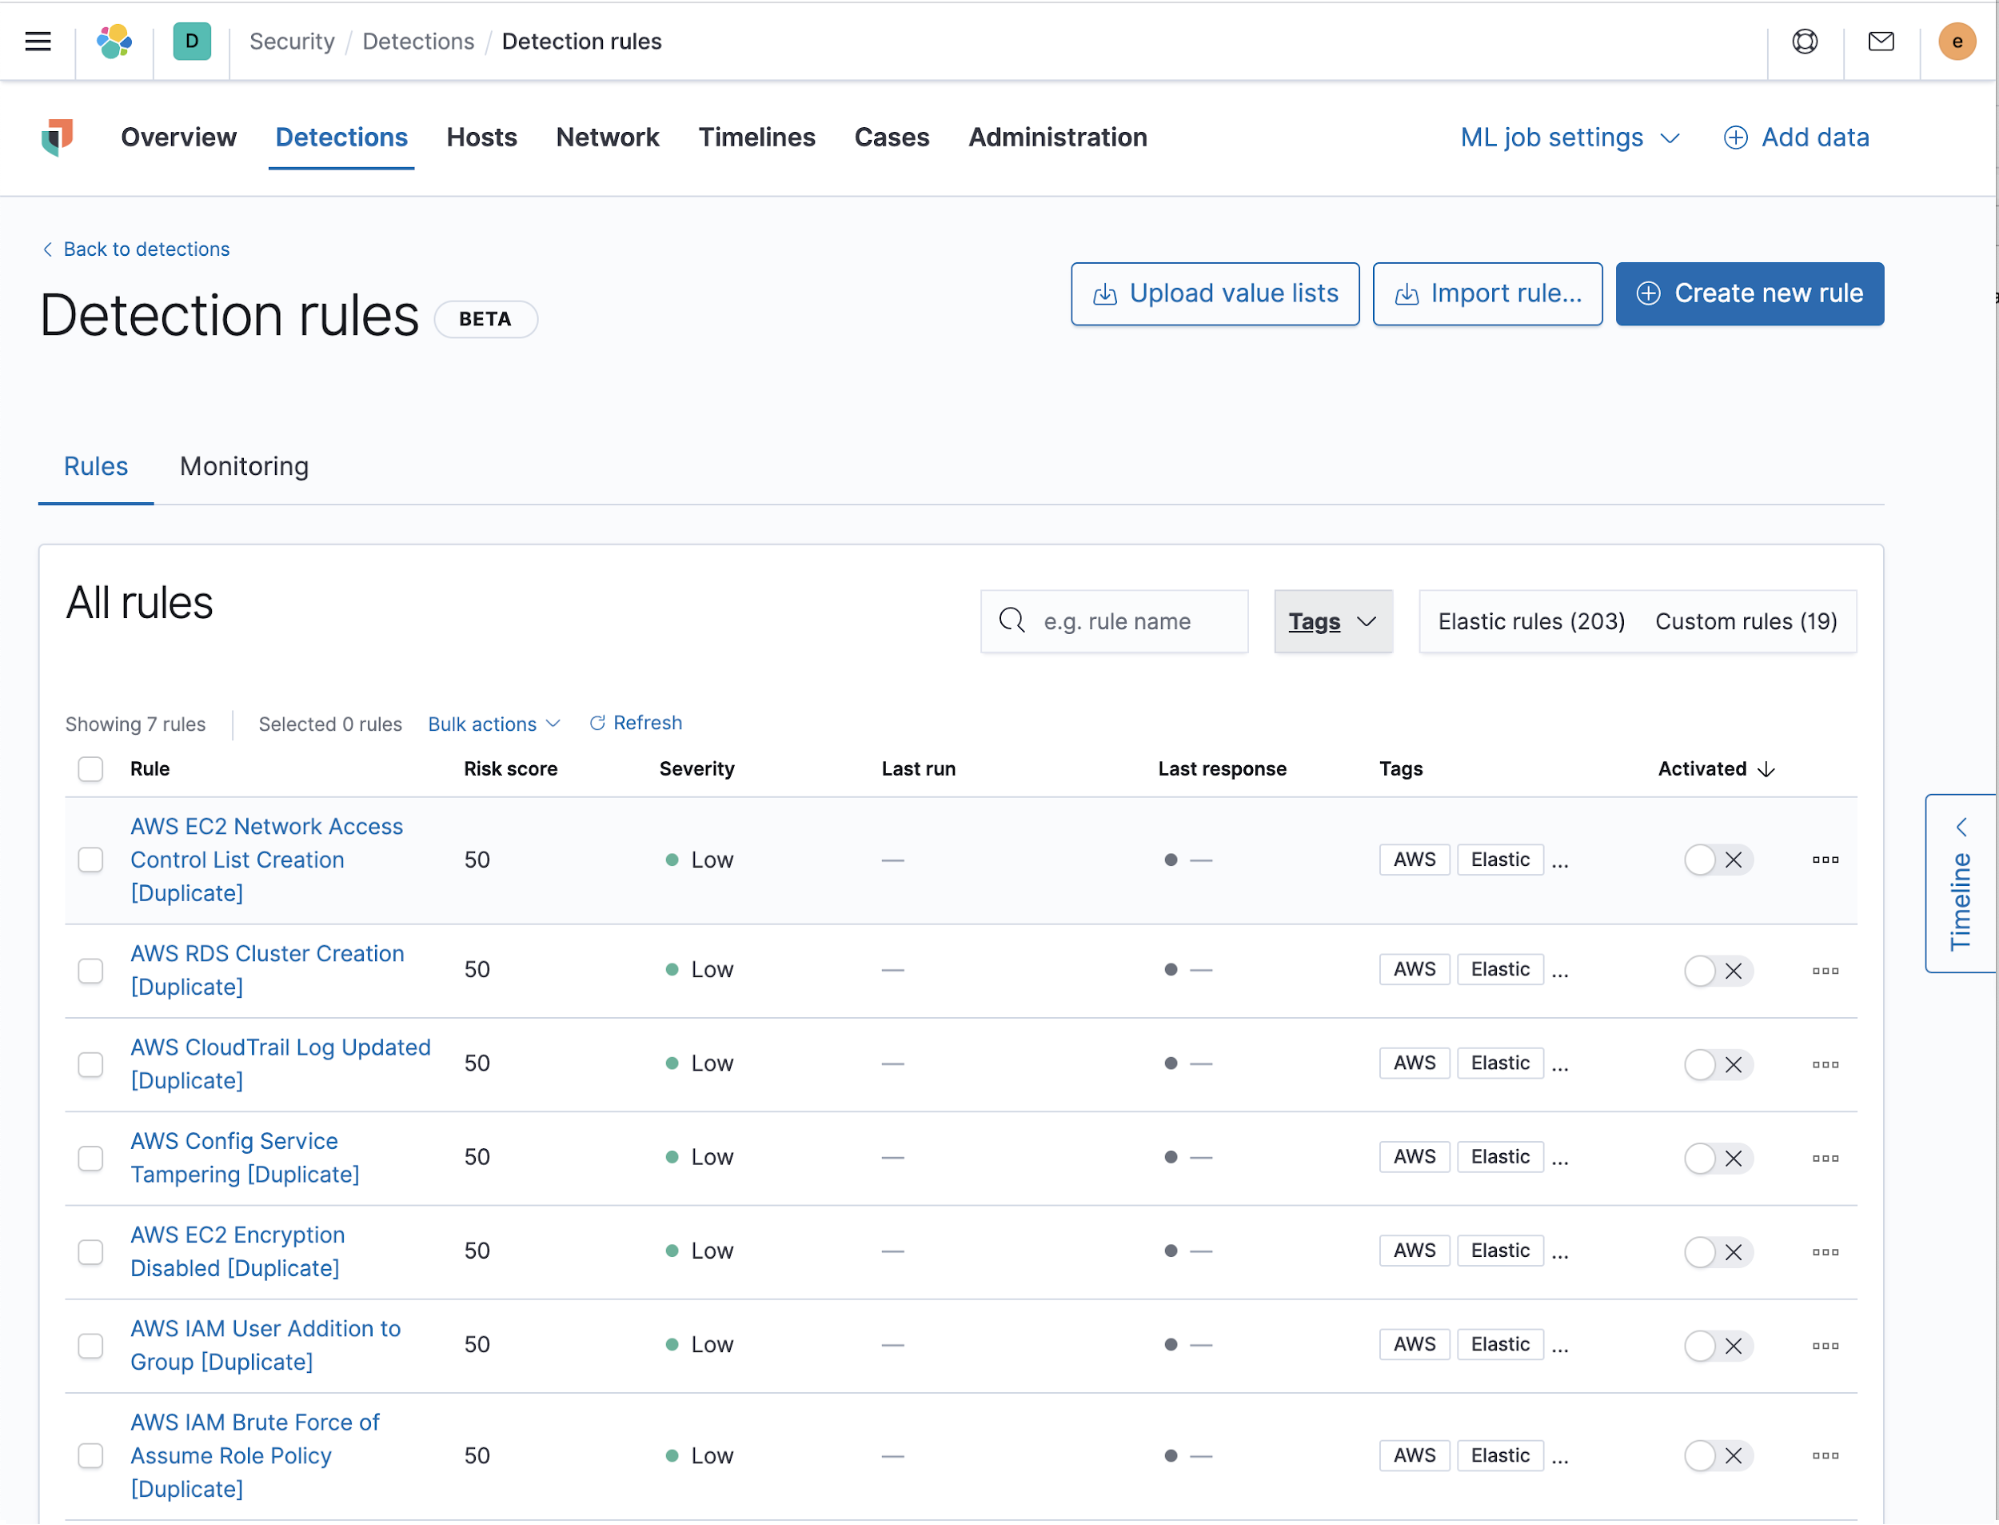
As organizations migrate to the cloud or adopt new tools, security remains a top concern. Each new technology expands the threat envelope, and adds one more element that security teams need to monitor. The good news is that much of the logs and metrics data your operations teams are collecting for health and performance monitoring also includes rich information that your security teams can use to detect malicious behaviors. In 7.9, we are making it possible for security teams to mine those threat signals from observability data in minutes, with zero effort, by launching 50+ turnkey security detections.
The turnkey detections introduced in this release focus on five major detection areas — asset visibility, data protection, identity and access monitoring, log audit, and network monitoring — across two popular platforms, AWS and Okta. For example, this includes a group of unsupervised machine learning jobs to detect uncommon AWS API calls based on user, location, or errors generated. Such a rule could have detected and prevented a recent attack on large financial institutions that used AWS API calls to compromise data.
Another example is identity and access monitoring detections on Okta logs to identify attackers who are trying to tamper with MFA configurations, API tokens, or other critical account parameters. And of course, with the flexible detection engine you are welcome to create additional rules to fit your environment.
Read more about these security integrations in this post.
Additional highlights
Anomaly detection alerting and monitor availability in Uptime: In Elastic Uptime 7.9, users will now be able to see the availability percentage of their monitors (both overall and per-testing node), enabling them to quickly report service-level objectives. Users will also be able to configure alerting to get notified if their availability falls below a specific value. Elastic Uptime 7.9 adds machine learning features that automatically detect if a monitor is experiencing anomalous response durations from one or more testing nodes.
Azure Monitoring enhancement: Our cloud observability story has rapidly advanced in the last few releases with the launch of several new integrations into the Azure, Google Cloud, and AWS ecosystems. In this release, we are continuing to expand and simplify the Azure monitoring use case with the launch of two new integrations: Azure Billing and Azure Application Insights.
Try it out today
To start taking advantage of these new features and capabilities, upgrade your Elasticsearch Service deployment to 7.9, or grab a free 14-day trial of our Elasticsearch Service on Elastic Cloud or install the latest version of the Elastic Stack.