Machine learning, generative AI, and LLMs in observability
A practical SRE manager’s guide to AI observability with generative AI, machine learning, AIOps, and large language models


 Share on Twitter
Share on Twitter

 Share on LinkedIn
Share on LinkedIn

 Share on Facebook
Share on Facebook

 Share by Email
Share by Email

 Print this page
Print
Observability in the age of AI
For site reliability engineers (SREs), AI promises to accelerate discovery, diagnosis, and insight. However, only good data gets great results.
Today’s production environments aren’t defined by a handful of services, predictable traffic patterns, or static infrastructure. Modern systems are cloud-native, distributed, and continuously changing. Kubernetes orchestrates fleets of ephemeral workloads. Microservices communicate across dynamic networks. Code deployments happen multiple times a day. And in an explosive number of new apps, code doesn’t go through a full review cycle anymore. Increasingly, AI-powered applications introduce non-deterministic behavior into production systems.
So, observability is at an inflection point.
While applications continue to generate large amounts of telemetry data — logs, metrics, distributed traces, and profiles — traditional monitoring cannot give your team a holistic picture of your environment, especially with AI.
Familiar pain points for SRE teams include:
- Too many alerts, not enough clarity
- Too much data, too little context
- Faster incidents, slower understanding
Observability must evolve from displaying data to interpreting and acting on it. AI is leading this shift.
The arrival of generative AI (GenAI) — powered by large language models (LLMs) — is creating a simpler path forward. GenAI and AI assistants are changing how engineers interact with observability altogether. Instead of fixed/static dashboards and queries, SREs increasingly use natural language to investigate incidents and understand system behavior.
Now, agentic AI is garnering attention from both developers and executives. Agentic AI represents a shift from reactive operations to proactive, adaptive reliability engineering. AI agents can observe systems, reason across telemetry, and take action through workflows and remediation under human-defined guardrails.
However, to get the most out of GenAI and agentic AI, teams need to focus on the foundation of this whole operation: data.
Laying the foundation for LLM observability tools
Before SRE teams can successfully apply machine learning (ML), GenAI, or LLM-powered assistants to observability, they must solve a more fundamental problem: how telemetry data is collected, structured, stored, and connected.
A gold mine for effective and efficient AI, telemetry data is:
- Reliable: Telemetry reflects real system behavior.
- Context-rich: Logs, traces, and metadata are necessary for causal inferences.
- Real-time: Data arrives continuously.
- Deep: Long-term telemetry storage enables trend analysis and prediction.
As LLMs enable GenAI to process natural language, logs have resurfaced in importance. Once considered unwieldy due to their unstructured nature and verbosity, they are now invaluable diagnostic tools for the truth. Logs are naturally the primary source of context that GenAI tools can analyze and interpret to identify and explain issues.
This is why your data foundation matters. Every layer of the modern observability stack emits valuable data. That includes application logs, infrastructure metrics, distributed traces, events, and business signals.
For traditional monitoring, this explosion of telemetry data, and unstructured data in particular, creates noise that results in:
- Slower incident investigations and prolonged downtime
- Ballooning storage costs with diminishing returns
- Significant human effort spent searching instead of understanding
- Operational drag that slows innovation and delivery
However, GenAI is not a band-aid for an already-broken observability stack. In fact, it amplifies any weaknesses in your system. Without consistent context, reliable correlations, and economically sustainable data retention, even the most advanced AI models can produce misleading insights.
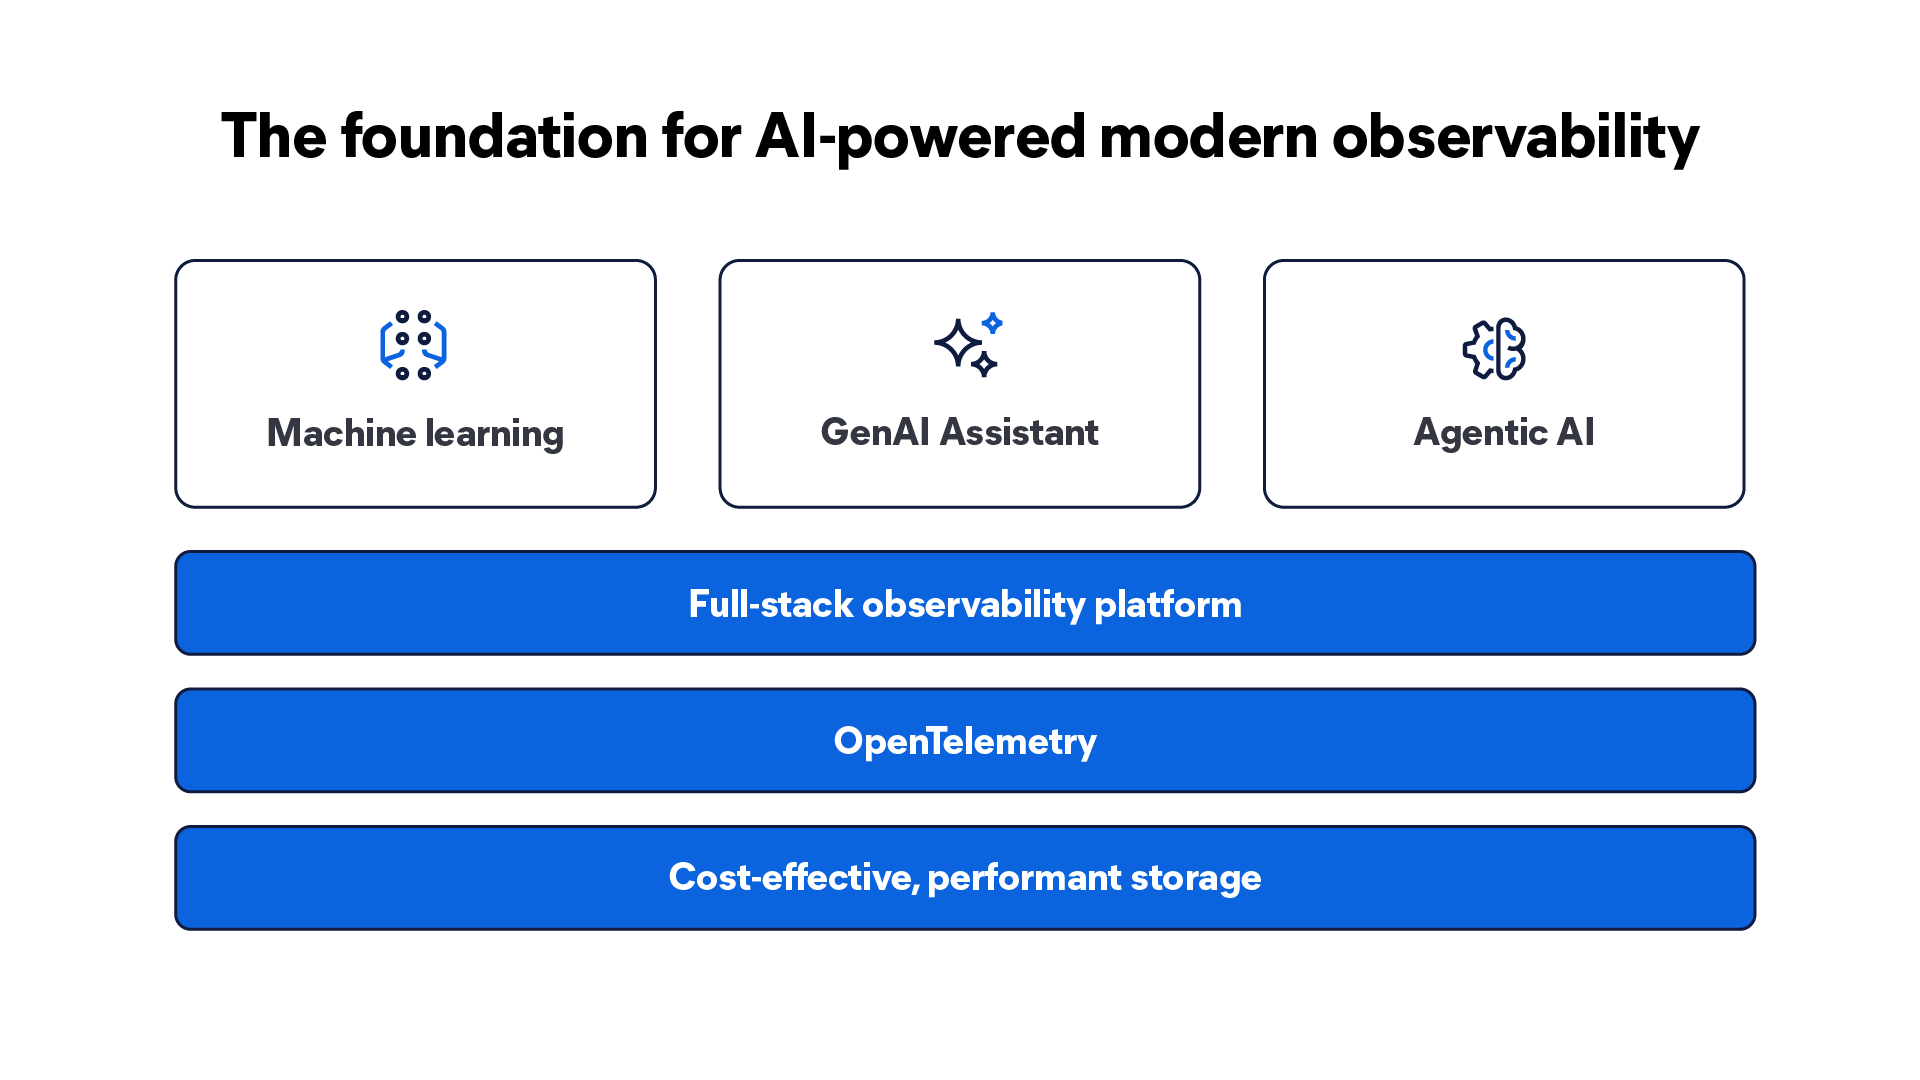
The three advances paving the way for AI-powered modern observability: cost-effective, performant storage; OpenTelemetry (OTel); and GenAI.
Cost-effective log management: Making context sustainable
For years, log management forced painful tradeoffs. Teams either retained rich data at high cost or aggressively sampled and stripped context to save money, often creating blind spots during incidents.
The signals traditionally labelled “noise” and discarded — ahem, logs — are necessary to understanding system behavior patterns or predicting failures. They make up the web of rich, contextual data that ML and AI systems thrive on.
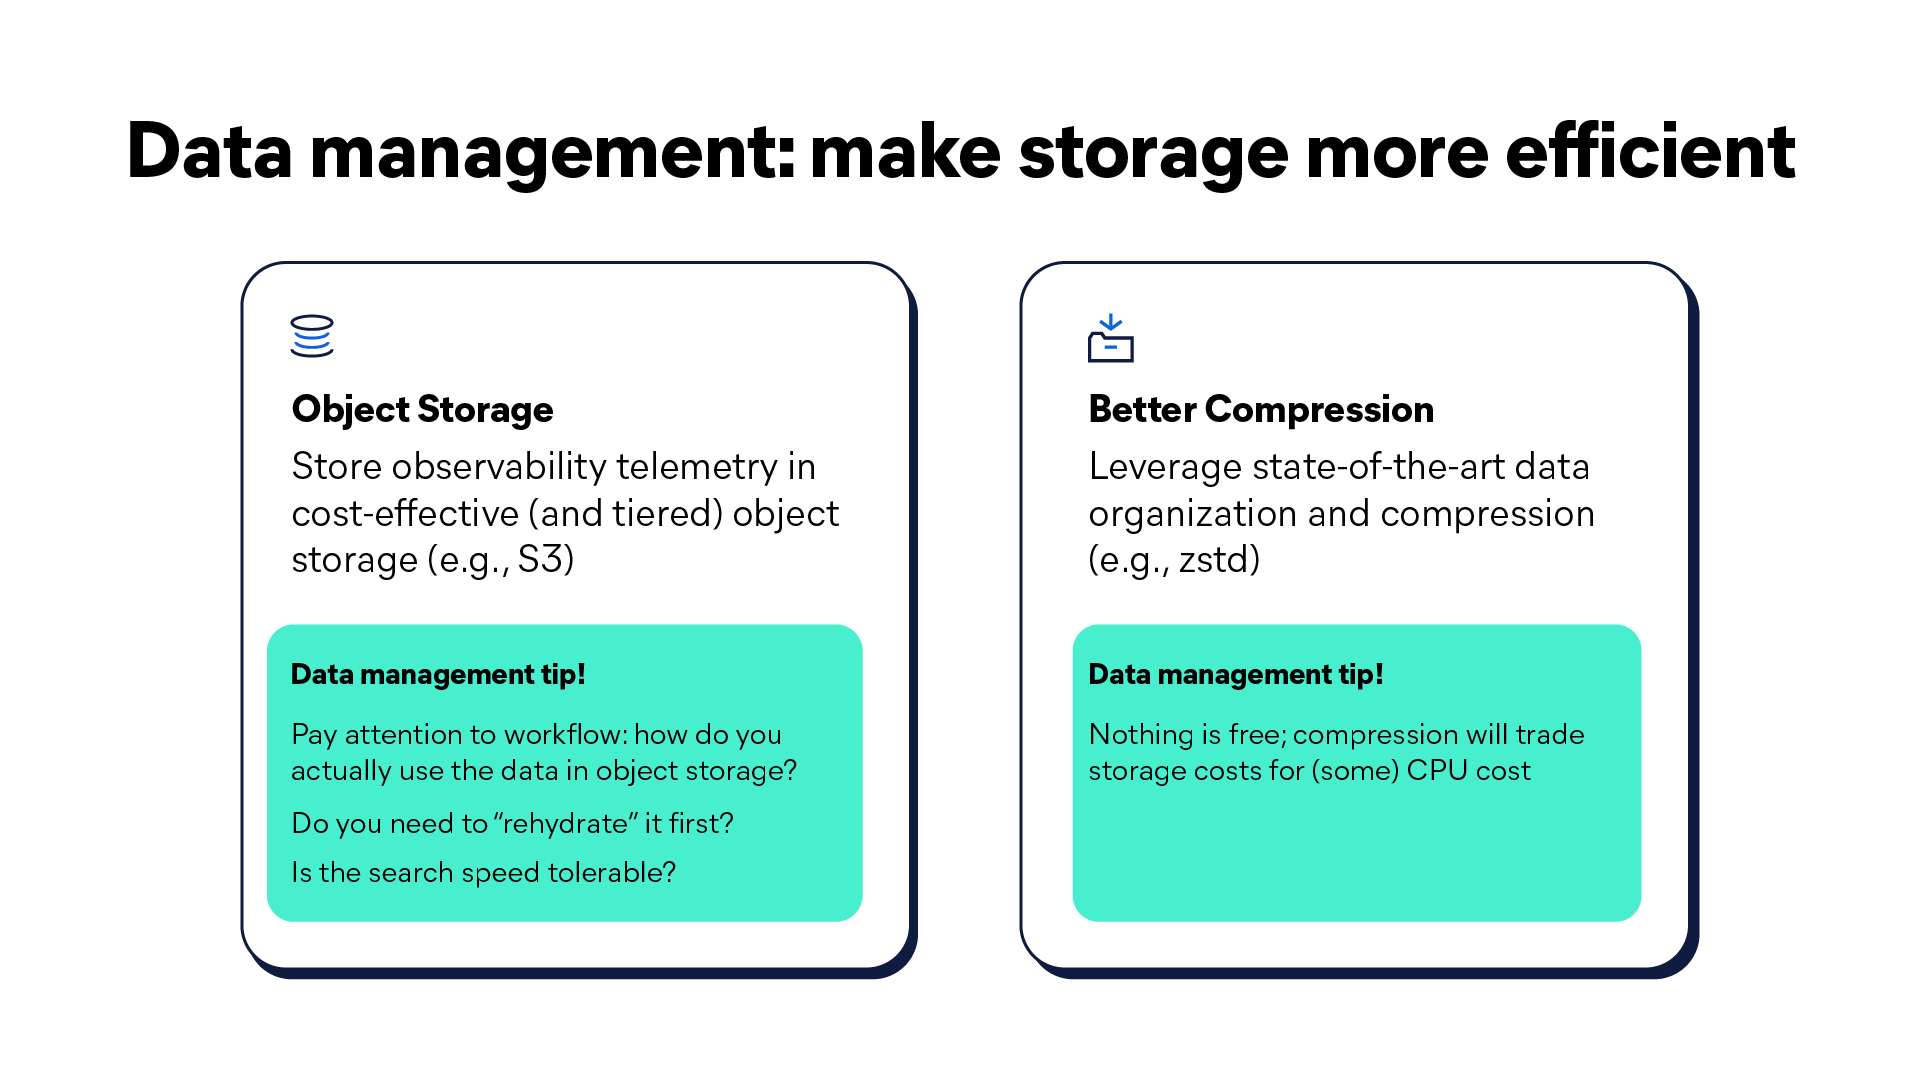
Now, retention is no longer a luxury. Cloud object storage, compression, and indexing make petabytes of data easily searchable at low cost — especially when deployed with an intelligent data tiering and lifecycle strategy.
Modern storage architectures, particularly those leveraging object storage and advanced compression techniques like Zstandard, can achieve remarkable cost-to-value ratios. The secret is organizing related data together and moving it to cheaper storage tiers quickly. This approach lets you have your cake and eat it too — full fidelity data retention without breaking the bank.
AI requires history and depth. Pattern recognition, anomaly detection, and predictive analysis all depend on long-term data. Cost-effective storage makes it practical to analyze real-time and historical telemetry side by side.
As for logs, they are an indispensable fuel for reliable analytics and AI-driven observability. With cost-effective storage, you can afford modern observability built on high-fidelity telemetry data.
OTel: The structural backbone of AI-native observability
If AI is the brain of modern observability, OTel is the nervous system. It provides the shared structure and context that allows observability insights to emerge.
OTel defines open, vendor-neutral standards for collecting logs, metrics, and traces across languages, platforms, and environments. More importantly, it enforces consistency — the single most important requirement for scalable AI-driven analysis.
Why OTel changes everything
- Vendor neutrality: Instrumentation is portable. You own the data you generate and will work with any OTel-compliant observability tooling. This is essential for long-term AI strategies that will evolve over time.
- Standardized semantic conventions: Telemetry signals share consistent metadata such as service names, resource attributes, deployment versions, and environment identifiers. This shared language makes context and correlation possible at scale, no matter how messy your environment gets.
- Auto-instrumentation: OTel can automatically capture rich logs and traces for many common frameworks, dramatically lowering friction and deployment effort.
For logs in particular, this is transformative. Logs are easily enriched with trace IDs, span IDs, and resource attributes, evolving from noisy text files to first-class, correlatable signals.
Next-generation signals: Wide events
Effective modern correlation turns raw data into a navigable narrative. Thanks to OTel’s shared semantic conventions, the automatic correlation of a log from one service to the same event’s metrics and traces is now possible.
This contextual linkage is emerging as a new type of signal: the wide event. Wide events are rich, context-aware records that span services, infrastructure, and time. Instead of fragmented signals, teams get a coherent narrative of what happened and why for investigations.
Wide events preserve the context required for ML and LLMs to analyze and reason accurately across systems. Work continues on an open standard for wide events in OTel, but expect even more effective investigations from GenAI in the future.
How AI drives operational efficiency for observability
This three-pronged approach — cost-effective storage, OTel, and GenAI — should be a non-negotiable foundation. Without it, AI in observability is fragile. With it, observability becomes a proactive partner in operating modern systems.
Let's dive into the details of how ML, AIOps, GenAI, and agentic AI will transform your day-to-day operations and workflows.
The first layer of operational intelligence: ML and AIOps for observability
Digital transformation, cloud migration, and the adoption of distributed, hybrid, and cloud-native architectures have fundamentally changed IT operations. For SRE managers, new tools and platforms introduce unprecedented scale, complexity, and velocity. Within this context, ML and AIOps are the first practical layer of AI in modern observability.
What AIOps does for observability
Essentially, AIOps applies ML techniques to observability data to help teams scale. AIOps excels at pattern detection, correlation, and prioritization when you’re inundated with ever-increasing telemetry data. Some like to think of AIOps as “basic AI.” Yet, its impact on day-to-day operations is anything but basic.
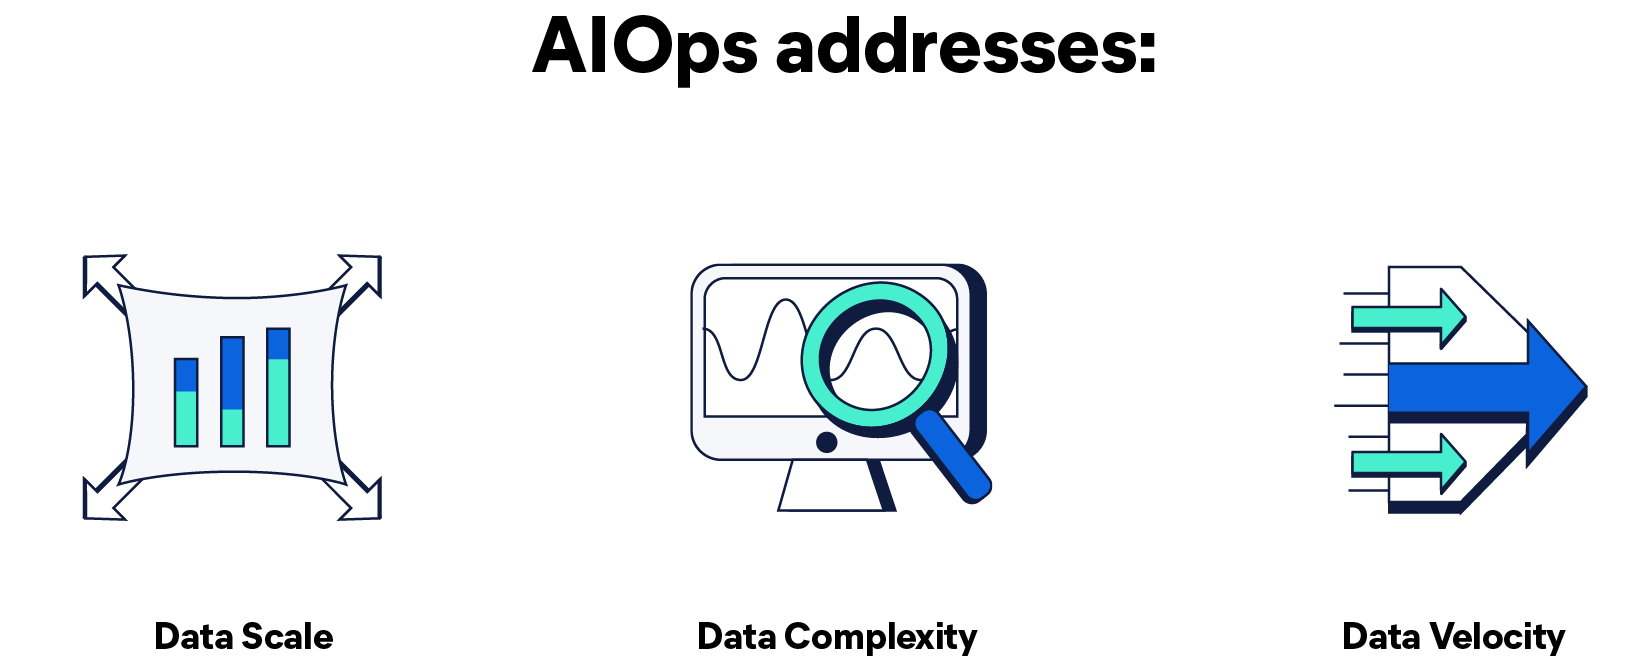
1. AIOps addresses scale
AIOps has a superpower: summarizing massive volumes of telemetry data, which is invaluable to SREs. Instead of delivering raw data streams, AIOps uses ML-driven techniques to surface statistically meaningful deviations and trends. By establishing historical performance baselines, AIOps can detect when an application falls out of typical performance trends.
2. AIOps addresses complexity
Understanding what went wrong, where, and why is often the greatest challenge for SREs. Swiveling between siloed tools to manually correlate signals and establish context is impractical (if not impossible) — especially at high speed and scale.
Clear visual depictions like AIOps infrastructure maps and service dependency graphs can translate raw telemetry into operational context. Contextual navigation helps engineers debug faster. Instead of manually stitching together metrics, logs, and traces, AIOps-powered observability platforms automatically guide users toward relevant data.
3. AIOps addresses velocity
Traditional observability tools struggle to connect continuous changes like new deployments, configuration updates, or patch changes to downstream behavior.
AIOps addresses the correlation gap by continuously tracking application and infrastructure changes and correlating them with system performance and user experience. When a latency spike, error rate increase, or availability issue occurs, AIOps can automatically surface recent changes statistically associated with the anomaly. AIOps helps SRE teams deploying changes at ever-increasing velocities move faster without sacrificing reliability.
Key AIOps use cases in observability
Several observability workflows are already well served by AIOps capabilities:
Anomaly detection: Adaptive baselines detect sudden or unexpected changes in latency, throughput, or error rates.
Classification and summarization: Massive volumes of data (including unstructured data types) can be automatically grouped, categorized, and summarized, dramatically reducing analysis time.
Event and symptom correlation: Clustering related alerts, metrics anomalies, and events cuts down alert noise and accelerates root cause identification.
Pattern-based root cause surfacing: For well-understood failure modes, AIOps can automatically identify and surface likely root causes.
AIOps is already the standard in the observability space, democratizing access to analytics and insights while significantly improving engineers’ ability to identify and troubleshoot issues at scale.
Business and operational impact of AIOps
AIOps isn’t just a technical superhero for SREs. It also delivers tangible business value to help boost the bottom line and keep costs in check through:
- Reduced MTTD and MTTR: Faster detection and resolution lead to less downtime, stronger SLAs, and better customer experiences.
- Lower costs: Intelligent data handling and noise reduction help organizations scale observability without runaway costs.
- Improved team efficiency: By reducing alert fatigue and repetitive work, AIOps frees SRE, DevOps, and ITOps teams to focus on higher-value initiatives.
- Greater agility: Organizations can ship changes faster and more frequently while maintaining confidence in system stability.
As environments grow more complex and dynamic, AIOps is rapidly proving to be mission-critical for businesses that don’t want to be left behind.
The foundation for GenAI investigations and agentic automation
By structuring data, reducing noise, and embedding intelligence into observability workflows, AIOps tells you something went wrong and prepares organizations for more advanced capabilities from GenAI: LLM-powered assistants and agentic AI. For SRE managers, mastering AIOps is the first step in building AI-native operations. It is where observability stops being reactive and begins to scale with the systems it monitors. ML and AIOps are not basic. Rather, they’re the base layer of modern observability.
GenAI: Turning context into understanding with AI assistants for observability
For SRE teams, anomaly detection alone is not enough. Once an alert fires, engineers face the most challenging part of incident response: understanding what’s actually happening and why. This is where AI assistants fundamentally change the observability experience. Powered by LLMs, ML, and neural networks, GenAI can enhance an SRE’s analytic capabilities in many ways:
- Unstructured data processing: Natural language processing capabilities enable GenAI to “understand” logs and error text. What can’t be structured with OTel can still be parsed and understood by LLMs.
- Context building: GenAI correlates events where there are no shared trace IDs, surfacing relationships you never instrumented. It connects a deployment to a memory spike to downstream timeouts based on semantic meaning and timing.
- Communication: It can translate complex data analysis into human language and text, and querying your data is just as simple vice versa.
- Pattern surfacing: GenAI can discover correlations and anomalies in unstructured log data, removing the noise for analyses.
For many SREs, especially those operating in large organizations, the challenge is not a lack of data, but a lack of accessible, trustworthy context. Information needed to resolve incidents is scattered across runbooks, GitHub issues, internal documentation, Slack threads, tickets, and tribal knowledge. Much of it is outdated, incomplete, or difficult to find under pressure. Less experienced SREs may struggle even with a runbook in hand, while recurring incidents resurface without a clear institutional memory of how they were resolved.
AI-powered observability assistants address this gap by acting as context-aware copilots during investigation. They understand not only complex environments, but also internal knowledge stores and how incidents have been handled in the past. AI assistants are designed to help engineers and SREs move from alert to understanding much faster.
Why SRE teams need AI assistants
Cognitive overload defines modern computing environments. An alert may indicate a spike in latency or a rise in 502 errors, but it rarely answers the questions SREs care about most:
Is this issue affecting real users? Are VIP customers being impacted?
What changed recently in our environment?
Have we seen this issue before? What usually fixes this?
While dashboards and alerts surface symptoms, engineers often spend valuable time searching across tools and documents to piece together a narrative, regardless of their systems’ automation maturity. AI assistants help them get to the “why” of what went wrong as quickly as possible.
What is an AI observability assistant?
An AI assistant for observability is a powerful chatbot that relies on three elements:
- Observability data (logs, metrics, traces)
- Internal organizational knowledge (runbooks, issues, docs, chat history)
- LLMs capable of reasoning over unstructured data, including unstructured logs
The new observability interface: Natural language
AI assistants can transform query-driven workflows to conversation-driven workflows.
Instead of writing complex queries or navigating multiple dashboards, engineers can converse with observability systems. LLM and GenAI power the AI assistant to save time, reduce friction, and democratize access to observability insights across teams.
For example, during an investigation, an SRE might ask, “Why did error rates spike in the checkout service?”
Behind the scenes, the assistant translates the intent into a query, retrieves the data, and presents the results, which is especially valuable for less experienced SREs. Instead of memorizing tools and query syntax, they can focus on troubleshooting and understanding systems and outcomes.
AI-assisted root cause analysis
AI assistants are most valuable for root cause analysis.
When anomalies occur, the assistant can automatically correlate logs, metrics, and traces to summarize incidents. It can highlight recent deployments, configuration changes, or infrastructure events that align with the onset of symptoms.
For example, an engineer investigating user impact might ask the assistant to create a visualization of HTTP response codes above 400 over a specific time window. The assistant can translate that request into the appropriate aggregation, retrieve the data, and render a chart — all within the same conversational flow.
A tight feedback loop allows SREs to validate assumptions quickly and confidently, reducing guesswork during high-pressure incidents
What is retrieval augmented generation (RAG) for observability?
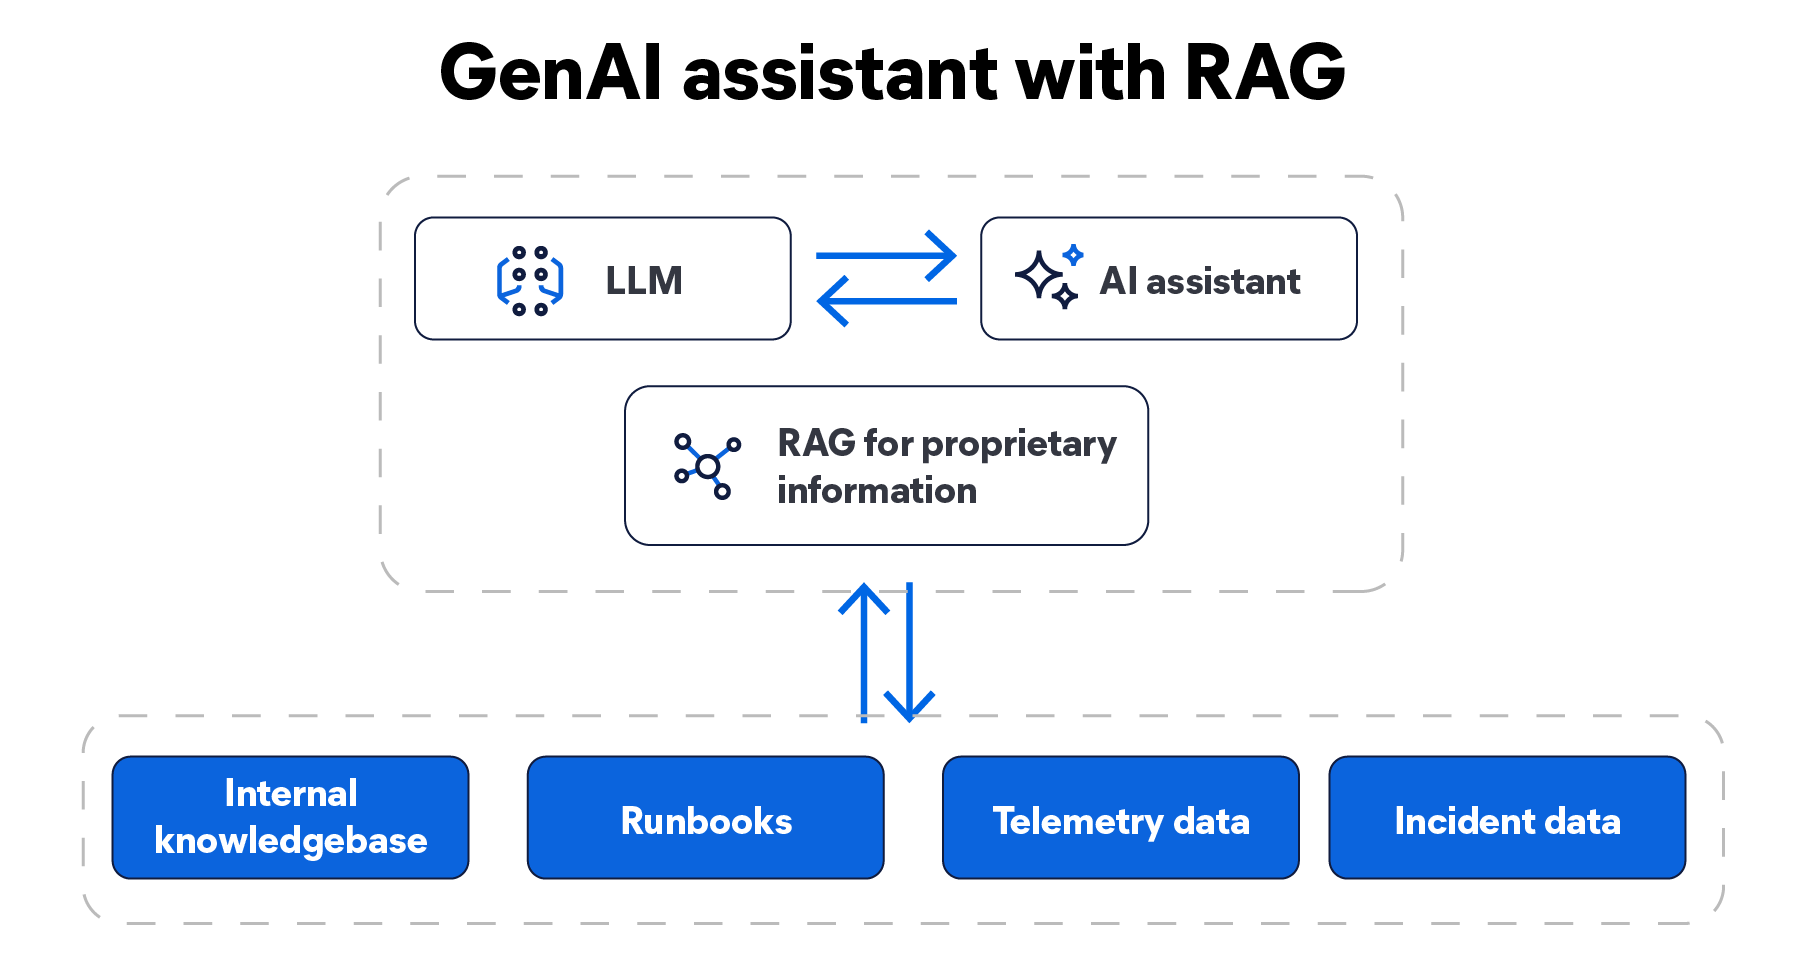
The critical architectural concept that connects internal knowledge to the LLM for AI assistants is retrieval augmented generation (RAG). LLMs by themselves do not know how your systems are built, what your runbooks say, or how past incidents were resolved. RAG grounds AI responses in your data by retrieving relevant internal information and supplying it as context.
RAG is a technique that consists of supplementing LLMs with proprietary data. RAG gives SREs the ability to combine telemetry data, historical incident data, runbooks, and internal organizational knowledge bases into a unified context for GenAI reasoning and resolution.
For observability, this means responses can reference actual system state and historical patterns, including similar past incidents, documented remediation steps, and known service dependencies. RAG gives observability data a real-time knowledge source that AI can reason over, enabling trusted responses tailored to your environment. The result is an assistant that generates organization-specific, situation-aware answers combined with knowledge available in public domains.
Automated documentation
Effective incident response extends beyond technical remediation. Stakeholders need timely updates, clear explanations, and confidence that issues are being handled.
AI assistants can generate summaries and structured incident communications on demand. Take the prompt: “Draft an incident update with root cause, impact, and next steps.” An AI assistant can assemble a coherent message, complete with relevant links and timelines, and deliver it via email or chat integrations.
These communications can later serve as the foundation for post-incident reviews, saving hours of SRE work.
How AI assistants impact teams and organizations
Beyond faster incident resolution, AI assistants provide a broad impact, including:
- Improved and more effective SLOs
- Faster understanding and validation of issues
- Lower cognitive load on-call
- Better support for junior engineers
- Preservation and reuse of institutional knowledge
With effective AI assistants, incident response shifts from a source of constant stress to a repeatable, scalable capability.
The next-generation GenAI for observability: Agentic AI
LLMs are remarkable at synthesizing, generating language, and understanding issues. But alone, they do not meet the demands of operational reliability for observability teams.
Dreaming of a proactive and autonomous system? That dream is closer than ever as GenAI evolves into its next iteration: agentic AI. A quickly evolving discipline, agentic AI has birthed AI agents: digital teammates that can reason and act more autonomously, leveraging other models, data sources, and a knowledge base.
AI agents represent a new generation of observability, one that leverages GenAI, agentic architectures, and automated workflows. They not only identify issues but also independently resolve them intelligently and at scale.
Agentic AI: From analysis to action
Traditional AI systems respond to prompts; agentic AI systems behave as active participants in observability. An AI agent continuously observes telemetry, reasons across context, investigates, and takes action toward defined operational goals.
What are AI agents in observability?
AI agents are powered by agentic technology and LLMs — even sometimes referred to as LLM agents. Where LLMs enable conversational communication between agent and user, agentic technology enables reasoning, planning, decision-making, and action.
How are AI agents different from AI assistants?
AI agents:
- Maintain internal state and reasoning loops
- Plan and decompose tasks into subtasks
- Coordinate across multiple specialized components
- Act autonomously under defined policies
An AI agent works like an autonomous team member with logic: it knows the goal, evaluates the environment, and takes steps toward resolution.
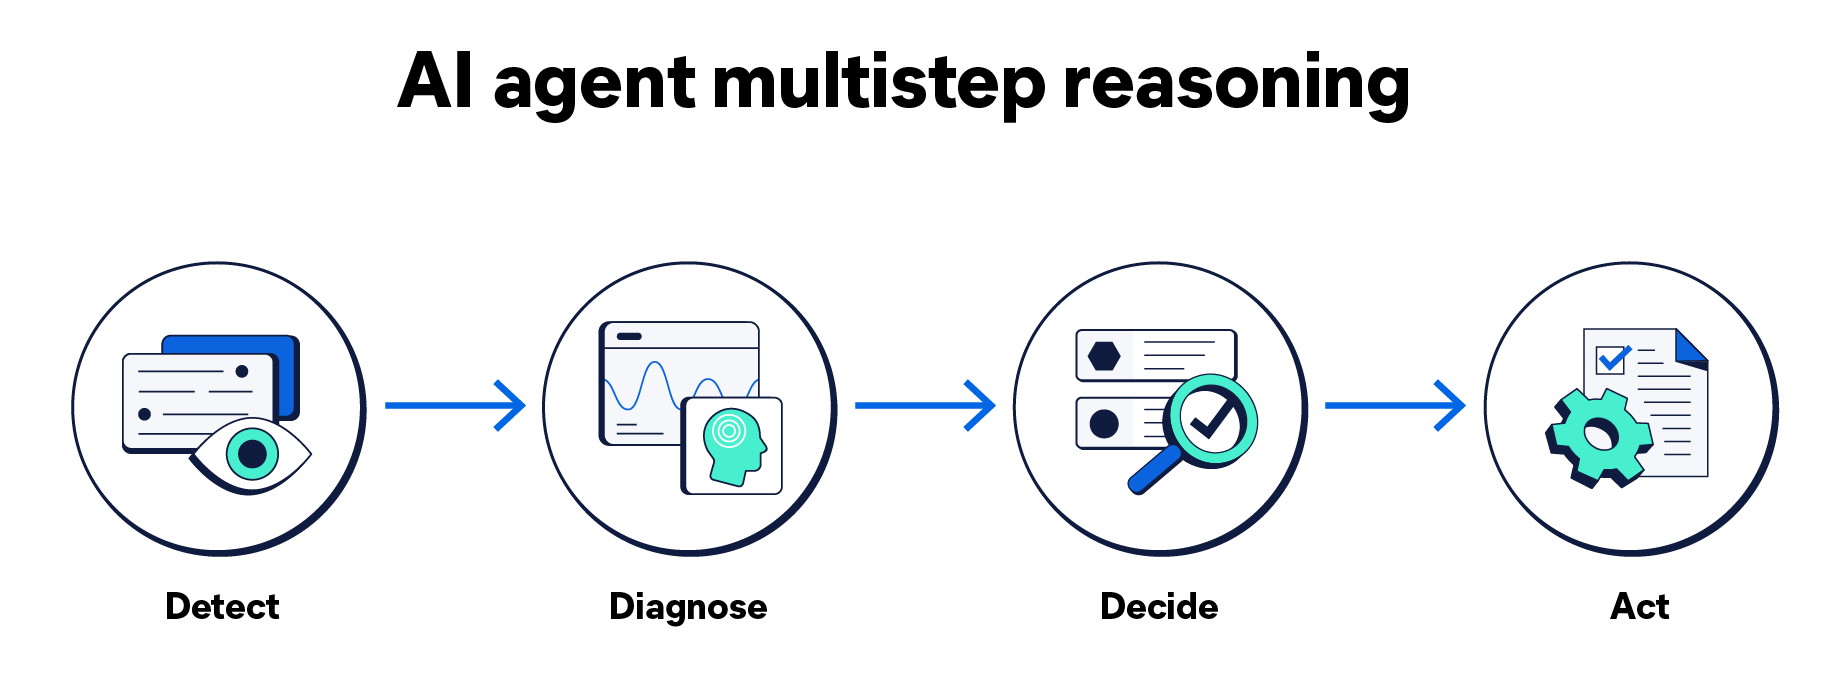
In observability, a basic, effective agentic workflow looks like this:
- Detect anomalies or signals in telemetry streams.
- Diagnose probable root causes and correlations.
- Decide on action plans based on confidence and policy.
- Act by triggering workflows, remediations, or alerts.
Imagine a scenario where a GenAI agent correlates a latency spike with a recent deployment. It searches and identifies the regression across recent logs and traces, post-deployment. And it decides on a series of actions, including recommending a rollback for operator approval.
Human SREs are still extremely important. They are needed to validate the root cause of an issue and manually make the decision to roll back the code.
Model context protocol (MCP) for agentic AI
As LLMs move into agentic use cases, their effectiveness becomes dependent on their ability to access not only relevant data but also relevant tools. This is where model context protocol (MCP) comes in.
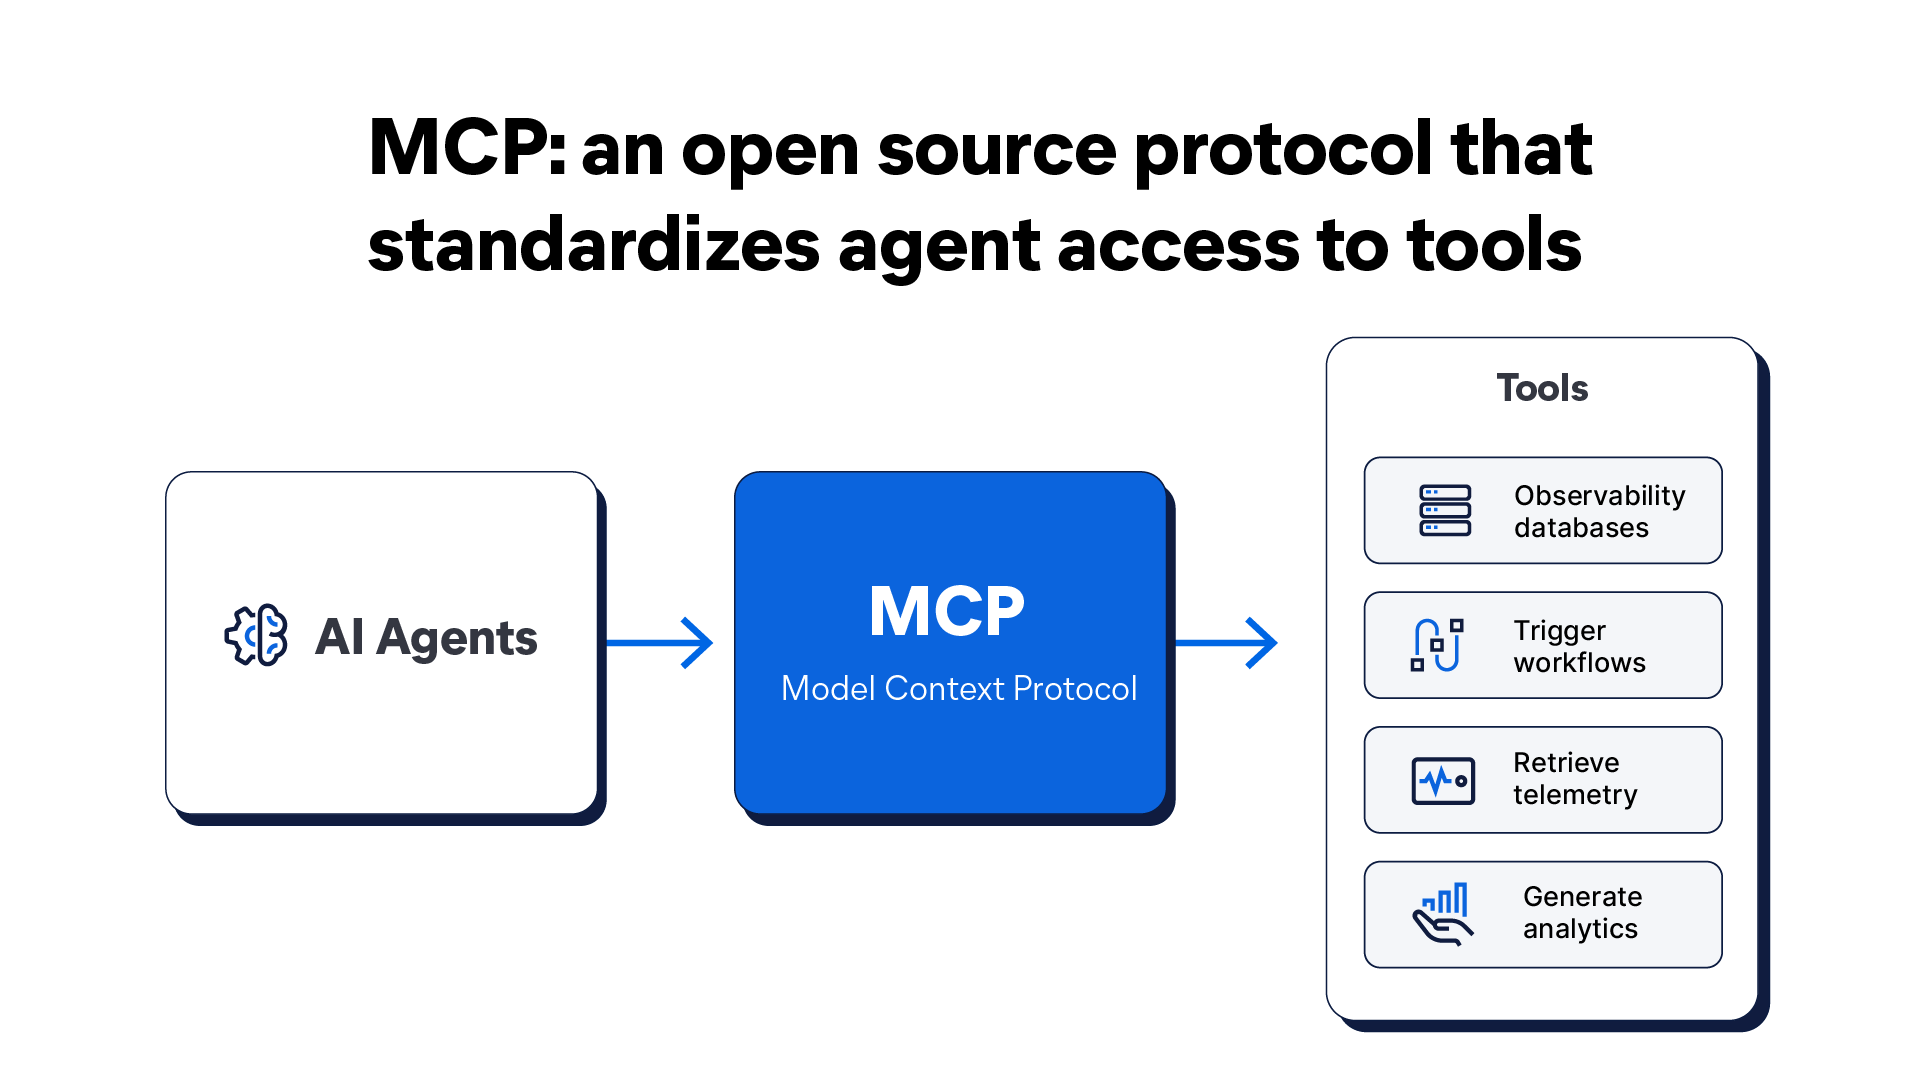
MCP is an open source protocol that standardizes agent access to tools. In practice, AI agents can query observability databases, trigger workflows, retrieve telemetry, and generate analytics while enforcing access control and logging every action.
Today, agent engineers and developers rely on a patchwork of brittle, high-friction workarounds to connect agents to internal tools. Custom metadata formats, inconsistent interfaces, and poor tool discoverability limit interoperability, making it costly and error-prone to adapt agents to new systems, often requiring extensive retraining or reprogramming.
MCP creates a predictable and reliable ecosystem for developers by introducing clear, shared standards across the agent-tool boundary. It ensures that AI is not a rogue agent with unfettered privileges, but a tool-aware process that respects enterprise governance and security constraints.
Vendor agents versus custom agents for agentic AI
As agentic AI is embraced within observability, the age-old question still stands: buy or build? Vendor-built agents may be suitable for basic tasks, but they don’t always translate well to the unique combination of technologies, tools, and workflows in each application environment.
AI agent builders provide an alternative. They use a natural language chat interface to help create custom agents and tools for your environment’s needs and use cases. In this framework, SREs are not replaceable, but rather an integral part of the agentic AI evolution.
From reactive to proactive: The next baseline in observability
This next-generation of GenAI shifts observability from a pane of dashboards and assistants to an engine of operational intelligence and automation:
- RAG grounds AI in the appropriate system context.
- MCP standardizes AI access to tools.
- Agentic AI enables autonomous, multistep operational reasoning and automation.
With agentic AI, observability brings SRE teams closer to a more proactive posture focused on automation and reducing operational friction. As AI becomes integrated into critical infrastructure, we reach a new frontier: observability for AI systems themselves — where AI workloads must be monitored, secured, and governed like any other production service. In a world where AI assistants and agentic AI have access to your internal environments, architecture, and knowledge base, LLM observability becomes necessary for managing performance and providing safeguards.
LLM observability: Managing and securing AI systems
As organizations embed LLMs and GenAI into production workflows, they need observability for AI, not just with AI.
AI systems themselves become mission-critical workloads for observability and other operational teams. They introduce new failure modes, cost dynamics, and security risks that traditional observability was never designed to handle.
To operate AI safely at scale, SRE teams need LLM observability.
Why LLMs need observability
LLMs are complex, black-box systems with behavior that can change over time. Operational systems require safe, reliable decision-making.
Furthermore, AI is subject to increasing safety concerns, especially if it has unfettered access to systems or data. In a production context, LLMs must be governed by permissions and be auditable. If not, they may jeopardize production:
- Affecting user experience directly
- Influencing automated decisions
- Consuming variable and sometimes unpredictable resources
- Interacting with sensitive data
AI failures are often subtle. A response can be technically valid but operationally wrong, biased, or unsafe. For this reason, LLMs must be measured, monitored, debugged, and governed.
LLM observability is critical to safeguarding system reliability and user trust.
LLM reliability concerns
LLM models depend heavily on external providers, rapidly evolving model versions, and managed infrastructure that sits outside the organization’s direct control. This dependency chain creates fragility, while versioning compounds those inherent risks.
Model updates are frequent and often opaque, and even minor changes can alter response quality, latency, or behavior in subtle ways. Quality regressions may not manifest as outright errors, but as degraded relevance, inconsistent responses, or increased hallucinations — issues that are difficult to detect without explicit observability. LLM drift (a decrease in a model's performance, accuracy, and relevance over time) is a reality that must be monitored.
By instrumenting AI systems with the same rigor as other production services (i.e., tracking performance, quality signals, and behavioral changes), teams can detect regressions early and respond before users are impacted.
LLM security, privacy, and compliance concerns
AI systems introduce unique security risks. From sensitive data exposure to prompt injections and model abuse, LLMs have become another vulnerability within the already sprawling attack surface of modern digital environments.
Logs and prompts may contain proprietary information. Responses may leak internal information. Malicious inputs can manipulate model behavior. Models can be tricked into bypassing safeguards. The list of security concerns goes on, especially considering regulatory data and audit requirements in the finance, healthcare, and public sectors. LLM observability moves from a best practice to a hard necessity.
The good news is that observability enables the detection, auditing, and enforcement of these security, privacy, and compliance concerns.
Measuring the effectiveness of LLM observability
As LLMs quickly become ubiquitous in the modern tech stack, the same principles that build resilient cloud-native systems must apply to AI itself. Here are some dimensions to measure LLM observability’s effectiveness in your organization.
Performance metrics
- Latency and response time: How long it takes for a model to produce answers
- Throughput and concurrency: How many requests a model processes at a time
- Error rates and timeouts: How many times a model produces invalid responses
These metrics determine whether AI-powered features meet user expectations.
Resource utilization metrics
- Token usage per request: How many tokens are processed? This enables teams to fine-tune prompts to improve resource consumption.
- Cost by team, service, or feature: How much does it cost, period?
- CPU/GPU usage: How efficient is the model during inference?
Without cost observability, LLMs can quietly become a financial risk.
Quality and reliability signals
- Relevance and accuracy: How often a model produces relevant and accurate outputs
- Hallucination rates: How often a model produces erroneous outputs
- Bias: How often the trained data contains biases that can be amplified over time
- Consistency across similar inputs: How often a model produces consistent outputs
Though these metrics are more difficult to define, they are key to assessing an LLM model’s effectiveness.
Conclusion
For SRE managers, the mandate is clear: The future belongs to teams that can integrate human judgment and acumen with machine intelligence, expertise from LLMs, and automation with guardrails. The ability for observability teams to embed AIOps, AI assistants, and agentic AI into their workflows is necessary given the increasing complexity of today’s cloud applications and distributed environments. While progress often comes in stops and starts for IT professionals, there’s no question that the next GenAI wave is here.
Share
- Share on Twitter
Share on Twitter
- Share on LinkedIn
Share on LinkedIn
- Share on Facebook
Share on Facebook
- Share by Email
Share by Email
- Print this page
Print